A Study on Fusion and Visualization using Multibeam Sonar Data with Various Spatial Data Sets for Marine GIS
Seong-Kyu Kong†
(Received December 2, 2008; Revised January 20, 2009; Accepted May 25, 2010)
Abstract:According to the remarkable advances in sonar technology, positioning capabilities and computer processing power we can accurately image and explore the seafloor in hydrography. Especially, Multibeam Echo Sounder can provide nearly perfect coverage of the seafloor with high resolution. Since the mid-1990's, Multibeam Echo Sounders have been used for hydrographic surveying in Korea. In this study, new marine data set as an effective decision-making tool in various fields was proposed by visualizing and combining with Multibeam sonar data and marine spatial data sets such as satellite image and digital nautical chart. The proposed method was tested around the port of PyeongTaek-DangJin in the west coast of Korea. The Visualization and fusion methods are described with various marine data sets with processing. We demonstrated that new data set in marine GIS is useful in safe navigation and port management as an efficient decision-making tool.
Key words:Decision-making tool, Marine GIS, Multibeam Echo Sounder, Spatial data fusion
†Corresponding author (Korea Hydrographic and Oceanographic Administration, E-mail:[email protected], Tel: 032-880-0532)
1. Introduction
Since the Second World War, technologies in the field of hydrographic surveying have been continuously developed. To obtain accurate high resolution data of the seafloor, many instrument, such as GPS, Sonar sensors and various motion sensors has been used. Information of hydrographic surveying was mainly used to support safe navigation. Moreover additional demands have been increased in the fields of marine development, conservation marine defense, leisure and so on[1]. The main goal of this study is to
propose a new spatial data type to support safe navigation and port management through visualization and fusion methods using various marine spatial data sets around the port of PyeongTaek-DangJin.
2. Methods and Materials
The study area which is located in the west coast of Korea as the designated trading port(Figure 1).
The high resolution data set using shallow EM3000 Multibeam Echo Sounder manufactured from Norway was acquired in compliance with the special order in
Figure 1: Survey area
standard of hydrographic surveying [1], recommended by IHO(international Hydrographic Organization). Table 1 and Table 2 show data acquisition parameter and equipment for bathymetric surveying. Additionally, various marine data sets are handled for making new one by visualizing and combining (Table 3).
Table 1: Survey specification for bathymetry Amount
of work Interval
(pitch) Remarks
1,000km 50m, 300m Tidal data : PyeongTaek station
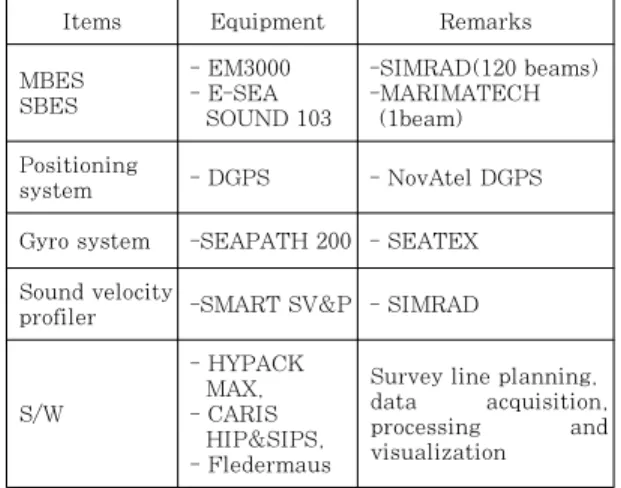
Table 2: Equipment for bathymetry
Items Equipment Remarks
MBES SBES
- EM3000 - E-SEA SOUND 103
-SIMRAD(120 beams) -MARIMATECH (1beam) Positioning
system - DGPS - NovAtel DGPS Gyro system -SEAPATH 200 - SEATEX Sound velocity
profiler -SMART SV&P - SIMRAD
S/W
- HYPACK MAX, - CARIS HIP&SIPS, - Fledermaus
Survey line planning, data acquisition,
processing and visualization
Table 3: Data list for the study
Items Data type Data name Remarks
Seafloor DEM
Multibeam data
Multibeam data from surveying
22.6G
Sounding data from chart
Digital nautical chart Survey sheet ENC
Land DEM
Land DEM from EPA in Korea
DEM of Han
River 30″
DEM of
Sumjin iver 30″
Raster
chart Raster Type Digital nautical chart DXF Type
char Vector Type Digital nautical chart
Satellite image
1m high
resolution IKONOS
image 1.7Gbyte/
file 5m high
resolution LANDSAT
and IRS 65Mbyte/
file
3D Object Objects Light buoys crane
2.1 Multibeam sonar data
The coordinate system of the data is WGS-84. The projection method used is UTM. and the datum level is ALLOW (Approximately Lowest Low Water) datum level like Figure 2.
Figure 2: Sample of multibeam data file
2.2 Sounding sheet data
Sounding Sheet data used in this research are from the MSIS (Marine Spatial Information System) which was established by National Oceanographic Research Institute. The data include soundings, coastal lines and seafloor
composition. The data from the MSIS are BESSEL and Mercator.
All data from the No. 350 nautical chart were checked. Data are based on the latest one, including the surveyed scale, survey intervals with various range, tidal currents and big tidal ranges in the survey area.
To interpolate the sounding sheet data, some kinds of interpolation methods were tested. Three Possible interpolation methods to generate the detailed grid data for DEM in Figure 3 were compared. The result shows that both the Triangulation with Linear and the Krigging interpolation methods are similar, and since it takes 10~30 hours to process logically the dta by the Krigging interpolation and the weight average methods are available for small volumes of data.
Figure 3: Processing results by the natural neighbor interpolation and triangulation with linear interpolation
Figure 3 shows the removed multibeam survey area after applying the natural neighbor interpolation method (left) and TIN with linear interpolation (right) for the sounding sheet data. Especially, there are few data points around any one point in any range. The interpolation method is not considered proper to apply for sounding sheet data. It is difficult to set the interval when applying the natural neighbor interpolation method for the
data. The Triangulation with the linear interpolation method is good for a 50 MB volume of data. The quality is proper as well, comparing with the krigging interpolation method. In the study, the multibeam data and sounding sheet data are used to generate the 3×3 grid for two area. The multibeam dta were used within the port limits while the survey sheet data are utilized with the interpolation in the other areas (No. 350 in this study) (Figure 4). The processes included the removal of survey data interpolation in the other areas.
Figure 4: Processing results by the Krigging interpolation
2.3 Land DEM(Digital Elevation Model)
The land digital elevation data, called DEM includes headers such as coordinates, points along with digital information for column and cell sizes and practical elevation data with grid array values. The land DEM data are compatible with the ASCII grid type in the ARCVIEW S/W.
Figure 5: Land digital elevation model
The digital elevation data with 30 seconds time intervals are consist of two files covering the Han river and the Sumjin river (Figure 5).
2.4 Nautical chart data W350
The digital nautical chart data are used in the marine spatial information system which is established by National Oceanographic Research Institute. In the database system, data are stored without a specific format and converted to dxf, shp file formats, also data are stored in the data base to enable query easily. Using this function, the files to generate a land DEM texture.
2.5 Image processing of nautical chart
The Geotiff file of nautical chart layer is basically generated from W350 nautical chart by using a horizontal image data because the nautical chart implies not the concept of three dimension. The Geotiff format file is used to merge with position data with each pixel. Figure 6 shows flow for making Geotiff file from digital nautical chart.
Figure 6: Flow for making geotiff file from digital nautical chart
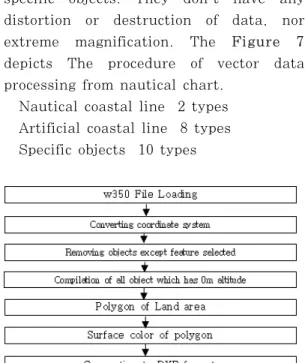
2.6 Processing the vector data of the nautical chart In this study, the nautical chart with
vector type data with vector type are useful to understand the coastal lines of specific objects. They don't have any distortion or destruction of data, nor extreme magnification. The Figure 7 depicts The procedure of vector data processing from nautical chart.
Nautical coastal line 2 types Artificial coastal line 8 types Specific objects 10 types
Figure 7: Processing Flow of vector data of the nautical chart
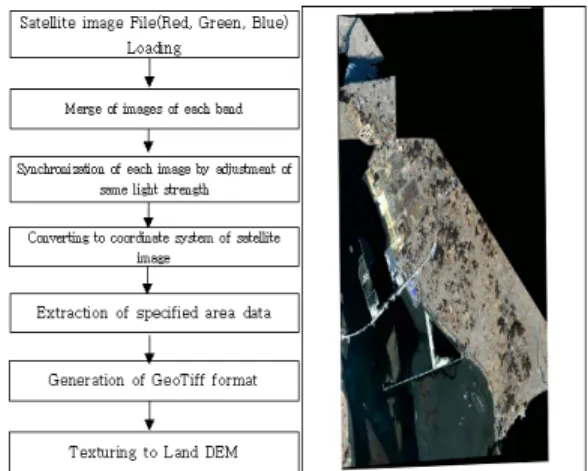
2.7 IKONOS satellite image processing
The IKONOS satellite image with 1m resolution is consists of 4 bands with red, blue, green, and NR(Near Red) by processing topographic normalization, precision geometrical correction and so on.
Three dimensional layers processing by the IKONOS satellite image with 1m resolution is useful to visualize and promote the identification power of things even specific area magnified. Thirteen images with 22.1GB were processed on the specific area then combined with Land DEM to be textured. The coordinate system of satellite image is TM central and the ellipsoid is Bessel. Each image is considered with different azimuth of the
satellite and angle of sun. Figure 8 describes the flow for processing IKONOS images.
Figure 8: Flow for processing IKONOS images
2.8 LANDSAT and IRS image processing
The 3D layer of the LANDSAT/IRS image with 5m resolution is high for visualizing and understanding of the landscape. Four images with 256Mbytes of the Port of PyeongTaek-DangJin were textured with the land DEM. It needed to be converted from the TM_ICM coordinate system to UTM. Table 4 shows LANDSAT and IRS data list of the port of PyeongTaek-Dangjin and Figure 9 depicts
Figure 9: Processing flow of the Landsat and IRS images
Flow for texturing LANDSAT and IRS with land area in W350.
Table 4: LANDSAT and IRS data list File id
Location gt-161, gt-162, gt-166, gt-167
left-upper longitude 126.372094 37.25823113
right-down longitude 127.115007 36.75817769
2.9 Generating Three-dimensional object and processing data
After generating 3D objects, 3D images and objects were merged in the Fledermaus S/W. That is useful for users to understand marine facilities around the survey area (Table 5).
- Major objects Crane
- Marine traffic object Buoys - Vessel Ships
Table 5: Marine object generation
Buoys Light buoys
Crane Container crane
Vessel Vessels
3. Results and Discussion
The integrated visualization is implemented as scene file format with layers from each sd format in the Fledermaus S/W. Table 6 shows the layers for visualizing.
Table 6: Layers for the study
Layers Remarks
Bathymetry Topography
Land DXF vector image of w350 Bathymetry Tiff raster of w350 Landsat/IRS image(5m) Solid objects of Light buoy Solid object of Crane IKONOS satellite image(1m) Name label
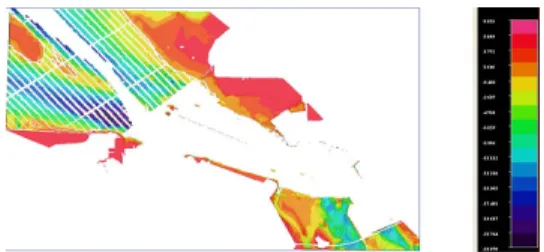
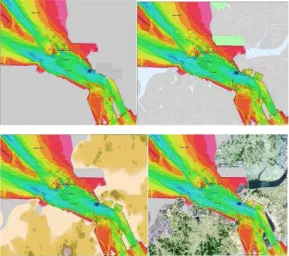
The Fledermaus S/W has the function module to extract for large volume hydrographic data into the unique file format (sd and scene). It needs to be merged with layers after compilation with harmonious colors in the color pallette. If all processes are done, the completed image is generated as a scene file in Figure 10 and Figure 11.
Figure 10: Visualization of multibeam sonar data
Figure 11: Fusion of spatial data sets
4. Conclusion
In our study, hydrographic survey using multibeam echo sounder (EM3000) was carried out around the trading port of Korea. The Visualization and fusion methods were described with various marine data sets with processing. We demonstrated that new data set in marine
GIS is useful in safe navigation and port management as an efficient decision-making tool.
References
[1] IHO Standards for Hydrographic Surveys: Special Publication no. 44, 5th Edition, International Hydrographic Bureau, Feb 2008.
[2] M. Paton, L.A. Mayer, and C. Ware,
“Interactive 3-D tools for pipeline route planning”, Proceedings of the IEEE Oceans 97, vol. 2, pp. 1216 - 1222, 1997.
[3] Martin Dean, Mark Lawrence & Chris Rowland, “Visualizing high resolution multibeam shipwreck data”, Proceedings of the Hydrographic Society of America, 2007.
[4] Thomas M. Lillesand, Ralh W. Kiefer, Jonathan W. Chiman, REMOTE SEBSUBG ABD IMAGE INTERRETATION, 2004.
Author Profile
Seong-Kyu Kong
He received his B.E. degree in the Computer Engineering from Anyang University in 1998. He received his M.E. degree in information Engineering from Inha University in 2001. Currently he is a Ph.D. candidate in Geoinformatics Engineering from Inha University and a staff of Korea Hydrographic and Oceanographic Administration.