Received:
Revised:
Accepted:
April 5, 2013 April 15, 2013 April 17, 2013
Corresponding Author: Mi-Seung Shin, Division of Cardiology, Department of Internal Medicine, Gachon University, Gil Hospital, 1198, Guwol-dong, Namdong-gu, Incheon 405-760, Korea
Tel: +82-32-460-3862, Fax: +82-32-469-1906, E-mail: [email protected], [email protected] This is an Open Access article distributed under the terms of the creative Commons Attribution Non-Commercial License (http://creativecommons.org/licenses/by-nc/3.0) which permits unrestricted non-commercial use, distribution, and reproduction in any medium, provided the original work is properly cited.
pISSN 2287-2892 • eISSN 2288-2561
JLA
Hypertension and Increased Left Ventricular End-diastolic Pressure Influence Arterial Stiffness
Yae Min Park1, Bong Roung Kim2, Wook-Jin Chung1, Kyoung Hoon Lee1, Woong Chol Kang1, Seung Hwan Han1, Tae Hoon Ahn1, In Suk Choi1, Mi-Seung Shin1
1Division of Cardiology, Department of Internal Medicine, Gachon University, Gil Hospital, Incheon, Korea,
2Department of Internal Medicine, Seoul Medical Center, Seoul, Korea
Objective: There have been few studies regarding the relationship between arterial stiffness and left ventricular end-diastolic pressure (LVEDP). In the current study, we evaluated the relationship between the LVEDP and arterial stiffness in patients with hypertension (HTN).
Methods: Group I (n=34) included patients with a normal E/E’ (≤8) without HTN, group II (n=31) included patients with an elevated E/E’ (>8) without HTN, group III (n=20) included patients with a normal E/E’ (≤8) with HTN, and group IV (n=49) included patients with an elevated E/E’ (>8) with HTN. Aortic distensibility (AD) and the right brachial-ankle pulse wave velocity (baPWV) were measured.
Results: The mean age was 46.0±11.3 years. The mean value of AD was significantly lower in the group III compared to the group I. The group IV showed significantly lower AD compared to the group II. The group III demonstrated higher baPWV compared to the group I (1422±182 cm/sec vs. 1186±178 cm/sec, p<0.01), and the group IV showed higher baPWV compared to the group II (1456±228 vs. 1259±238 cm/sec, p<0.01). However, AD and baPWV were not significantly different between the group I and II, and between the group III and IV. The E/E’ ratio showed a weak negative correlation with AD and a weak positive correlation with baPWV.
Conclusion: Patients with hypertension showed a lower AD and a higher baPWV compared to those with normal blood pressure independent of the LVEDP. But the correlation between E/E’ ratio and arterial stiffness suggests that a high LVEDP might not significantly influence arterial stiffness.
Key Words: Aortic distensibility, Pulse wave velocity, Hypertension
INTRODUCTION
Arterial stiffness increases with age1 and is enhanced in subjects with hypertension (HTN), diabetes mellitus,2 atherosclerosis,3 and end-stage renal disease.4 The conse- quences of arterial stiffening are increased pulsatile blood pressure, which is caused by a higher systolic blood
pressure (SBP) and a lower diastolic blood pressure (DBP) and leads to increased left ventricular (LV) afterload, and coronary artery disease and left ventricular hypertrophy, the most common cause of LV diastolic dysfunction.4,5 It has been reported that hypertensive patients have increased aortic stiffness,6,7 and that aortic stiffness is linked with LV structure and function and impaired
diastolic function.5,8 However, the relationship between arterial stiffness and left ventricular end-diastolic pressure (LVEDP) remains to be determined.
Arterial stiffness can be assessed non-invasively with the use of echocardiographic aortic distensibility (AD) and pulse wave velocity (PWV). The AD, which is calculated from pulsatile changes in the ascending aorta, is an elasticity index of the aorta and reflects arterial stiffness.9 The brachial-ankle PWV (baPWV) is another technique for evaluating arterial stiffness, in which the velocity of the pulse wave to travel a given distance between two sites of the arterial system is measured. The baPWV is the conventionally adopted index of arterial stiffness and vascular damage, and is a widely used method.10 Measurement of the baPWV is inexpensive, convenient, and is believed to have a good potential as a screening device for subclinical cardiovascular risk and severe atherosclerotic vascular damage.11
The purpose of the present study was to assess arterial stiffness in patients with HTN compared with normo- tensive controls according to the degree of LVEDP measured by the E/E’ ratio, and elucidate the correlation between the LVEDP and arterial stiffness as measured by the AD and baPWV.
PATIENTS AND METHODS
1. Study populationBetween January 2008 and June 2010, 234 patients without clinical signs or symptoms of atherosclerotic cardiovascular disease underwent a cardiovascular check-up in an outpatient clinic in the Department of Cardiology. We analyzed 134 patients to match age and sex with available data among 243 patients. Sixty-nine hypertensive patients and 65 normotensive controls were enrolled. Institutional Review Board approved this protocol. For the purpose of the present study, subjects with known organic heart disease (hypertrophic cardio-
myopathy, atrial fibrillation, ischemic heart disease, valvular heart disease, dilated cardiomyopathy, congestive heart failure, and coronary artery disease) were excluded.
Patients with secondary HTN on the basis of classic laboratory and radiology tests, severe HTN (stage 3), insulin-dependent diabetes, severe renal insufficiency (creatinine >300 umol/L), aortic disease (aneurysm, Marfan syndrome, coarctation, and aortic surgery), and peripheral artery occlusive disease were not included in the study. Patients with all forms of cardiovascular diseases, with the exception of HTN which can influence LVEDP, were excluded. Hypertensive patients included the patients under treatment for hypertension. Each partici- pant was reviewed in detail regarding personal medical history and tobacco use. All participants underwent a complete physical examination and routine biochemical analysis for blood and urine. Overnight fasting blood samples were collected for measuring plasma biochemical parameters including plasma triglycerides, total chole- sterol, LDL-cholesterol, HDL-cholesterol, and glucose.
The patients were divided into four groups based on the E/E’ ratio and the presence of HTN. Group I (n=34) consisted of patients with a normal E/E’ ratio (≤8) without HTN, group II (n=31) consisted of patients with an elevated E/E’ ratio (>8) without HTN, group III (n=20) consisted of patients with a normal E/E’ ratio (≤8) with HTN, and group IV (n=49) consisted of patients with an elevated E/E’ ratio (>8) with HTN.
2. Assessment of arterial stiffness
To evaluate arterial stiffness, the AD and baPWV were measured.
1) AD
Transthoracic echocardiographic evaluation was per- formed with a GE-Vingmed Vivid 7 System (GE- Vingmed Ultrasound AS, Horten, Norway) using a 2.5-3.5 MHz transducer. AD was determined non-invasively based on
the relationship between changes in aortic diameter and pressure with each cardiac pulse.
Ascending aorta diameters were measured at a level 3 cm above the aortic valve by 2-dimensional-guided M-mode echocardiography in the left parasternal long-axis view. M-mode traces were recorded at a speed of 50 mm/sec. Aortic systolic (AoS) diameter was mea- sured as the maximal anterior motion of the aorta, and the aortic diastolic (AoD) diameter at the peak of the QRS complex at the simultaneous electrocardiogram recording. After the echocardiographic examination, blood pressure was measured from the right arm with a standard sphygmomanometer. The pulse pressure (PP) was calculated as the systolic blood pressure minus the diastolic blood pressure. AD was calculated using the following formula: 2 x (pulsatile change in aortic diameter) / (diastolic aortic diameter) x (aortic pulse pressure).
2) baPWV
The right baPWV was measured using a volume- plethysmographic apparatus(VP1000, automated PWV/
ABI analyzer(PWV/ABI); Colin Co. Ltd., Komaki, Japan).
The VP1000 System is designed to determine the arterial stiffness from the pulse wave time interval and velocity measurements. Subjects were examined in the supine position after a 10-minute rest. The VP 1000 System records the PWV, blood pressure, ECG, and heart sounds simultaneously. ECG electrodes were placed on both wrists, and a heart sound microphone was placed on the left sternal border. The cuffs to measure the baPWV were wrapped around both upper arms and ankles, and connected to a plethysmographic sensor that determines the volume-pulse form. Volume waveforms were stored for a sampling time of 10 seconds with automatic gain analysis and quality adjustment. The PWV was calculated from measurements of the pulse transit time and the distance travelled by the pulse between two recording sites - the distance is measured on the surface of the
body in meters - according to the following formula: PWV (cm/s)=distance (cm) / transit time (s).
3. Echocardiographic measurements and LVEDP
Echocardiographic measurements were obtained with patients in the left lateral decubitus position. The two-dimensional and M-mode echocardiograms were obtained according to the recommendation of the American Society of Echocardiographpy.12 Three conse- cutive cycles were averaged for every parameter. The LV end-diastolic and end-systolic dimensions were measured using M-mode echocardiography recorded from the parasternal long axis view. The LV end-diastolic and end-systolic volumes were measured. The LV mass was estimated from the following formula by Devereux and Reichek:13 LV mass (g) = 1.04 x ((interventricular septal thickness + LV posterior wall thickness + LV end-diastolic dimension)3 - LV end-diastolic dimension3) - 13.6. The LV mass was divided by body surface area to derive the LV mass index.
Diastolic function was determined based on Doppler echocardiography and evaluated by the analysis of peak transmitral inflow velocities (E: early diastolic mitral flow velocity, A: late diastolic mitral flow velocity). The deceleration time of the E waves were also measured.
Using pulsed-wave tissue Doppler, peak velocities during early (E’) and late (A’) diastole obtained at the level of the septal mitral annulus were measured. Thereafter, E/A and E/E’ ratios reflecting LVEDP were calculated. At least three cardiac cycles were averaged for each parameter measurement.
4. Blood pressure
Blood pressure was measured in the morning on the right upper arm in line with the heart in a sitting position after a minimum of 5 minutes of rest by mercury column sphygmomanometry. Blood pressure was measured twice with ten minutes interval and the mean value was
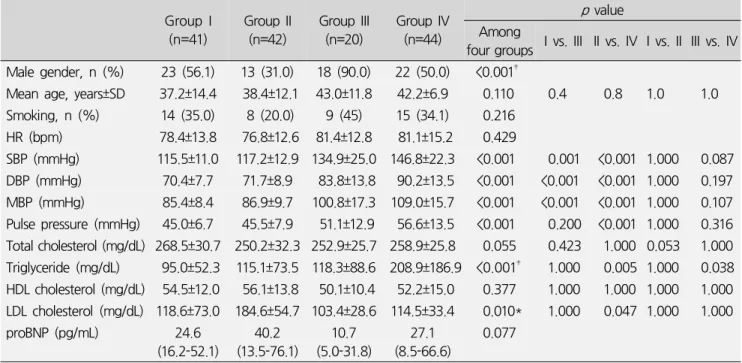
Table 1. Baseline characteristics of study population Group I
(n=41)
Group II (n=42)
Group III (n=20)
Group IV (n=44)
p value Among
four groups I vs. III II vs. IV I vs. II III vs. IV Male gender, n (%) 23 (56.1) 13 (31.0) 18 (90.0) 22 (50.0) <0.001‡
Mean age, years±SD 37.2±14.4 38.4±12.1 43.0±11.8 42.2±6.9 0.110 0.4 0.8 1.0 1.0 Smoking, n (%) 14 (35.0) 8 (20.0) 9 (45) 15 (34.1) 0.216
HR (bpm) 78.4±13.8 76.8±12.6 81.4±12.8 81.1±15.2 0.429
SBP (mmHg) 115.5±11.0 117.2±12.9 134.9±25.0 146.8±22.3 <0.001 0.001 <0.001 1.000 0.087 DBP (mmHg) 70.4±7.7 71.7±8.9 83.8±13.8 90.2±13.5 <0.001 <0.001 <0.001 1.000 0.197 MBP (mmHg) 85.4±8.4 86.9±9.7 100.8±17.3 109.0±15.7 <0.001 <0.001 <0.001 1.000 0.107 Pulse pressure (mmHg) 45.0±6.7 45.5±7.9 51.1±12.9 56.6±13.5 <0.001 0.200 <0.001 1.000 0.316 Total cholesterol (mg/dL) 268.5±30.7 250.2±32.3 252.9±25.7 258.9±25.8 0.055 0.423 1.000 0.053 1.000 Triglyceride (mg/dL) 95.0±52.3 115.1±73.5 118.3±88.6 208.9±186.9 <0.001‡ 1.000 0.005 1.000 0.038 HDL cholesterol (mg/dL) 54.5±12.0 56.1±13.8 50.1±10.4 52.2±15.0 0.377 1.000 1.000 1.000 1.000 LDL cholesterol (mg/dL) 118.6±73.0 184.6±54.7 103.4±28.6 114.5±33.4 0.010* 1.000 0.047 1.000 1.000
proBNP (pg/mL) 24.6
(16.2-52.1)
40.2 (13.5-76.1)
10.7 (5.0-31.8)
27.1 (8.5-66.6)
0.077
Group I consisted of patients with a normal E/E’ ratio (≤8) without HTN, group II consisted of patients with an elevated E/E’ ratio (>8) without HTN, group III consisted of patients with a normal E/E’ ratio (≤8) with HTN, and group IV consisted of patients with an elevated E/E’ ratio (>8) with HTN.
Values are means±SD, HR: heart rate, SBP: systolic blood pressure, DBP: diastolic blood pressure, MBP: mean blood pressure HDL: high-density lipoprotein, LDL: low-density lipoprotein, BNP: brain natriuretic peptide. *p<0.05, ‡p<0.001
calculated. HTN was defined as a systolic blood pressure
≥140 mmHg or diastolic blood pressure ≥90 mmHg measured with a minimum of 3 random measurements during the last month, or current treatment for HTN. The mean arterial pressure (MAP) was estimated from the systolic (SBP) and diastolic pressures (DBP) as follows:
MAP=DBP+1/3 (SBP-DBP).The PP was calculated as the SBP minus the DBP.
5. Data analysis
All continuous values are expressed as the mean±SD.
Differences in continuous variables between two groups were assessed using unpaired Student’s t-tests, and differences between four groups were assessed using one-way ANOVA for normally distributed variables.
Categorical variables were recorded as frequency counts and intergroup comparisons were analyzed by a chi-square test. The Pearson correlation method was used to calculate
the relationships between variables. Statistical significance was set at a p<0.05. All statistical analyses were performed using SPSS 12.0 software (SPSS Inc., Chicago, IL, USA).
RESULTS
1. Overall population
The clinical and biochemical characteristics of the patients according to each group are shown in table 1.
One hundred thirty-four patients (69 men) were enrolled and the median age was 46.0±11.3 years (range, 20-77 years). Sixty-nine patients with HTN and 65 gender- and age-matched control subjects with no previous or existing HTN or heart disease were studied. As expected, the hypertensive subjects had higher SBP, DBP, and MAP than those of normotensive subjects, and the highest SBP, DBP, and MAP were obtained in the hypertensive and high LVEDP group (group IV). The mean age did not differ
Table 2. Arterial stiffness measured by aortic distensibility and baPWV Group I Group II Group III Group IV
p value Among four
groups I vs. III II vs. IV
ASD (mm) 24.6±3.9 24.9±3.8 26.3±2.6 28.7±3.7 <0.001‡ 0.536 <0.001
ADD(mm) 27.6±3.7 27.9±3.6 29.5±2.5 31.5±3.5 <0.001‡ 0.310 <0.001
AD 5.0±2.1 5.0±2.7 4.5±1.7 3.2±1.5 <0.001‡ 1.000 0.001
AD 4.6 (3.2-6.4) 4.5 (3.0-6.5) 4.3 (3.0-5.5) 3.0 (2.0-4.4)
baPWV (cm/sec) 1177±174 1177±169 1390±189 1387±200 <0.001‡ 0.006 0.003
ASD: aortic systolic diameter, ADD: aortic diastolic diameter, AD: aortic distensibility, PWV: pulse wave velocity
*p<0.05, ‡p<0.001
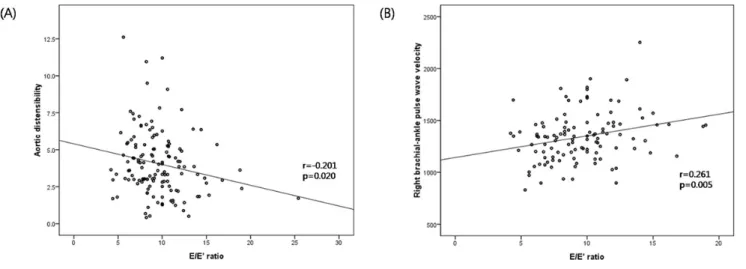
Fig. 1. Correlation of E/E’ ratio and arterial stiffness (aortic distensibility (A), brachial-ankle pulse wave velocity (B))
significantly among the study groups and the sex distribution was similar among each group. The plasma total cholesterol and LDL-cholesterol concentration were higher in group IV than group I (p=0.004 and p=0.022, respectively). There were no differences in smoking status between the study groups.
2. Arterial stiffness
Arterial stiffness differed between the groups. Table 2 shows the arterial stiffness measured through AD and baPWV. The mean values of AD were 5.0±2.5, 4.6±1.8, 3.4±1.7, and 3.3±2.0 in group I, II, III, and IV, respectively.
Group III had a lower AD compared to group I (p=0.015), and group IV had a lower AD compared to group II (p= 0.001), but group I and II were comparable (p=0.403)
and group III and IV were comparable (p=0.842). The mean baPWVs were 1186±178, 1259±238, 1422±182, and 1456±228 cm/sec in group I, II, III, and IV, respectively.
Group III had a higher baPWV compared to group I (p
<0.01), and group IV had a higher baPWV compared to group II (p<0.01), but group I and II were comparable (p=0.215) and group III and IV were comparable (p= 0.575). A Pearson correlation analysis revealed that the E/E’ ratio was negatively correlated with AD (r=-0.201, p=0.020) and positively correlated with baPWV (r=0.261, p=0.005; Fig. 1). AD had a negative correlation with the baPWV in groups with a lower E/E’ ratio (group I and III; r=-0.580, p<0.01) and with those in groups with a higher E/E’ ratio (groups II and IV; r=-0.284, p=0.020;
Fig. 2).
Fig. 2. Correlation of brachial-ankle pulse wave velocity and aortic distensibility in lower left ventricular end-diastolic pressure (LVEDP) group (group I and III) (A), and higher LVEDP group (group II and IV) (B).
Table 3. Echocardiographic findings according to groups
Group I Group II Group III Group IV
p value Among four
groups I vs. III II vs. IV
LVEDd (mm) 48.6±4.1 49.0±3.7 49.3±3.8 48.4±3.5 0.771 1.000 1.000
LVEDs (mm) 31.9±2.8 32.2±4.1 31.9±2.8 30.9±3.2 0.237 1.000 0.378
LVEDV (mm3) 91.1±28.7 88.1±19.4 91.4±22.5 91.8±21.9 0.886 1.000 1.000
LVESV (mm3) 35.8±13.1 35.0±11.4 35.2±9.3 32.6±10.1 0.581 1.000 1.000
LVEF (%) 60.8±6.5 59.9±9.3 61.2±6.1 64.4±6.3 0.030 1.000 0.030
LV mass index (g/m2)
79.8±14.5 84.9±17.9 87.4±17.7 87.2±16.8 0.175 0.592 1.000
E/E’ ratio 6.6±0.8 10.8±3.7 6.7±1.2 10.9±3.0 < 0.001‡ 1.000 1.000
E/A ratio 1.6±1.0 1.4±0.5 1.1±0.3 1.1±0.3 0.002* 0.011 0.422
DT (m/sec) 184.0±35.6 175.9±33.6 181.0±34.4 192.7±65.7 0.407 1.000 0.569
LA volume index
(ml/mm3) 19.6±5.7 25.0±7.7 23.6±5.1 25.7±8.9 0.055 1.000 1.000
LVEDd: left ventricular end-diastolic dimension, LVEDs: left ventricular end-systolic dimension, LVEF: left ventricular ejection fraction, LV: left ventricular, DT: deceleration time, LA: left atrial
Values are expressed as mean±SD
*p<0.05, ‡p<0.001
3. Echocardiographic measurements and LVEDP
Table 3 presents echocardiographic and tissue Doppler image-derived parameters of the study groups. The LV end-diastolic volume, LV end-systolic volume, and LV ejection fraction were not significantly different among the 4 groups (p=0.783, p=0.413, and p=0.541 by ANOVA). Group I had a significantly higher E/A ratio
compared to group III (1.4±0.5 vs. 1.1±0.3, p=0.017) and group II had a significantly higher E/A ratio compared to group IV (1.2±1.0 vs. 1.0±0.3, p=0.002).
DISCUSSION
To date, no reports have described the relationship between arterial stiffness and in non-invasively estimated
r=-0.580 p<0.01
r=-0.284 p=0.020
LVEDP. The principal finding of the present study was that patients with HTN had a lower AD and higher baPWV compared to normotensive subjects, independent of the LVEDP. This result demonstrates that HTN itself influences arterial stiffness independently. A weak correlation between the E/E’ ratio and AD and the baPWV suggest that LVEDP may also influence arterial stiffness.
Increased aortic stiffness and LV diastolic dysfunction have frequently been shown to occur together in the latest clinical investigations, although a causal relation is not certain.9,14-16 Recent study showed that there was a relationship between LV diastolic function and arterial stiffness in patients with diabetes, HTN, or both.9 In subjects with essential HTN, however, there is a report that arterial stiffness is increased regardless of LV diastolic dysfunction.1 The findings of the current study are consistent with these reports and further demonstrated the relationship between arterial stiffness and LVEDP. The present study is the first study to show results that arterial stiffness of hypertensive patients is increased regardless of the LVEDP. But weak correlation between LVEDP and AD suggests that diastolic function may affect arterial stiffness insignificantly.
It is well-known that impaired arterial stiffness is associated with older age, HTN, diabetes mellitus, and African-American ethnicity.9,17 Additionally, there is a report that decreased AD exists in current smokers and in subjects with lower HDL-cholesterol levels.17 The current study showed that there were no significant differences in the proportion of smokers and mean values of HDL-cholesterol in the four groups.
Although the mechanism by which HTN leads to an increase in arterial stiffness and the relationship between arterial stiffness and diastolic function is unclear, the followings are possible explanations. First, parallel changes may occur in the cardiac and arterial walls due to HTN or diabetes. Thus, LV diastolic dysfunction and arterial stiffness may be an epiphenomenon of myocardial and
arterial injuries, which are well-characterized in patients with diabetes and HTN. The second possible explanation is that increased arterial stiffness may also increase afterload, inducing myocardial structural changes of the LV, and in turn LV diastolic dysfunction.9 Decreased AD and loss of elastic homogeneity of the aorta result in an increased PWV.18
In prior studies it was shown that pulsatile changes in the ascending aortic diameter can be measured during routine transthoracic echocardiography and non-invasive measurements of AD by echocardiography, based on aortic dimensions and blood pressure data, are as accurate as invasive methods.19 The PWV can be easily and auto- matically determined directly related to arterial wall stiffness and to wall thickness.1 Measurement of the PWV is accurate and highly reproducible. The PWV is not only a non-invasive method used to assess arterial stiffness, but also a useful, simple method to estimate the severity of HTN, end-stage renal disease, and atherosclerosis. A prior study described that PWV was inversely related to ascending and abdominal AD (r=-0.56 and r=-0.50, respectively).18 The baPWV, but not the carotid-femoral, heart-carotid, heart-femoral, or femoral-ankle PWV, is the combined measure of both central and peripheral arterial stiffness, and significantly correlated with LV diastolic function in hypertensive subjects, indicating that baPWV involving both central and peripheral components of arterial stiffness may be an early indicator of LV dysfunction.20 Moreover, the variation of repeated baPWV measurements is small.21 The current study also showed a correlation between AD and baPWV regardless of the degree of LVEDP. These finding suggests that these reliable methods can be used in place of the invasive method commonly in clinical use.
Our study had some limitations. First, we used non- invasive estimation of LVEDP without more accurate invasive measurement of LVEDP such as cardiac cathe- terization. However, many investigators have showed that
E/E’ ratio is correlated with LVEDP.22-26 Second, the current study is a retrospective study in a single center. Third, the study had a cross-sectional design, which precluded study of the causal relationship between HTN and arterial stiffness. Fourth, this study results may be influenced by several classes of antihypertensive medications shown to influence measurements of arterial stiffness. However, study population took optimal treatment and this study reflects real practice. The number of study population was too small to analyze the effect of antihypertensive medication. Fifth, the study subjects were a relatively small cohort of patients during a limited time frame. Further study evaluating more detailed diastolic function in a large number of subjects is necessary.
In conclusion, arterial stiffness is impaired in hyper- tensive patients compared to normotensive subjects, and this finding is independent of the LVEDP. The LVEDP may influence arterial stiffness insignificantly in all subjects, but further studies are needed to confirm a causal relation- ship. Echocardiographic AD and baPWV are highly corre- lated and accurate non-invasive methods for the measurement of arterial stiffness.
REFERENCES
1. Avolio AP, Chen SG, Wang RP, Zhang CL, Li MF, O'Rourke MF. Effects of aging on changing arterial compliance and left ventricular load in a northern Chinese urban community. Circulation 1983;68:50-58.
2. Lehmann ED, Gosling RG, Sönksen PH. Arterial wall compliance in diabetes. Diabet Med 1992;9:114-119.
3. Wada T, Kodaira K, Fujishiro K, Maie K, Tsukiyama E, Fukumoto T, Uchida T, Yamazaki S. Correlation of ultrasound-measured common carotid artery stiffness with pathological findings. Arterioscler Thromb 1994;
14:479-482.
4. London GM, Marchais SJ, Safar ME, Genest AF, Guerin AP, Metivier F, Chedid K, London AM. Aortic and large artery compliance in end-stage renal failure. Kidney Int 1990;37:137-142.
5. Wang CP, Hung WC, Yu TH, Hsu HL, Chen YH, Chiu CA, Lu LF, Chung FM, Cheng YA, Lee YJ. Brachial-ankle pulse wave velocity as an early indicator of left ventricular diastolic function among hypertensive subjects. Clin Exp Hypertens 2009;31:31-43.
6. Devereux RB, Savage DD, Sachs I, Laragh JH. Relation of hemodynamic load to left ventricular hypertrophy and performance in hypertension. Am J Cardiol 1983;51:
171-176.
7. Bouthier JD, De Luca N, Safar ME, Simon AC. Cardiac hypertrophy and arterial distensibility in essential hypertension. Am Heart J 1985;109:1345-1352.
8. Lartaud-Idjouadiene I, Lompré AM, Kieffer P, Colas T, Atkinson J. Cardiac consequences of prolonged exposure to an isolated increase in aortic stiffness. Hypertension 1999;34:63-69.
9. Eren M, Gorgulu S, Uslu N, Celik S, Dagdeviren B, Tezel T. Relation between aortic stiffness and left ventricular diastolic function in patients with hypertension, diabetes, or both. Heart 2004;90:37-43.
10. Blacher J, Asmar R, Djane S, London GM, Safar ME.
Aortic pulse wave velocity as a marker of cardiovascular risk in hypertensive patients. Hypertension 1999;33:
1111-1117.
11. Yamashina A, Tomiyama H, Arai T, Hirose K, Koji Y, Hirayama Y, Yamamoto Y, Hori S. Brachial-ankle pulse wave velocity as a marker of atherosclerotic vascular damage and cardiovascular risk. Hypertens Res 2003;
26:615-622.
12. Sahn DJ, DeMaria A, Kisslo J, Weyman A. Recom- mendations regarding quantitation in M-mode echo- cardiography: results of a survey of echocardiographic measurements. Circulation 1978;58:1072-1083.
13. Devereux RB, Reichek N. Echocardiographic determi- nation of left ventricular mass in man. Anatomic validation of the method. Circulation 1977;55:613-618.
14. Karamitsos TD, Karvounis HI, Didangelos TP, Papado- poulos CE, Kachrimanidou MK, Selvanayagam JB, Parharidis GE. Aortic elastic properties are related to left ventricular diastolic function in patients with type 1 diabetes mellitus. Cardiology 2008;109:99-104.
15. Tsioufis C, Chatzis D, Dimitriadis K, Stougianos P, Kakavas A, Vlasseros I, Tousoulis D, Stefanadis C, Kallikazaros I. Left ventricular diastolic dysfunction is
accompanied by increased aortic stiffness in the early stages of essential hypertension: a TDI approach. J Hypertens 2005;23:1745-1750.
16. Abhayaratna WP, Srikusalanukul W, Budge MM. Aortic stiffness for the detection of preclinical left ventricular diastolic dysfunction: pulse wave velocity versus pulse pressure. J Hypertens 2008;26:758-764.
17. Malayeri AA, Natori S, Bahrami H, Bertoni AG, Kronmal R, Lima JA, Bluemke DA. Relation of aortic wall thickness and distensibility to cardiovascular risk factors (from the Multi-Ethnic Study of Atherosclerosis [MESA]). Am J Cardiol 2008;102:491-496.
18. Triposkiadis F, Kallikazaros I, Trikas A, Stefanadis C, Stratos C, Tsekoura D, Toutouzas P. A comparative study of the effect of coronary artery disease on ascending and abdominal aorta distensibility and pulse wave velocity.
Acta Cardiol 1993;48:221-233.
19. Stefanadis C, Stratos C, Boudoulas H, Kourouklis C, Toutouzas P. Distensibility of the ascending aorta:
comparison of invasive and non-invasive techniques in healthy men and in men with coronary artery disease.
Eur Heart J 1990;11:990-996.
20. Montalcini T, Gorgone G, Pujia A. Association between pulse pressure and subclinical carotid atherosclerosis in normotensive and hypertensive post-menopausal women.
Clin Exp Hypertens 2009;31:64-70.
21. Koji Y, Tomiyama H, Ichihashi H, Nagae T, Tanaka N, Takazawa K, Ishimaru S, Yamashina A. Comparison of ankle-brachial pressure index and pulse wave velocity as
markers of the presence of coronary artery disease in subjects with a high risk of atherosclerotic cardiovascular disease. Am J Cardiol 2004;94:868-872.
22. Nagueh SF, Middleton KJ, Kopelen HA, Zoghbi WA, Quiñones MA. Doppler tissue imaging: a noninvasive technique for evaluation of left ventricular relaxation and estimation of filling pressures. J Am Coll Cardiol 1997;
30:1527-1533.
23. Nagueh SF, Mikati I, Kopelen HA, Middleton KJ, Quiñones MA, Zoghbi WA. Doppler estimation of left ventricular filling pressure in sinus tachycardia. A new application of tissue doppler imaging. Circulation 1998;
98:1644-1650.
24. Firstenberg MS, Levine BD, Garcia MJ, Greenberg NL, Cardon L, Morehead AJ, Zuckerman J, Thomas JD.
Relationship of echocardiographic indices to pulmonary capillary wedge pressures in healthy volunteers. J Am Coll Cardiol 2000;36:1664-1669.
25. On YK, Kim MK, Jeung HS, Hyun MS, Kim SK, Kwon YJ. Echocardiographic indices associated with left ventri- cular end-diastolic pressure. Korean Circ J 2002;32:
872-877.
26. Liang HY, Cauduro SA, Pellikka PA, Bailey KR, Grossardt BR, Yang EH, Rihal C, Seward JB, Miller FA, Abraham TP. Comparison of usefulness of echocardiographic Doppler variables to left ventricular end-diastolic pressure in predicting future heart failure events. Am J Cardiol 2006;97:866-871.