INTRODUCTION
Attention-deficit hyperactivity disorder (ADHD) is one of the most common neurodevelopmental disorders, and affects 5-8% of children worldwide.1) ADHD is associated with academic under-achievement and dysfunctional rela- tionships with family members and peers.2) It is a heteroge- neous and complex disorder, and its pathophysiology remains largely unknown.
Previous twin and adoption studies have suggested a strong genetic contribution to ADHD, and a meta-analysis of twin
studies has reported an average heritability of 76%.3) Several candidate gene association studies have investigated ADHD risk genes, including dopamine-related genes (DRD4, DRD5, and SLC6AC), serotonin-related genes (HTR1B and SLC6A4), and synaptic vesicle fusion-related gene SNAP-25.4) Howev- er, efforts to replicate these results have been inconsistent.5) Furthermore, many common gene variants with small effects are considered to contribute to ADHD.3)
Genome-wide association studies (GWAS) are powerful tools for detecting, at several hundred thousand positions in the genome, common genetic polymorphisms that influence disease susceptibility and quantitative traits. Numerous GWAS have been conducted to identify ADHD risk loci using either case-control or family-based designs,4) and a recent meta-
This is an Open Access article distributed under the terms of the Creative Commons Attribution Non-Commercial License (http://creativecommons.org/licenses/by-nc/4.0) which permits unrestricted non-commercial use, distribution, and reproduction in any medium, provided the original work is properly cited.
Genome-Wide Analysis Reveals Four Novel Loci for Attention-Deficit Hyperactivity Disorder
in Korean Youths
Kukju Kweon1, Eun-Soon Shin2, Kee Jeong Park3, Jong-Keuk Lee4, Yeonho Joo3, and Hyo-Won Kim3
1Department of Psychiatry, University of Ulsan College of Medicine, Ulsan University Hospital, Ulsan, Korea
2DNA Link, Inc. Bioinformatics, Seoul, Korea
3Department of Psychiatry, University of Ulsan College of Medicine, Asan Medical Center, Seoul, Korea
4Asan Institute for Life Sciences, University of Ulsan College of Medicine, Seoul, Korea
Objectives: The molecular mechanisms underlying attention-deficit hyperactivity disorder (ADHD) remain unclear. Therefore, this study aimed to identify the genetic susceptibility loci for ADHD in Korean children with ADHD. We performed a case-control and a family-based genome-wide association study (GWAS), as well as genome-wide quantitative trait locus (QTL) analyses, for two symp- tom traits.
Methods: A total of 135 subjects (71 cases and 64 controls), for the case-control analysis, and 54 subjects (27 probands and 27 unaf- fected siblings), for the family-based analysis, were included.
Results: The genome-wide QTL analysis identified four single nucleotide polymorphisms (SNPs) (rs7684645 near APELA, rs12538843 near YAE1D1 and POU6F2, rs11074258 near MCTP2, and rs34396552 near CIDEA) that were significantly associated with the num- ber of inattention symptoms in ADHD. These SNPs showed possible association with ADHD in the family-based GWAS, and with hyperactivity-impulsivity in genome-wide QTL analyses. Moreover, association signals in the family-based QTL analysis for the num- ber of inattention symptoms were clustered near genes IL10, IL19, SCL5A9, and SKINTL.
Conclusion: We have identified four QTLs with genome-wide significance and several promising candidates that could potentially be associated with ADHD (CXCR4, UPF1, SETD5, NALCN-AS1, ERC1, SOX2-OT, FGFR2, ANO4, and TBL1XR1). Further replication studies with larger sample sizes are needed.
Key Words: Attention-deficit hyperactivity disorder; Genome-wide association study; Asian population; Case-control study;
Family-based study.
Received: November 6, 2017 / Revision: December 28, 2017 / Accepted: January 10, 2018
Address for correspondence: Hyo-Won Kim, Department of Psychiatry, University of Ulsan College of Medicine, Asan Medical Center, 88 Olympic-ro 43- gil, Songpa-gu, Seoul 05505, Korea
Tel: +82-2-3010-3414, Fax: +82-2-485-8381, E-mail: [email protected] J Korean Acad Child Adolesc Psychiatry 2018;29(2):62-72 https://doi.org/10.5765/jkacap.2018.29.2.62
analysis of GWAS has revealed 12 genome-wide significant loci for ADHD.6) Moreover, a family-based quantitative trait loci (QTL) analysis has previously identified significant as- sociations with cell-cell adhesion gene CDH13.7) The single nucleotide polymorphisms (SNPs) implicated in previous GWAS of ADHD are located at the sodium/proton exchang- er SLC9A9,8) glutamate receptor GRM5,9) and cholinergic re- ceptor CHRNA7.10) However, these results have not been suf- ficiently replicated, and the effect of these genes on ADHD pathogenesis has been subject to considerable controversy. In addition, most GWAS for ADHD have been performed in European and American populations and, to our knowledge, few studies have been performed in Asian cohorts.11) To ex- plore the risk variants related to ADHD predisposition in a Korean population, we assessed the genetic susceptibility loci for ADHD by conducting a case-control and a family-based GWAS in Korean children with ADHD.
METHODS
Participants
Subjects with ADHD and their unaffected siblings were re- cruited from November 2012 to April 2015 at the children’s outpatient psychiatric clinic of Asan Medical Center, Seoul, Korea. Typically developing children were recruited as con- trols through the Internet bulletin board of Asan Medical Center. All participants were 6-12 years old and were of Ko- rean ancestry. All subjects were genetically unrelated. Sub- jects were excluded from this study if they satisfied one or more of the following criteria: 1) suspected mental retarda- tion or an IQ score of less than 80; 2) history of ADHD med- ication (stimulants or atomoxetine) in the past three months;
3) history of low birth weight of less than 2.5 kg; 4) presence of congenital genetic disorders, acquired brain injury (e.g., cerebral palsy), seizure, or other neurological disorders; and 5) past and/or current history of bipolar disorder, schizophre- nia, other childhood psychotic disorders, organic mental dis- order, or pervasive developmental disorder. Cases with co- morbid disorders, such as tic or anxiety disorders, that did not require pharmacological treatment were included.
This study was approved by the Institutional Review Board at Asan Medical Center (2012-0767). Written informed con- sent was obtained from the parents and written assent was obtained from the subjects.
Measures
All subjects and their parents underwent clinical evalua- tion by child psychiatrists. A diagnosis of ADHD and comor- bid psychiatric disorders was confirmed according to the di- agnostic criteria in Diagnostic and Statistical Manual of
Mental Disorders-IV-Text Revision (DSM-IV-TR)12) and Kid- die-Schedule for Affective Disorders and Schizophrenia-Pres- ent and Lifetime version (K-SADS-PL).13) All subjects also completed the Korean Wechsler Intelligence Scale for Chil- dren-Fourth Edition (K-WISC-IV).14) Two quantitative traits for QTL analysis were derived from the K-SADS-PL ADHD sections: the total number of 1) inattention and 2) hyperac- tivity-impulsivity symptoms as per the DSM-IV-TR criteria.
Genotyping and quality control
Genomic DNA was extracted from whole blood. The sam- ples were genotyped using an Affymetrix AxiomTM KORV1.0- 96 Array (Affymetrix, Santa Clara, CA, USA). Genotyping was performed according to the standard Affymetrix proto- col at DNA Link (Seoul, Korea). The detailed protocol is de- scribed in Supplementary Material (in the online-only Data Supplement). SNPs that did not pass the Hardy-Weinberg equilibrium test (p<1.00E-07), those with low minor allele frequency (case ≤0.01 and control ≤0.01), and those with low marker call rate (case ≤0.95 or control ≤0.95) were exclud- ed. Markers with p<0.001 were inspected using cluster plots.
Owing to the small sample size, only autosomal SNPs were included in the family-based analysis.
Statistical analyses
Statistical procedures were performed using PLINK (http://
zzz.bwh.harvard.edu/plink/)15) and SAS version 9.1.3 (SAS In- stitute Inc., Cary, NC, USA). First, the case-control and the family-based GWAS were performed. For the case-control analysis, parametric tests were performed, including chi- square test for dominant and recessive alleles and Cochran- Armitage trend test for co-dominant alleles. We also con- ducted a non-parametric test, Jonckheere-Terpstra test, for dominant, recessive, and co-dominant alleles. For the fami- ly-based analysis, we conducted a sibling-transmission dis- equilibrium test.16) Second, genome-wide QTL analyses, with either a case-control or a family-based design, were conduct- ed to test the association with the two quantitative traits of ADHD. For QTL analyses, regression analyses with an addi- tive model were performed using PLINK. To control for mul- tiple comparisons, we considered p-values lower than 5.0E-08 to be statistically significant genome-wide.17)
RESULTS
After quality control procedures were completed, 135 indi- viduals (71 cases and 64 controls) and 525356 SNPs (63.1%), for the case-control analysis, and 27 sibling pairs (27 pro- bands and 27 unaffected siblings) and 432921 SNPs (52.4%), for the family-based analysis, were included. Table 1 presents
the demographic and clinical characteristics of the study sub- jects. Between subjects with ADHD and typically develop- ing children in the case-control analysis, a significant differ- ence was found in age (p=0.002), gender (p=0.030), IQ (p=
0.002), and comorbid diagnosis of oppositional defiant and conduct disorder (p=0.014). When ADHD subjects were com- pared with their unaffected siblings, a significant difference in gender was found (p=0.021).
In the case-control and the family-based GWAS, none of the variants reached genome-wide significance (p<5.00E-08).
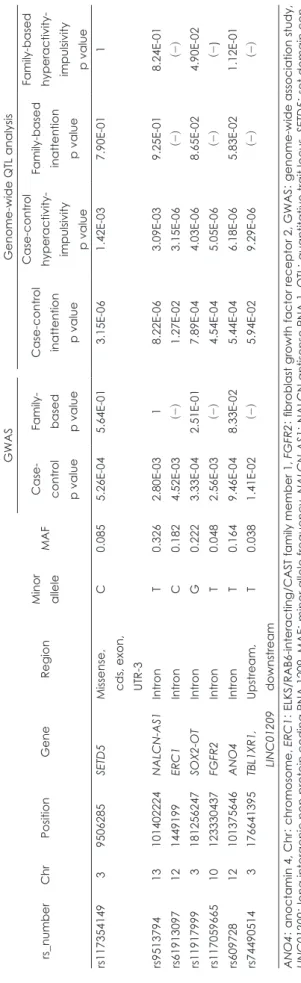
Table 2 lists the top SNPs (p<1.00E-05) of the case-control GWAS, which include rs34442475, adjacent to CXCR4, and rs2238652, adjacent to UPF1. These SNPs also showed pos- sible association with the number of inattention symptoms
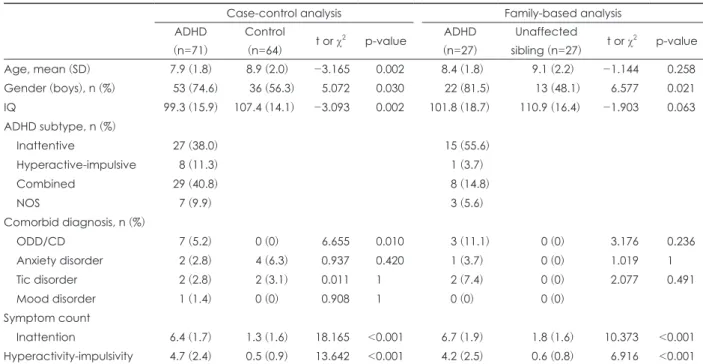
(p=2.74E-02 and 1.59E-03) and hyperactivity-impulsivity symptoms (p=1.70E-04 and 1.80E-04) in the case-control QTL analysis. In the family-based GWAS, none of the SNPs had a p-value lower than 1.00E-05. Supplementary Fig. 1 (in the online-only Data Supplement) and Fig. 1 show the Manhat- tan plots and quantile-quantile (Q-Q) plots of the case-con- trol and family-based GWAS, respectively.
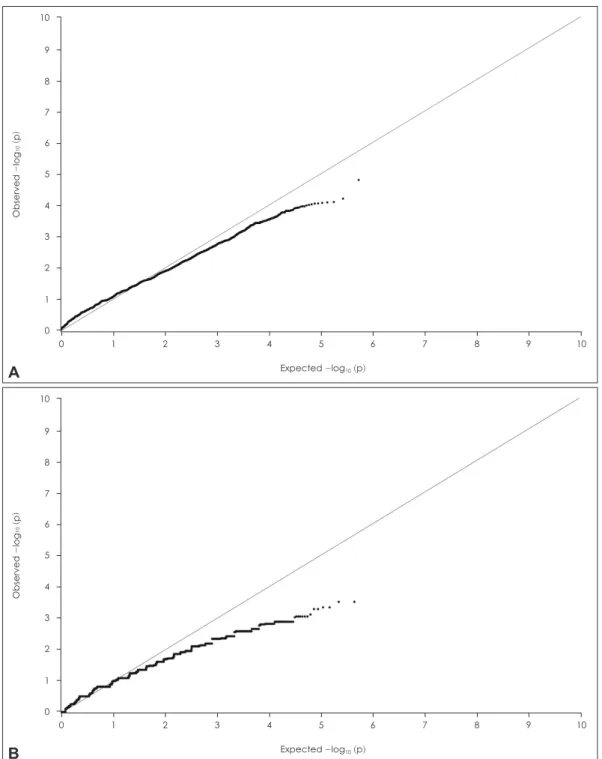
Table 3 presents the list of SNPs with p-values lower than 1.00E-05 in the case-control QTL analysis. Two SNPs showed possible association with the number of inattention symp- toms and five SNPs exhibited a possible association with the number of hyperactivity-impulsivity symptoms. These sev- en SNPs showed a trend towards association with ADHD in the case-control GWAS (p<0.05).
Table 1. Demographic and clinical characteristics of the study subjects
Case-control analysis Family-based analysis
ADHD (n=71)
Control
(n=64) t or χ2 p-value ADHD (n=27)
Unaffected
sibling (n=27) t or χ2 p-value
Age, mean (SD) 7.9 (1.8) 8.9 (2.0) -3.165 0.002 8.4 (1.8) 9.1 (2.2) -1.144 0.258
Gender (boys), n (%) 53 (74.6) 36 (56.3) 5.072 0.030 22 (81.5) 13 (48.1) 6.577 0.021
IQ 99.3 (15.9) 107.4 (14.1) -3.093 0.002 101.8 (18.7) 110.9 (16.4) -1.903 0.063
ADHD subtype, n (%)
Inattentive 27 (38.0) 15 (55.6)
Hyperactive-impulsive 8 (11.3) 1 (3.7)
Combined 29 (40.8) 8 (14.8)
NOS 7 (9.9) 3 (5.6)
Comorbid diagnosis, n (%)
ODD/CD 7 (5.2) 0 (0) 6.655 0.010 3 (11.1) 0 (0) 3.176 0.236
Anxiety disorder 2 (2.8) 4 (6.3) 0.937 0.420 1 (3.7) 0 (0) 1.019 1
Tic disorder 2 (2.8) 2 (3.1) 0.011 1 2 (7.4) 0 (0) 2.077 0.491
Mood disorder 1 (1.4) 0 (0) 0.908 1 0 (0) 0 (0)
Symptom count
Inattention 6.4 (1.7) 1.3 (1.6) 18.165 <0.001 6.7 (1.9) 1.8 (1.6) 10.373 <0.001
Hyperactivity-impulsivity 4.7 (2.4) 0.5 (0.9) 13.642 <0.001 4.2 (2.5) 0.6 (0.8) 6.916 <0.001 ADHD: attention-deficit hyperactivity disorder, CD: conduct disorder, NOS: attention-deficit hyperactivity disorder not otherwise specified, ODD: oppositional defiant disorder, SD: standard deviation
Table 2. List of SNPs with p values<1.00E-05 in the case-control GWAS
rs number Chr Position Minor allele
Closest
gene MAF OR 95%
CI
GWAS Genome-wide QTL analysis
Case- control p value
Family- based p value
Case- control inattention
p value
Case- control hyperactivity-
impulsivity p value
Family- based inattention
p value
Family- based hyperactivity-
impulsivity p value rs34442475 2 137064385 C CXCR4 0.412 2.30 1.41-
3.78
1.60E-06 5.64E-01 2.74E-02 1.70E-04 3.24E-01 3.13E-01
rs2238652 19 18942559 T UPF1 0.289 4.79 2.28- 10.0
3.12E-06 3.17E-01 1.59E-03 1.80E-04 4.89E-01 4.14E-01 Chr: chromosome, CI: confidential interval, CXCR4: chemokine (C-X-C motif) receptor 4, GWAS: genome-wide association study, MAF: minor allele frequency, OR: odds ratio, QTL: quantitative trait locus, SNP: single nucleotide polymorphism, UPF1: up- frameshift suppressor 1
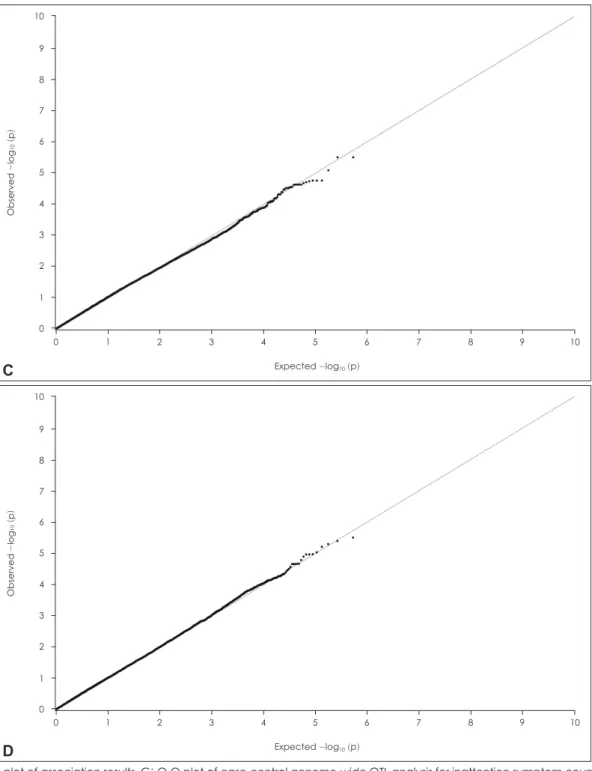
In the family-based genome-wide QTL analysis, four SNPs, including rs7684645 adjacent to apelin receptor early en- dogenous ligand (APELA), rs12538843 adjacent to Yae1 do- main containing 1 (YAE1D1) and POU class 6 homeobox 2 (POU6F2), rs11074258 adjacent to multiple C2 domains, transmembrane 2 (MCTP2), and rs34396552 adjacent to cell death-inducing DFFA-like effector A (CIDEA), showed a genome-wide significant association with the number of in-
attention symptoms. Table 4 describes the SNPs with p-val- ues lower than 1.00E-06. Most of these SNPs also showed possible association with ADHD in the family-based GWAS, and/or with the number of hyperactivity-impulsivi- ty symptoms in the family-based genome-wide QTL analy- sis (p<0.05). In fact, in the family-based QTL analysis, 153 SNPs and 18 SNPs had p-values lower than 1.00E-05 for the number of inattention symptoms and for the number of hy-
Fig. 1. Q-Q plot of association results. A: Q-Q plot of case-control GWAS, B: Q-Q plot of family-based GWAS, GWAS: genome-wide association study, Q-Q: quantile-quantile.
10 9 8 7 6 5 4 3 2 1
0
1 2 3 4 5 6 7 8 9
0 10
Expected -log10 (p) Observed -log10 (p)
A
10 9 8 7 6 5 4 3 2 1
0
1 2 3 4 5 6 7 8 9
0 10
Expected -log10 (p) Observed -log10 (p)
B
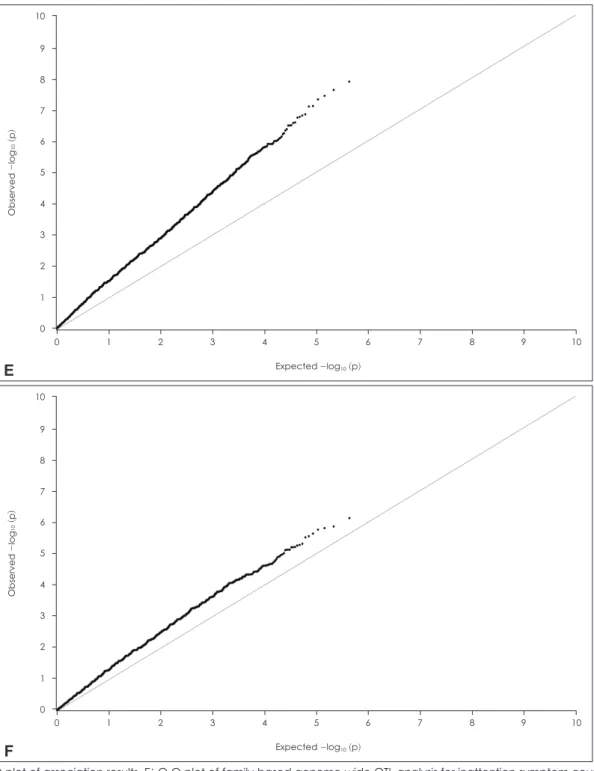
peractivity-impulsivity symptoms, respectively. The region- al association plots (Fig. 2), established using genotype data from the family-based QTL analysis for the number of inat- tention symptoms, indicated that moderately associated SNPs (p<1.00E-04) were tightly linked to rs11119570, located near IL10 and IL19; and rs214220, located near SLC5A9 and SKINTL. Supplementary Fig. 1 (in the online-only Data Supplement) and Fig. 1 describe the Manhattan-plots and
Q-Q plots, respectively, of the genome-wide QTL analyses.
DISCUSSION
In this study, we conducted GWAS of ADHD and genome- wide QTL analyses of ADHD symptoms in Korean children with ADHD. In the case-controlled and the family-based GWAS, we did not identify any significant genome-wide SNPs.
Fig. 1. Q-Q plot of association results. C: Q-Q plot of case-control genome-wide QTL analysis for inattention symptom count, D: Q-Q plot of case-control genome-wide QTL analysis for hyperactivity-impulsivity symptom count. Q-Q: quantile-quantile, QTL: quantita- tive trait locus.
10 9 8 7 6 5 4 3 2 1
0
1 2 3 4 5 6 7 8 9
0 10
Expected -log10 (p) Observed -log10 (p)
C
10 9 8 7 6 5 4 3 2 1
0
1 2 3 4 5 6 7 8 9
0 10
Expected -log10 (p) Observed -log10 (p)
D
However, in the genome-wide QTL analysis, we identified four SNPs (rs7684645 near APELA, rs12538843 near YAE1D1 and POU6F2, rs11074258 near MCTP2, and rs34396552 near CI- DEA) that were significantly associated with the number of inattention symptoms of ADHD. These SNPs showed possi- ble association with ADHD in the family-based GWAS, and with hyperactivity-impulsivity in the genome-wide QTL analysis.
Among genes adjacent to the four aforementioned SNPs, rs7684645 is located in the intergenic region adjacent to the APELA gene, located at 4q32.3. APELA plays a key role in cardiac development as a motogen, by promoting endoderm and mesendoderm cell migration during gastrulation.18) Boso et al.19) reported that the plasma level of apelin is reduced in patients with autism spectrum disorder, thus suggesting a possible association with neurodevelopmental disorders.
Fig. 1. Q-Q plot of association results. E: Q-Q plot of family-based genome-wide QTL analysis for inattention symptom count, F: Q-Q plot of family-based genome-wide QTL analysis for hyperactivity-impulsivity symptom count. Q-Q: quantile-quantile, QTL: quantita- tive trait locus.
10 9 8 7 6 5 4 3 2 1
0
1 2 3 4 5 6 7 8 9
0 10
Expected -log10 (p) Observed -log10 (p)
E
10 9 8 7 6 5 4 3 2 1
0
1 2 3 4 5 6 7 8 9
0 10
Expected -log10 (p) Observed -log10 (p)
F
Moreover, rs12538843 was located between genes POU6F2 and YAE1D1. The POU6F2 gene is expressed within the cen- tral nervous system, kidney, adrenal gland, heart, stomach, muscle, and eye.20) It might be involved in the early steps of differentiation of amacrine and ganglion cells. Anney et al.21) reported a possible association between POU6F2 and autism spectrum disorder, and suggested that POU6F2 may be associated with neurodevelopmental disorders. The function of YAE1D1, on the other hand, remains unknown.
Further assessments of the function of POU6F2 and YAE1D1, and of the role of rs12538843 in the pathogenesis of ADHD are needed.
Rs11074258 is located upstream of the MCTP2 gene. This gene is involved in intercellular signal transduction and syn- apse function via its calcium-ion binding activity. Previous studies have supported the association between MCTP2 and ADHD. Mick et al.8) suggested a possible association between gene MCTP1, a paralog of MCTP2, and ADHD in a family- based GWAS (p=1.59E-05). Furthermore, using the Biologi- cal Network Gene Ontology tool, Poelmans et al.22) found that the gene ontology process “calcium ion binding,” which plays an important role in neurite migration, was significant- ly enriched in the 14 ADHD-associated genes.
Rs34396552 is located in the intergenic region, near the CIDEA gene. CIDEA is homologous to a murine protein known to activate apoptosis in mice. Its human homolog is known to regulate lipolysis in human adipocytes, and is also related to obesity.23) Several studies have reported an associa- tion between ADHD and obesity, and have suggested that this comorbidity may be due to a shared genetic component.24)
Besides the four SNPs with genome-wide significance, as- sociation signals of the family-based QTL analysis for the number of inattention symptoms were also clustered near the IL10, IL19, SCL5A9, and SKINTL genes. IL19 and IL10 encode cytokines that belong to the IL10 cytokine subfamily, and play a key role in immune regulation and inflammation; fur- thermore, SKINTL is a newly identified immunoglobulin su- perfamily gene.25) In addition, the immune and inflammatory system has been implicated in the pathogenesis of ADHD26) and other psychiatric disorders such as autism.27) Polymor- phisms in IL10 may be involved in increased risk for major depressive disorder.28) On the other hand, SLC5A9 is a sodi- um-dependent transport channel of D-mannose, D-glucose, and D-fructose; its role in the pathogenesis of ADHD re- mains unclear.
In this study, only the family-based QTL analysis identified genome-wide significant associations. Previous reports have suggested that case-control studies may be more powerful than family-based studies when investigating complex hu- man traits, including qualitative and quantitative traits.29)
Table 3. List of SNPs with p values<1.00E-05 in the genome-wide QTL analysis (case-control analysis
) rs_numberChrPositionGeneRegionMinor alleleMAF
GWASGenome-wide QTL analysis Case- control p value
Family- based p value
Case-control inattention p value
Case-control hyperactivity- impulsivity p value
Family-based inattention p value
Family-based hyperactivity- impulsivity p value rs11735414939506285SETD5Missense, cds, exon, UTR-3
C0.0855.26E-045.64E-013.15E-061.42E-037.90E-011 rs951379413101402224NALCN-AS1IntronT0.3262.80E-0318.22E-063.09E-039.25E-018.24E-01 rs61913097121449199ERC1IntronC0.1824.52E-03(-)1.27E-023.15E-06(-)(-) rs119179993181256247SOX2-OTIntronG0.2223.33E-042.51E-017.89E-044.03E-068.65E-024.90E-02 rs11705966510123330437FGFR2IntronT0.0482.56E-03(-)4.54E-045.05E-06(-)(-) rs60972812101375646ANO4IntronT0.1649.46E-048.33E-025.44E-046.18E-065.83E-021.12E-01 rs744905143176641395TBL1XR1, LINC01209Upstream, downstreamT0.0381.41E-02(-)5.94E-029.29E-06(-)(-) ANO4
: anoctamin 4, Chr : chromosome,
ERC1
: ELKS/RAB6-interacting/CAST family member 1, FGFR2 : fibroblast growth factor receptor 2, GWAS
: genome-wide association study, LINC01209
: long intergenic
non-protein coding RNA 1209, MAF
: minor
allele frequency, NALCN-AS1
: NALCN
antisense RNA 1, QTL
: quantitative trait locus,
SETD5
: set domain con
- taining 5, SNP
: single nucleotide polymorphism,
SOX2-OT
: SOX2 overlapping transcript,
TBL1XR1
: transducin (beta )-like 1 X-linked receptor 1
Table 4. List of SNPs with p values<1.00E-06 in the family-based genome-wide QTL analysis rs_numberChrPositionGeneRegion Minor allele
MAF
GWASGenome-wide QTL analysis
Case- control p value Family- based p value Case- control
inattention p value
Case-control hyperactivity- impulsivity p value
Family- based
inattention p value
Family-based hyperactivity- impulsivity p value
rs76846454165796146APELA Upstream, A0.3876.51E-011.34E-034.31E-017.83E-011.29E-081.50E-04 rs12538843739600097POU6F2, YAE1D1Intron, downstream, upstreamA0.2871.85E-012.70E-033.99E-012.67E-012.37E-081.54E-02 rs110742581594770799MCTP2 Upstream C0.1706.57E-021.57E-034.79E-027.24E-023.67E-082.39E-03 rs343965521812286113CIDEA DownstreamG0.3592.93E-012.70E-034.25E-017.69E-024.76E-081.41E-03 rs354938811868153563GTSCR1 Upstream-0.3591.33E-023.89E-034.54E-022.32E-017.79E-087.73E-03 rs12397041351152611DLEU1, DLEU7Intron, downstreamG0.3242.52E-014.51E-035.30E-017.91E-028.03E-081.74E-02 rs111195701206968235IL19, IL10UpstreamA0.3961.98E-014.51E-032.67E-015.66E-011.43E-074.76E-04 rs60150712056314639PMEPA1, MIR4532UpstreamA0.2746.38E-013.48E-027.98E-014.87E-011.56E-072.94E-02 rs3116816629149442OR2J2, OR14J1Exon, downstream, upstreamA0.3981.38E-012.70E-039.09E-013.92E-011.72E-073.44E-03 rs6954881756369816NUPR1L Downstream, upstreamG0.4722.42E-012.28E-031.02E-015.39E-011.82E-072.80E-03 rs12396821351165494DLEU1, DLEU7Intron, downstreamC0.3333.00E-017.53E-033.45E-018.47E-012.59E-071.36E-02 rs60733302042737494JPH2, TOX2DownstreamA0.4813.57E-034.68E-031.45E-029.42E-022.69E-073.23E-02 rs679676502367KDELR2, DAGLBUTR-3, intron, exonC0.4918.41E-022.70E-037.82E-014.34E-013.16E-073.33E-02 rs741207101012937634CCDC3, CAMK1D DownstreamT0.1575.46E-028.15E-033.38E-015.12E-013.23E-073.91E-03 rs622145542052807262CYP24A1, PFDN4UpstreamG0.2503.06E-018.15E-035.62E-012.43E-013.23E-071.81E-02 rs108009191203336808PRELP, FMODUpstream, downstreamC0.3712.74E-011.24E-022.14E-012.55E-014.25E-074.76E-03 rs152360976535517GRID2IP, KDELR2Downstream, upstreamG0.4823.34E-014.68E-038.20E-016.31E-014.68E-073.95E-02 rs2817619111603063PTCHD2 DownstreamT0.4421.04E-012.70E-033.82E-028.80E-015.69E-074.69E-04 rs168239212145376116TEX41UpstreamG0.3333.07E-011.57E-038.32E-013.56E-016.12E-076.81E-05 rs10868138986917301SLC28A3Missense, exonC0.0932.47E-011.43E-023.83E-011.23E-017.29E-072.60E-03 rs93165961322469240LINC00424, LINC00540Upstream, downstreamA0.3438.41E-021.26E-022.29E-013.93E-017.95E-073.78E-02 rs669965117652387CAMTA1IntronT0.106-8.15E-03--8.34E-071.33E-04 rs49453331178920819TENM4IntronG0.2455.57E-026.66E-034.98E-015.83E-019.03E-074.52E-02 rs214220148622182SKINTL, SLC5A9Intron, upstreamC0.5001.35E-017.53E-033.85E-028.37E-019.63E-071.42E-02 rs9464011653866266MLIPIntronC0.1022.92E-018.15E-036.87E-018.87E-013.05E-047.38E-07 APELA
: apelin receptor early endogenous ligand,
CAMK1D
: calcium/calmodulin-dependent protein kinase ID,
CAMTA1
: calmodulin binding transcription activator 1,
CCDC3
:
coiled-coil domain containing 3, Chr
: chromosome,
CIDEA
: cell death-inducing DFFA-like effector
A, CYP24A1
: cytochrome
P450, family 24, subfamily A, polypeptide 1, DAGLB
:
diacylglycerol lipase, beta, DLEU1
: deleted in lymphocytic leukemia 1,
DLEU7
: deleted in lymphocytic leukemia, 7,
FMOD
: fibromodulin, GRID2IP : glutamate receptor,
ionotropic, delta 2
(Grid2 ) interacting protein,
GTSCR1
: Gilles de la Tourette syndrome chromosome region, candidate 1, GWAS : genome-wide association study, IL10 : interleukin 10,
IL19
: in
- terleukin 19, JPH2
: junctophilin 2,
KDELR2
: KDEL (Lys-Asp-Glu-Leu ) endoplasmic reticulum protein retention receptor 2,
LINC00424
: long intergenic non-protein coding RNA
424, LINC00540
: long intergenic
non-protein coding RNA 540, MAF
: minor allele
frequency, MCTP2
: multiple C2 domains, transmembrane
2, MIR4532
: microRNA 4532, MLIP : muscular
LMNA-interacting protein, NUPR1L
: nuclear protein,
transcriptional regulator, 1-like, OR14J1
: olfactory receptor,
family 14, subfamily J, member 1, OR2J2
: olfactory receptor,
family 2, subfamily J, member 2, PFDN4
: prefoldin
subunit 4, PMEPA1
: prostate transmembrane protein, androgen induced 1, POU6F2 : POU
class 6 homeobox 2, PRELP
: proline/arginine-
rich end leucine-rich repeat protein, PTCHD2
: patched domain containing
2, QTL
: quantitative trait
locus, SKINTL
: skint-like, pseudogene,
SLC28A3
: solute
carrier family 28, mem- ber 3, SLC5A9
: solute
carrier family 5, member 9, SNP
: single nucleotide polymorphism,
TENM4
: teneurin transmembrane protein 4, TEX41 : testis expressed 41,
TOX2
: TOX high
mo- bility group box family member 2, YAE1D1
: Yae1 domain containing 1.
However, other reports have concluded that family-based de- signs can be more powerful than case-control designs when evaluating the genetic risk for common complex diseases, as the case-control design is more susceptible to bias due to pop- ulation stratification or phenotype misclassification.30)
Some limitations of our study should be considered when interpreting its results. First, our sample size was small. Sim- ilar to previous ADHD GWAS, our current analysis did not yield any significant genome-wide associations, except for the number of inattention symptoms in the family-based QTL
10
8
6
4
2
0
100
80
60
40
20
0 rs11119570
r2
IL10 IL19
-log10 (p-value) Recombination rate (cM/Mb)
206.92 206.94 206.96 206.98 207
0.8 0.6 0.4 0.2
Position on chr1 (Mb)
A
10
8
6
4
2
0
100
80
60
40
20
0 rs214220
r2
SKINTL SLC5A9
-log10 (p-value) Recombination rate (cM/Mb)
48.55 48.60 48.65 48.70
0.8 0.6 0.4 0.2
Position on chr1 (Mb)
B
Fig. 2. Regional association plots. A: Regional association plot near IL10 and IL19, B: Regional association plot near SKINTL and SL- C5A9. Chr: chromosome, IL10: interleukin 10, IL19: interleukin 19, SLC5A9: solute carrier family 5, member 9, SKINTL: skint-like, pseudo- gene.
analysis. A large-scale, nationwide, or international consor- tium analysis or meta-analysis could overcome this issue.
Second, significant differences in age, gender, IQ, and comor- bid diagnosis of oppositional defiant and conduct disorder were found between ADHD subjects and controls. Moreover, when comparing ADHD subjects and their unaffected sib- lings, significant differences in gender were noted. We cannot disregard the possibility that such differences in gender, age, IQ, and comorbid diagnosis could have masked some true associations. Third, in QTL analysis, only symptoms of inat- tention and hyperactivity were used and intermediate phe- notypes of ADHD, such as neuropsychological test results, were not included. Fourth, we excluded subjects with a histo- ry of recent ADHD medication that could affect quantitative traits of inattention and hyperactivity-impulsivity. However, this may have caused a selection bias by excluding children with such severe symptoms of ADHD that medication was re- quired. Fifth, it must be noted that in the Q-Q plot of the fam- ily-based genome-wide QTL analysis, the observed p values of a large number of variants are inflated rather than matched to a uniform distribution. It is possible that the sample size was not large enough, and that some outliers influenced our re- sults. To address this issue, further replication studies with larger sample sizes are needed.
CONCLUSION
We have identified four QTLs (rs7684645, rs12538843, rs11074258, and rs34396552) with genome-wide significant associations to ADHD and several promising candidates.
Further investigation of these valuable candidates, using in- dependent samples and related functional studies, are war- ranted. Moreover, analyses using larger ADHD sample sizes are likely to reveal additional common genetic risk loci for this complex disorder.
Supplementary Materials
The online-only Data Supplement is available with this article at https://doi.org/10.5765/jkacap.2018.29.2.62.
Acknowledgments
This research was supported by Basic Science Research Program through the National Research Foundation of Korea (NRF) fund- ed by the Ministry of Education, Science and Technology (No.
2012R1A1A3010048).
Conflicts of Interest
The authors have no financial conflicts of interest.
REFERENCES
1) Polanczyk G, de Lima MS, Horta BL, Biederman J, Rohde LA. The worldwide prevalence of ADHD: a systematic review and metare-
gression analysis. Am J Psychiatry 2007;164:942-948.
2) Mannuzza S, Klein RG, Bessler A, Malloy P, LaPadula M. Adult out- come of hyperactive boys. Educational achievement, occupational rank, and psychiatric status. Arch Gen Psychiatry 1993;50:565-576.
3) Faraone SV, Perlis RH, Doyle AE, Smoller JW, Goralnick JJ, Hol- mgren MA, et al. Molecular genetics of attention-deficit/hyperac- tivity disorder. Biol Psychiatry 2005;57:1313-1323.
4) Hawi Z, Cummins TD, Tong J, Johnson B, Lau R, Samarrai W, et al. The molecular genetic architecture of attention deficit hyper- activity disorder. Mol Psychiatry 2015;20:289-297.
5) Gizer IR, Ficks C, Waldman ID. Candidate gene studies of ADHD:
a meta-analytic review. Hum Genet 2009;126:51-90.
6) Demontis D, Walters RK, Martin J, Mattheisen M, Als TD, Agerbo E, et al. Discovery of the first genome-wide significant risk loci for ADHD. bioRxiv [serial online] 2017 Jun [cited 2017 Dec 20]. Avail- able from: https://doi.org/10.1101/145581.
7) Lasky-Su J, Neale BM, Franke B, Anney RJ, Zhou K, Maller JB, et al. Genome-wide association scan of quantitative traits for atten- tion deficit hyperactivity disorder identifies novel associations and confirms candidate gene associations. Am J Med Genet B Neuro- psychiatr Genet 2008;147B:1345-1354.
8) Mick E, Todorov A, Smalley S, Hu X, Loo S, Todd RD, et al. Fami- ly-based genome-wide association scan of attention-deficit/hyper- activity disorder. J Am Acad Child Adolesc Psychiatry 2010;49:898- 905.e3.
9) Hinney A, Scherag A, Jarick I, Albayrak Ö, Pütter C, Pechlivanis S, et al.; Psychiatric GWAS Consortium: ADHD subgroup. Ge- nome-wide association study in German patients with attention deficit/hyperactivity disorder. Am J Med Genet B Neuropsychiatr Genet 2011;156B:888-897.
10) Stergiakouli E, Hamshere M, Holmans P, Langley K, Zaharieva I;
deCODE Genetics; Psychiatric GWAS Consortium, Hawi Z, et al.
Investigating the contribution of common genetic variants to the risk and pathogenesis of ADHD. Am J Psychiatry 2012;169:186-194.
11) Yang L, Neale BM, Liu L, Lee SH, Wray NR, Ji N, et al.; Psychiatric GWAS Consortium: ADHD Subgroup. Polygenic transmission and complex neuro developmental network for attention deficit hy- peractivity disorder: genome-wide association study of both com- mon and rare variants. Am J Med Genet B Neuropsychiatr Genet 2013;162B:419-430.
12) American Psychiatric Association. Diagnostic and Statistical Man- ual of Mental Disorders-text revision (DSM-IV-TR). 4th ed.
Washington, DC: American Psychiatric Association Publishing;
2000.
13) Kim YS, Cheon KA, Kim BN, Chang SA, Yoo HJ, Kim JW, et al.
The reliability and validity of Kiddie-Schedule for Affective Disor- ders and Schizophrenia-Present and Lifetime version-Korean ver- sion (K-SADS-PL-K). Yonsei Med J 2004;45:81-89.
14) Kwak KJ, Oh SW, Kim CT. Korean-Wechsler Intelligence Scale for children. 4th ed. Seoul: Hakjisa;2011.
15) Purcell S, Neale B, Todd-Brown K, Thomas L, Ferreira MA, Bender D, et al. PLINK: a tool set for whole-genome association and popu- lation-based linkage analyses. Am J Hum Genet 2007;81:559-575.
16) Spielman RS, McGinnis RE, Ewens WJ. Transmission test for link- age disequilibrium: the insulin gene region and insulin-dependent diabetes mellitus (IDDM). Am J Hum Genet 1993;52:506-516.
17) Dudbridge F, Gusnanto A. Estimation of significance thresholds for genomewide association scans. Genet Epidemiol 2008;32:227-234.
18) Chng SC, Ho L, Tian J, Reversade B. ELABELA: a hormone essen- tial for heart development signals via the apelin receptor. Dev Cell 2013;27:672-680.
19) Boso M, Emanuele E, Politi P, Pace A, Arra M, Ucelli di Nemi S, et al. Reduced plasma apelin levels in patients with autistic spectrum disorder. Arch Med Res 2007;38:70-74.
20) Perotti D, De Vecchi G, Testi MA, Lualdi E, Modena P, Mondini P,
et al. Germline mutations of the POU6F2 gene in Wilms tumors with loss of heterozygosity on chromosome 7p14. Hum Mutat 2004;
24:400-407.
21) Anney R, Klei L, Pinto D, Regan R, Conroy J, Magalhaes TR, et al.
A genome-wide scan for common alleles affecting risk for autism.
Hum Mol Genet 2010;19:4072-4082.
22) Poelmans G, Pauls DL, Buitelaar JK, Franke B. Integrated genome- wide association study findings: identification of a neurodevelop- mental network for attention deficit hyperactivity disorder. Am J Psychiatry 2011;168:365-377.
23) Nordström EA, Rydén M, Backlund EC, Dahlman I, Kaaman M, Blomqvist L, et al. A human-specific role of cell death-inducing DFFA (DNA fragmentation factor-alpha)-like effector A (CIDEA) in adipocyte lipolysis and obesity. Diabetes 2005;54:1726-1734.
24) Cortese S, Vincenzi B. Obesity and ADHD: clinical and neurobio- logical implications. Curr Top Behav Neurosci 2012;9:199-218.
25) Boyden LM, Lewis JM, Barbee SD, Bas A, Girardi M, Hayday AC, et al. Skint1, the prototype of a newly identified immunoglobulin superfamily gene cluster, positively selects epidermal gammadelta
T cells. Nat Genet 2008;40:656-662.
26) Verlaet AA, Noriega DB, Hermans N, Savelkoul HF. Nutrition, im- munological mechanisms and dietary immunomodulation in ADHD.
Eur Child Adolesc Psychiatry 2014;23:519-529.
27) Cohly HH, Panja A. Immunological findings in autism. Int Rev Neurobiol 2005;71:317-341.
28) Traks T, Koido K, Eller T, Maron E, Kingo K, Vasar V, et al. Polymor- phisms in the interleukin-10 gene cluster are possibly involved in the increased risk for major depressive disorder. BMC Med Genet 2008;9:111.
29) Hintsanen P, Sevon P, Onkamo P, Eronen L, Toivonen H. An em- pirical comparison of case-control and trio based study designs in high throughput association mapping. J Med Genet 2006;43:617- 30) Buyske S, Yang G, Matise TC, Gordon D. When a case is not a case: 624.
effects of phenotype misclassification on power and sample size requirements for the transmission disequilibrium test with affect- ed child trios. Hum Hered 2009;67:287-292.