Acidification and Changes of Mineral Nutrient Availability in Soils Amended with Elemental Sulfur
Byoung-Ho Kim and Jong-Bae Chung*
Division of Life and Environmental Science, Daegu University, Gyeongsan 712-714, Korea
With the increasing cultivation of acid-loving plants such as blueberries, the artificial acidification of soils is frequently required. This research was conducted to determine the application rates of elemental sulfur (S) required in the soil acidification for blueberry cultivation. Laboratory incubation experiment was conducted to acidify three arable soils (pH 6-7) of different texture to pH 4.5-5.0 by the addition of varying amounts of elemental S. All rates of elemental S addition reduced soil pH, although the efficacy of acidification was related to the application rate and soil characteristics. pH reduction was slow in sandy loam soil, and the final equilibrium pH was obtained after 60, 43, and 30 days of incubation in sandy loam, loam, and silty clay, respectively. Although the final pHs obtained after 93 days of incubation were not significantly different among the three soils, the equilibrium pH was relatively higher in soil of higher clay content in the application rates of 1.5-2.0 g S kg-1 soil. The estimated amounts of elemental S required in lowering pH to 4.5-5.0 were 0.59-1.01, 0.67-1.03, and 0.53-0.88 g S kg-1 for sandy loam, loam, and silty clay, respectively. The lowest estimated amount of elemental S in the acidification of silty clay soil was attributable to the low organic matter content. For clay soils containing optimum level of organic matter, the application rates of elemental S should be much higher than those values estimated in this research. Soil acidification did not significantly increase the available concentrations of Ca, Mg and K. Extractable Cu and Zn was not greatly affected by the acidification, but extractable Fe, Mn, and Al in the acidified soils were higher than those found in non-acidified soils. Such increases in solubility are attributable to the dissolution of oxides and hydroxides of the elements.
Key words: Soil acidification, Elemental sulfur, Blueberry, Nutrient availability
Received : January 18. 2011 Accepted : February 17. 2011
*Corresponding author : Phone: +82538506755 E-mail: [email protected]
Introduction
Understanding that soil pH controls the availability of most nutrients is important for proper nutrient man- agement. Most micronutrient metals are directly affected by soil pH. In the pH range 6.0 to 6.5, nutrients are more readily available to plants, and microbial populations in the soil increase. Although most plants grow well in this soil pH range, still many plants such as some members of the Ericacaea (e.g. bluberries, cranberries, azalias and heaths) and Theaceae (e.g. camellias) require acid soil conditions to thrive. Blueberries require acid soil with pH below 5.5, and they do best where the pH is between 4.5 and 5.0 (Harmer, 1944; Haynes and Swift, 1985). Iron deficiency is the most common problem in blueberries growing in a pH higher than 5.8
(Pritts and Hancock, 1992). The plant cannot obtain enough iron from the soil for normal growth. Trees under iron-deficiency display smaller than normal leaves that are yellowish with prominent green veins, often with brown edges (Pritts and Hancock, 1992).
With the increasing commercial cultivation of acid- loving plants such as blueberries, the artificial acidi- fication of soils is frequently required. To lower soil pH, sulfuric acid may be applied directly to the soil.
Sulfuric acid application is a rapid and effective way to lower the pH, but the acid is potentially hazardous and difficult to use. Though fertilizers containing ammo- nium and iron sulfate are used as acidifying materials, inexpensive elemental S is more often applied as a soil amendment to decrease the pH of soils (Tisdale et al., 1985; Zhihui et al., 2008). When elemental S is mixed with the soil, naturally occurring Thiobacillus oxidize it to form sulfuric acid (Germid and Janzen, 1993;
Wainwright, 1984). However, oxidation of S in the soil is slow, and quick changes in soil pH should not be
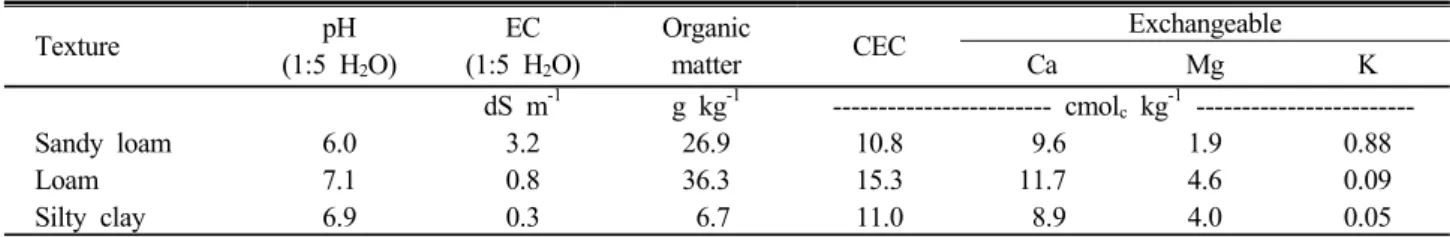
Table 1. Selected physical and chemical properties of the three soils.
Texture pH
(1:5 H2O)
EC (1:5 H2O)
Organic
matter CEC Exchangeable
Ca Mg K
dS m-1 g kg-1 --- cmolc kg-1 ---
Sandy loam 6.0 3.2 26.9 10.8 9.6 1.9 0.88
Loam 7.1 0.8 36.3 15.3 11.7 4.6 0.09
Silty clay 6.9 0.3 6.7 11.0 8.9 4.0 0.05
expected. Warm temperatures and good moisture and aeration are required for S oxidizing bacteria to function (Janzen and Bettany, 1987; Li and Caldwell, 1966; Nor and Tabatabai, 1977). Sulfur oxidation is minimal at soil temperatures less than 5℃, and applications are best made when temperatures are warm enough for the bacteria to oxidize the S (Germida and Janzen, 1993).
The oxidation rate differs among soils and is reported to be dependent on soil properties such as contents of clay and organic matter, and fertility (Barrow, 1960;
Nor and Tbatabai, 1977; Sholch et al., 1997; Stewart et al., 1966) and environmental conditions such as soil temperature, water potential, and aeration (Janzen and Bettany, 1987).
Blueberries are becoming a popular economic horti- cultural crop recently introduced to Korean farmers.
Blueberry grows best in well-drained, acid, sandy loam with organic matter content greater than 3.0%. The optimum soil pH is between 4.5 and 5.0, although blueberry will tolerate a pH between 3.8 and 5.5 (Pritts and Hancock, 1992). Since one of the primary require- ments for the crop is an acidic soil, blueberry growers are interested in pH adjustment of their soils. Since there is no routine soil test available to determine soil acidification amendment rates, general guidelines for acidification of soils of different texture are provided in the United States and other countries (Horneck et al., 2004; Mitchell, 2000; Mullen et al., 2007). There are many virtual farmers becoming interested in blueberry cultivation in Korea, but there are still no official guide- lines for soil acidification using elemental S.
The objective of this research was to determine the appropriate application rates of elemental S required in soil acidification for blueberry cultivation. In addition, effects of acidification on the nutrient availability of soils were investigated.
Materials and Methods
Three upland soils of different texture were collected
from farmers' fields in Hayang, Gyeongsan City. Soil samples were collected from the 0-20 cm surface layer, air-dried and crushed to pass 5-mm sieve before ex- periment. Selected properties of the soils were presented in Table 1. Soil particle size distribution was determined by the micro-pipette method (Miller and Miller, 1987).
Soil pH was determined using a glass electrode in 1:5 soil-water suspensions. Electrical conductivity of the soil was measured in 1:5 soil to water extract. Organic matter was determined by using Walkley-Black procedure (Nelson and Sommers, 1982). Cation exchange capacity was determined using ammonium acetate method, and the exchangeable cations extracted in the ammonium acetate were analyzed by an inductively coupled plasma optical emission spectrometer (Varian Liberty Series II, Mulgrave, Australia) (NAIST, 1988).
Eight elemental S application rates in the range 0.5 to 2.0 g S kg-1 soil were included in the soil acidi- fication experiment. Elemental S powder (98.0%, Duksan Pure Chemicals Co., Ansan, Korea) was mixed with 200 g of air-dry soil in 500-mL polycarbonate bottles.
Distilled-deionized water was added to each bottle to bring soil moisture to –0.01 MPa. The top of each bottle was covered with the lid loosely screwed on. The soil samples were incubated for 93 days at 25℃, and moisture was adjusted weekly by measuring weight loss. Duplicate experiments were made within each S treatment.
During the incubation, 5 g soil sample was removed from each bottle and soil pH was determined using a glass electrode in 1:5 soil-water suspension. At the end of incubation experiment, EC and concentrations of Ca, Mg, K, Al, Fe, Mn, Cu and Zn extractable in 0.1 M HCl were measured in the soil samples non-acidified and acidified to around pH 4.5. Electrical conductivity was measured using conductivity meter in 1:5 soil-water extracts, and concentrations of mineral nutrients were determined using an inductively coupled plasma optical emission spectrometer (Varian Liberty Series II, Mulgrave, Australia) after extraction with 0.1 M HCl using 1:2.5 soil-extractant ratio for 2 h.
Loam
0 10 20 30 40 50 60 70 80 90 100
pH
3.0 3.5 4.0 4.5 5.0 5.5 6.0 6.5 7.0 7.5
Silty clay
Days of incubation
0 10 20 30 40 50 60 70 80 90 100
pH
3.0 3.5 4.0 4.5 5.0 5.5 6.0 6.5 7.0 7.5
Sandy loam
0 10 20 30 40 50 60 70 80 90 100
pH
3.0 3.5 4.0 4.5 5.0 5.5 6.0 6.5 7.0 7.5
0.5 g S kg-1 soil 1.0 g S kg-1 soil 1.5 g S kg-1 soil 2.0 g S kg-1 soil
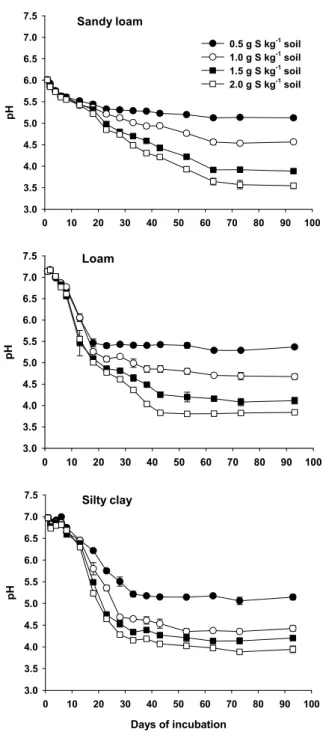
Fig. 1. Changes of pH in three soils of different texture amended with elemental sulfur during the incubation.
Results and Discussion
pH changes in soils of different texture following elemental S application are shown in Fig. 1. Application of elemental S for the purpose of acidification of soils turned out to be very effective, and the reduction in soil pH was proportional to the application rate and soil characteristics. After initial application of S, silty clay soil only exhibited a short distinct lag phase before
rapid soil acidification was observed. pH reduction was very slow in sandy loam soil; the final equilibrium pH was obtained after 60 days of incubation in all of the application rates of elemental S. In loam soil, a rapid decrease of soil pH occurred in the first 18 days for the application rate 0.5 g S kg-1, and in the first 43 days for the application rates higher than 0.5 g S kg-1. The most rapid decrease of soil pH was found in silty clay soil, and the linear decrease of pH was occurred in the first 30 days and further reduction of soil pH was insignificant.
Comparing the soils with different textures, acidification by elemental S application was more rapid in fine- textured soil. The H+ ions released during the oxidation of elemental S cause soil pH to decrease. Sulfur oxi- dation is known to be significantly affected by physical properties of soils, though the effects are not always consistent (Germida and Janzen, 1993). In general, oxi- dation rate of elemental S is known to be inversely related to clay content, but the effect of textural characteristics on S oxidation could be due to the variation in aeration (Janzen and Bettany, 1987; Rehm and Caldwell, 1969).
In our experiment, soils were incubated at 30% of field moisture capacity and differences in aeration arising from variation in texture are not likely to be pronounced.
Janzen and Bettany (1987) found a highly significant positive correlation between oxidation rate of S and indigenous soil organic matter. The positive relationship between S oxidation and organic matter may be attrib- utable to the response of heterotrophic S oxidizing or- ganisms to availability of substrate (Wainwright et al., 1986). However, among the three soils used in this research, organic matter content was lowest in the silty clay soil where pH reduction was most rapid. At this point, the most rapid soil acidification in the silty clay soil cannot be explained properly, but the higher ef- fective surface area of the soil would be one of the reasons for the rapid elemental S oxidation.
Although the soil properties including initial pH, texture, and organic matter content were different, the final equilibrium pHs obtained after 93 days of incubation were not significantly different among the three soils in all of the application rates of elemental S. However, in the application rates of 1.5-2.0 g S kg-1 soil, the final equilibrium soil pH was relatively higher in soil of higher clay content, and this result could be due to the buffering activity enhanced by clay at soil pH below
Loam
0.00 0.25 0.50 0.75 1.00 1.25 1.50 1.75 2.00 2.25
pH
3.0 3.5 4.0 4.5 5.0 5.5 6.0 6.5 7.0
Y = 3.3768 + 3.2194e-1.0143X r2 = 0.9996
Silty clay
Application rate of elemental sulfur, g kg-1 soil 0.00 0.25 0.50 0.75 1.00 1.25 1.50 1.75 2.00 2.25
pH
3.0 3.5 4.0 4.5 5.0 5.5 6.0 6.5 7.0
Y = 3.9215 + 2.7853e-1.7803X r2 = 0.9998
Sandy loam
0.00 0.25 0.50 0.75 1.00 1.25 1.50 1.75 2.00 2.25
pH
3.0 3.5 4.0 4.5 5.0 5.5 6.0 6.5 7.0
Y = 5.7183 - 1.1960X r2 = 0.9999
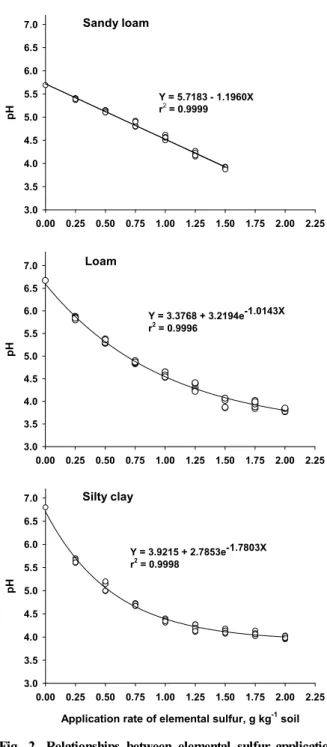
Fig. 2. Relationships between elemental sulfur application rate and soil acidification in three soils of dif- ferent texture.
4.5. It is well known that finer textured soils have greater buffering capacity than coarser textured (Sparks, 1995).
The relationships between application rate of elemental S and final equilibrium soil pH are presented in Fig. 2.
The relationship was linear until the pH was lowered to 4.0 in sandy loam soil, and in loam and silty clay soils it could be best described by an exponential decay model. The linear relationship found in sandy loam soil
could be due to the minimal variation of soil buffering capacity in the pH range. The exponential relationships in loam and silty clay soils could be due to the rela- tively stronger buffering capacity of the soil in the more acidic pH range. Such buffering at pH range below 5.0 is mainly proportional to the content of clay in the soils rather than organic matter. In the silty clay soil, where the greatest buffering was found, organic matter content was only 6.7 g kg-1 soil. However, in the pH range above 5.0, soil acidification per unit of S applied was greater in silty clay soil compared to loam soil. This result could be related to the difference in organic matter content between the two soils. The amount of elemental S required for 1 kg soil to bring the pH down to 4.5 was about 1.02 g for sandy loam and loam soils, and 0.88 g for silty clay soil (Fig. 2). This result indicates that the amount of elemental S required in reduction of soil pH to 4.5-5.0 is largely dependent on soil organic matter content rather than clay. Organic matter is suggested as the major determining factor in- fluencing pH buffering; clay content is the next impor- tant factor (Magdoff and Bartlett, 1985).
In the sandy loam soil, the amount of elemental S required in lowering 1 pH unit can be easily estimated using the linear relationship between the application rate of elemental S and soil pH. Application of 0.836 g elemental S is expected to reduce 1 pH unit of 1 kg of the soil. However, for the loam and silty clay soils, since the relationship between the application rate of elemental S and soil pH is not linear, it would be difficult to recommend elemental S application rate required in reducing 1 unit of soil pH. The ideal soil pH for blueberry is approximately 4.5 to 5.0, although the plants will tolerate a pH between 3.8 and 5.5.
Using this pH criteria for blueberry soils, the amounts of elemental S required in lowering pH from the initial values to 4.5-5.0 could be estimated from the relationships between the elemental S application rate and soil pH (Fig. 2); 0.59-1.01, 0.67-1.03, and 0.53-0.88 g S kg-1 for sandy loam, loam, and silty loam, respectively.
Although the three soils have different characteristics including initial pH, the required elemental S in lowering pH to the optimum range for blueberry were not no- ticeably different. Especially, despite the various initial values, soil pH was equally lowered to around 5.2 by the application of 0.5 g S kg-1 soil. This result indicates the variation of initial pH in the range of 6-7 does not
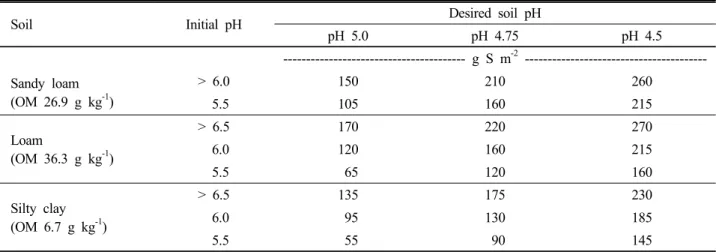
Table 2. The estimated amounts of elemental sulfur needed to lower pH to a depth of 20 cm for the three soils tested in this experiment.
Soil Initial pH Desired soil pH
pH 5.0 pH 4.75 pH 4.5
--- g S m-2 --- Sandy loam
(OM 26.9 g kg-1)
> 6.0 150 210 260
5.5 105 160 215
Loam
(OM 36.3 g kg-1)
> 6.5 170 220 270
6.0 120 160 215
5.5 65 120 160
Silty clay (OM 6.7 g kg-1)
> 6.5 135 175 230
6.0 95 130 185
5.5 55 90 145
affect on the elemental S application rates required to lower the pH to 4.5-5.0. Using the relationships in Fig.
2, the amounts of elemental S required in lowering soil pH to the optimum range (5.0 to 4.5) for blueberry were estimated on an area basis for the three tested soils (Table 2). The blueberry root system is composed primarily of fine, fibrous root near the soil surface.
Because elemental S reacts slowly with the soil, it should be applied and incorporated to the top 20 cm of soil where most blueberry roots are located (Bryla and Strik, 2007). In the estimation of S application, the mass of soil in 1 m2 to a depth of 20 cm was cal- culated using the bulk density of soil 1.3 g cm-3.
Comparing the amounts of elemental S needed to lower soil pH, higher amounts of elemental S were required for loam soil than those for sandy loam. This results could be due to the finer texture and higher organic matter content of loam soil. However, the silty clay soil, which contained very low organic matter, re- quired much less amounts of elemental S in the acidification than loam soil. The ability to buffer or stabilize pH of soils is often tied to their organic matter content. For clay soils containing organic matter greater than 20-30 g kg-1, the amounts of elemental S required to lower soil pH should be much higher than those values presented in Table 2.
Since blueberries, having fibrous and shallow roots, are sensitive to soil compaction and poor drainage, fine- textured clay soils should be avoided when establishing a new blueberry planting. The estimated elemental S application rates for sandy loam and loam soils in Table 2 can be used in most blueberry soil preparations with modifications according to the grower’s soil char-
acteristics. The recommended application rates of elemental S for sandy loam and loam soils were not significantly different from those values found in the general soil acidification guidelines of the United States (Horneck et al., 2004; Mitchell, 2000; Mullen et al., 2007). Field applicability of the results of this experiment should be further investigated, and individual soils should be tested in detail for more precise determination of elemental S application rates.
Commercial S sources would be various in purity and particle size, so it should be remembered to adjust the application rate based on the characteristics of the material. Soil pH adjustment with elemental S should be monitored over time with routine soil sampling and analysis. This will ensure that the S applied is having the desired effect on soil pH. Under the optimum condition for S oxidation in laboratory, final equilibrium soil pHs were attained after 30 to 60 days depending on the soil characteristics, but before planting it should be ensured that temperatures and time were sufficient for the S to have been oxidized. It is also wise to check the soil pH before reapplication of S to avoid over-acidification, especially in sandy soils that have little capacity to buffer changes in soil pH.
Growers can reduce the soil pH if it is above the desired level. However, lowering the pH of some soils can release high levels of certain elements that can be toxic to the blueberry plants (Pritts and Hancock, 1992).
Changes of EC and contents of 0.1 M HCl extractable elements in soils of different texture with acidification by elemental S are presented in Table 3. Extractable Ca and Mg were slightly increased as the pH was lowered, but extractable K content was not changed. Extractable
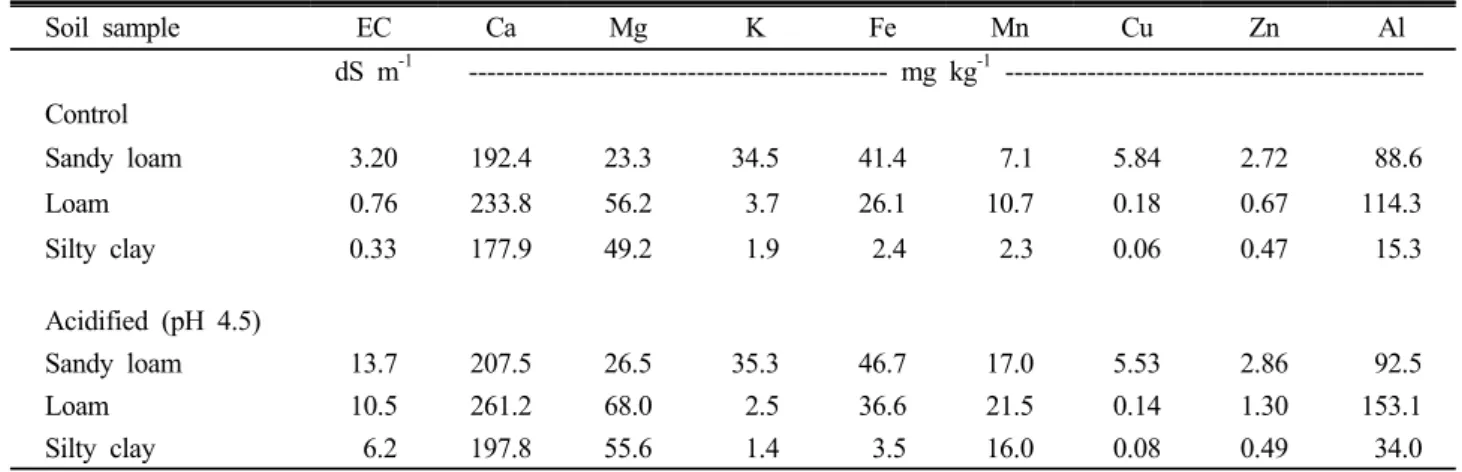
Table 3. Effect of acidification by elemental S application on the EC and contents of 0.1 M HCl extractable minerals in soils of different texture.
Soil sample EC Ca Mg K Fe Mn Cu Zn Al
dS m-1 --- mg kg-1 --- Control
Sandy loam 3.20 192.4 23.3 34.5 41.4 7.1 5.84 2.72 88.6
Loam 0.76 233.8 56.2 3.7 26.1 10.7 0.18 0.67 114.3
Silty clay 0.33 177.9 49.2 1.9 2.4 2.3 0.06 0.47 15.3
Acidified (pH 4.5)
Sandy loam 13.7 207.5 26.5 35.3 46.7 17.0 5.53 2.86 92.5
Loam 10.5 261.2 68.0 2.5 36.6 21.5 0.14 1.30 153.1
Silty clay 6.2 197.8 55.6 1.4 3.5 16.0 0.08 0.49 34.0
Fe, Mn, and Al in the acidified soils were higher than those found in non-acidified soils. Such increases in solubility may be attributable to dissolution of oxides and hydroxides of those elements (Haynes and Swift, 1986). Extractable Cu and Zn in soils were not greatly affected by the acidification. As the solubility of some mineral elements increased after acidification, EC was quite significantly increased in all of the tested soils.
Although the solubilization effect could be diminished and returned to almost initial values over time, the sol- ubilized excessive minerals must be removed in order to avoid any deteriorate effects of high EC and toxicities of certain elements on the growth of plants.
In various artificially acidified soils, Mn toxicity is frequently observed in blueberry plants. In this experiment, Mn showed the most marked increase in acidified soils.
It is well known that soil acidification by elemental S results in increased uptake of Mn by plants (Garey and Barber, 1952; Hassan and Olson, 1966; Procopiou et al., 1976). It has been suggested that a major effect of S on Mn availability is in a decrease of the easily reducible Mn in soil as S is oxidized rather than soil acidification directly (Tisdale and Bertramson, 1959).
Organic complexing of Cu and Fe in soils appears to result in their solubility being less pH dependent than that of Mn and Al (Haynes and Swift, 1985). In soils with a high Mn content, the soil pH is recommended to be maintained near 5.2 to prevent toxicity (Horneck et al., 2004; Pritts and Hancock, 1992).
Acknowledgment
This research was supported by the Daegu University Research Fund in 2010.
References
Barrow, N.J. 1960. A comparison of the mineralization of nitrogen and of sulphur from decomposing organic materials.
Aust. J. Agric. Res. 11:960-969.
Bryla, D.R. and B.C. Strik. 2007. Effects of cultivar and plant spacing on the seasonal water requirements of highbush blueberry. J. Am. Soc. Hort. Sci. 132:270-277.
Garey, C.L. and S.A. Barber. 1952. Evaluation of certain factors involved in increasing manganese availability with sulfur. Soil Sci. Soc. Am Proc. 16:173-174.
Germida, J.J. and H.H. Janzen. 1993. Factors affecting the oxidation of elemental sulfur in soils. Fert. Res. 35:101-113.
Harmer, P.M. 1944. The effect of varying the reaction of organic soil on the growth and production of the domesticated blueberry. Soil Sic. Soc. Am. Proc. 9:133-141.
Hassan, N. and R.A. Olson. 1966. Influence of applied sulfur on availability of soil nutrients for corn (Zea mays L.) nutrition. Soil Sci. Soc. Am Proc. 30:284-286.
Haynes, R.J. and R.S. Swift. 1985. Effects of soil acidification on the chemical extractability of Fe, Mn, Zn and Cu and the growth and micronutrient uptake of highbush blueberry plants. Plant Soil 84:201-212.
Haynes, R.J. and R.S. Swift. 1986. Effects of soil acidification and subsequent leaching on levels of extractable nutrients in a soil. Plant Soil 95:327-336.
Horneck, D., J. Hart, R. Stevens, S Petrie, and J. Altland.
2004. Acidifying soil for crop production, West of the Cascade mountain. EM 8857-E, Extension Service, Oregon State University, Corvallis, OR, USA.
Janzen, H.H. and J.R. Bettany. 1987. The effect of temperature and water potential on sulfur oxidation in soils. Soil Sci.
144:81-89.
Li, P. and A.C. Caldwell. 1966. The oxidation of elemental sulfur in soil. Soil Sci. Soc. Am. Proc. 30:370-372.
Magdoff, F.R. and R.J. Bartlett. 1985. Soil pH buffering revisited. Soil Sci. Soc. Am. J. 49:145-148.
Miller, W.P. and D.M. Miller. 1987. A micro-pipette method for soil mechanical analysis. Commun. Soil Sci. Plant Anal.
18:1-15.
Mitchell, C.C. 2000. Soil acidity and liming - Part 2. Lowering soil pH. Extension Service, Clemson University. (http://hubcap.
clemson.edu/~blpprt/acidity2.html)
Mullen, R., E. Lentz, and M. Watson. 2007. Soil acidification:
How to lower soil pH. Extension Factsheet, Ohio State University Extension, Columbus, OH, USA.
NAIST. 1988. Methods of soil chemical analysis. RDA, Suwon, Korea.
Nelson, D.W. and L.E. Sommers. 1982. Total carbon, organic carbon, and organic matter. p. 539-579. In A.L. Page et al. (ed.) Methods of soil analysis. Part 2: Chemical and microbiological properties. SSSA, Madison, WI, USA.
Nor, Y.M. and M.A. Tabatabai. 1977. Oxidation of elemental sulfur in soils. Soil Sci. Soc. Am. J. 41:736-741.
Pritts, M.P. and J.F. Hancock. 1992. Highbush blueberry pro- duction guide. Publication No. NRAES-55. Natural Resource, Agriculture, and Engineering Services, Cooperation Extension, Ithaca, New York, USA.
Procopiou, J., A. Wallace, and G.V. Alexander. 1976. Mi- cronutrient composition of plants grown with high to low levels of sulphur applied to calcareous soil in glasshouse.
Plant Soil 44:359-365.
Rehm, G.W. and A.C. Caldwell. 1969. Relationship of soil texture to sulfur oxidation. Agron. J. 61:333-334
Sholch, R.D., B. Lefroy, and G.J. Blair.1997. Effect of nutrients and elemental sulfur particle size on elemental sulfur oxidation and the growth of Thiobacillus thiooxidans. Aust. J. Agric.
Res. 48:497-501.
Sparks, D.L. 1995. Environmental soil chemistry. Academic Press, New York, USA.
Stewart, B.A., L.K. Porter, and F.G. Viets. 1960. Effect of sulphur contents of straw on rates of decomposition and plant growth. Soil Sci. Soc. Am. Proc. 30:355-358.
Tisdale, S.L. and B.R. Bertramson. 1959. Elemental sulfur and its relationship to manganese availability. Soil Sci. Soc.
Am. Proc. 14:131-137.
Tisdale, S.L., W.L. Nelson, and J.D. Beaton. 1985. Soil Fertility and Fertilizers. 4th ed. MacMillan, New York, USA.
Wainwright, M. 1984. Sulphur oxidation in soils. Adv. Agron.
37:349-396.
Wainwright, M., W. Nevell, and S.J. Grayston. 1986. Effects of organic matter on sulphur oxidation in soil and influence of sulphur oxidation on soil nitrification. Plant Soil 96:
369-376.
Zhihui, Y., S. Haneclaus, B.R. Singh, and E. Schnug. 2008.
Effect of repeated application of elemental sulfur on microbial population, sulfate concentration, and pH in soils. Commun.
Soil Sci. Plant Anal. 39:124-140.