1. Introduction
OSA is a sleep breathing disorder, happens in more than 3–5 % [1] in adult general population. OSA is a disorder that is characterized by obstructive apneas and
hypopneas caused by repetitive collapse of the upper airway during sleep. Sleep problems are common among older adults and it can be difficult to separate disease processes from changes in sleep associated with normal aging. Several studies have examined the
A Convergence HRV Analysis for Significant Factor Diagnosing in Adult Patients with Sleep Apnea
Min-Soo Kim, Jong-Hyeog Jeong, Young-Chang Cho
*Department of Aviation Information & Communication Eng. Kyungwoon University
수면무호흡을 가진 성인환자들의 주요인자 진단을 위한 융합 심박변이도 해석
김민수, 정종혁, 조영창*
경운대학교 항공정보통신공학과
Abstract The aim of this study was to determine the statistical significance of heart rate variability(HRV) between sleep stages, Apnea–hypopnea index(AHI) and age in patients with obstructive sleep apnea(OSA). This study evaluated the main parameters of HRV over time domain and frequency domain in 40 patients with sleep apnea. The non-REM(sleep stage) was statistically validated by comparing the AHI degree of the three groups(mild, moderate, severe) of sleep apnea patients. The NN50(p=0.043), pNN50(p=0.044), VLF peak(p=0.022), LF/HF(p=0.028) were statistically significant in the R-R interval of patients with sleep apnea from the control group (p<0.05). The LF / HF (p = 0.045) and HF power (p = 0.0395) parameters between the non-RAM sleep (sleep 2 phase) and REM sleep in patients with sleep apnea were statistically significant in the control group(p<0.05). We may be able to provide a basis for understanding the correlation among AHI, sleep stage and age and heart rate variability in patients with obstructive sleep apnea.
Key Words : Convergence HRV, Sleep apnea patient, Parameter, non-REM, REM, AHI
요 약
이 연구의 목적은 폐쇄성수면무호흡환자들의 수면단계, AHI, 연령대 간 심박변이도의 통계적 유의성을 결정하는것이다. 이 연구는 수면무호흡 성인 환자 40명을 대상으로 시간영역 및 주파수 영역에서 심박변이도의 주요 파라메타를 평가하였다. 비 램수면 단계는 3개 그룹 수면무호흡증 환자의 AHI 등급을 비교하여 통계적으로 검증되었다.
NN50(p=0.043), pNN50(p=0.044), VLF peak(p=0.022) 및 LF/HF(p=0.028) 매개변수들은 대조군에서 수면무호흡증환 자의 R-R 간격에서 통계적으로 유의하였다. 수면무호흡 환자들의 비 램수면(수면2단계)과 램수면 사이의 LF/HF (p=0.045)과 HF power(p=0.0395)파라메타들은 대조군 그룹에서 통계적 유의하였다. 우리는 이 연구에서 폐쇄성 수면무 홉증환자들의 AHI, 수면단계 및 연령이 심박변이도 상관관계를 이해하는데 근거를 제시 할 수 있을 것이다.
주제어 :
융합심박변이도, 수면무호흡환자, 매개변수, 비램수면, 램수면, 수면무호흡중증도지표*Corresponding Author : Young Chang Cho ([email protected]) Received November 13, 2017
Accepted January 20, 2018
Revised November 17, 2017 Published January 28, 2018
ability to predict sleep apnea clinically prior to polysomnography[2-4]. Increasing age is a significant risk factor in these studies[3, 4], and the Apnea–
hypopnea index(AHI) appears to be significantly associated with age [5]. The AHI is the total number of apnea and hypopneas per hour of sleep. The respiratory disturbance index (RDI) is the total number of events per hour of sleep.
Polysomnography (PSG) during the entire night is currently the only reliable diagnostic method of OSA.
By definition, an apnea event is the cessation of airflow to the lungs lasting at least 10 seconds[6]. The standard PSG consists of a record of various physiological parameters including EEG, ECG, EMG of chins and legs, nasal airflow, electrooculogram(EOG), abdominal and thoracic movements and blood oxygen saturation (SaO2).
Spectral analysis of the HRV is a non-invasive way to obtain information about parasympathetic nervous system[7-9]. Measurement of HRV in patients with sleep apnea patients are important because meta analyses of published data demonstrate that reduced.
HRV is strongly associated with increased risk of total mortality, cardiovascular mortality, and nonfatal cardiovascular events [10].
Previous studies have shown that sleep stages and age affect HRV. Decreased HF components and increased LF components characterize HRV in rapid eye movement sleep (REM) with opposite changes in non-REM sleep [11, 12]. These findings suggest increased sympathetic activity relative to parasympathetic activity in REM sleep in comparison to non-REM sleep [13].
In this paper, we developed the R detection algorithm for HRV analysis and performed the necessary studies to diagnose major factors in adult patients with sleep apnea. The aim of this study was to determine the statistical significance of HRV parameters according to non-REM, REM, AHI, and age in sleep apnea patients.
2. Methods and Materials
2.1 Subjects
Forty untreated male OSA patients were recruited from hospital in Daegu, and their mean ±SD age was 57±5.99 yr.All subjects met the following inclusion criteria; 1) male, 2) less than 70 yr old, 3) AHI greater than 5. The ECG signals were analyzed using the R wave peak detection algorithm developed in the research group. The HRV analyses in time domain are standard deviation of NN interval (SDNN) and square root of mean of sum of squares of differences between adjacent NN intervals (RMSSD). In the frequency domain, the total power(TP), very low frequency (VLF), low frequency(LF), high frequency(HF), and LF/HF ratio of the HRV were compared.
ECG was recorded using a digital recording system (Grass Technologies) with ECG filters set at 1 and 70 Hz. PSG recording was performed using 14 channel positions. Activity was captured continuously overnight by a personal computer (Twin model polygraph) through an analog-to-digital converter with 12-bit resolution and a sampling rate of 200 Hz for off-line analysis using the acquisition program.
Statistical analysis was performed using SPSS 12.0 for Windows (SPSS Inc., Chicago, IL, USA). Univariate correlations between clinical features were evaluated using the Student t test or Mann-Whitney U test with continuous variables after checking for normality using the Kolmogorov-Smirnov test. A 2-tailed p < 0.05 was considered as statistically significant.
2.2 Heart rate variability
Time domain HRV is a set of statistical measures
derived from the beat file. The most global HRV
measure is SDNN (the standard deviation of all NN
interval). SDNN is usually measured on the entire
recording but it can be measured on any segment or
during specific sleep stages. Time domain measures of
RR variability can be used to summarize information
about either short or long-term variation in RR
intervals[14-16]. In a continuous ECG recording, each R wave or QRS complex is detected and labeled as normal sinus(N) or abnormal. The time series of normal to normal intervals(NN) is then used to calculate time domain measures that may be expressed directly in ms from NN intervals or in beats/min from instantaneous heart rate.
Frequency domain HRV parses out the variance in beat-to-beat HR into its underlying components at different frequencies using fast-Fourier transform (FFTs) or equivalent techniques. It should be emphasized that calculation of most frequency domain HRV requires a condition called “stationarity” that the mean and variance of the signal do not change significantly at different points in the recording. In order to roughly meet this requirement, some frequency domain HRV measures are calculated over short intervals, e,g., 5min or less, and averaged as needed but this also means that some frequency domain measures are less useful when the HR is changing rapidly. In HRV analysis, the PSD estimation is generally carried out using either FFT based methods. The spectrum is then obtained by averaging the spectra of these segments. This method decreased the variance of the FFT spectrum. In frequency bands in case of short term HRV recordings are the very low frequency(VLF, 0.003-0.04), low frequency(LF, 0.04-0.15Hz), and high frequency(HF, 0.15-0.4Hz).
2.3 R wave detection algorithm
In this study, we used a series of processes such as filtering and thresholding to the difference signal of the original signal. After the thresholding process we used weight function to detect the position of the peak R wave value because the R wave has both a large signal value and large magnitude of signal change. The weight function and its weights are defined in Eq.(1) and Eq.(2) as
(1)
max
max
max
max
max
max(2)
where
maxand
maxindicate the maximum values of the original signal and difference signal, respectively.
The position of the peak R wave value is detected when the weight function has a maximum value in a given interval from Eq. (3)
max
≤ ≤ (3) We developed an efficiency analysis based on the R wave position auto-detection algorithm[17] for R-R interval calculation as summarized in Figure 1. Figure 2 shows an example of simultaneously recorded ECG R-R interval during OSA and when the subject was sleep stage 2.
[Fig. 1] R wave auto detection algorithm
[Fig. 2] Result of R-R interval detection for HRV analysis during sleep apnea
3. Results
In this paper, experiments were conducted to find
statistical significance of HRV parameters associated
with AHI, age, non-REM, and REM in sleep apnea
patients. The HRV parameters are divided into the time
domain and the frequency domain. The time domain
analysis and the frequency domain included in the mean RR, STD RR, mean HR, STD HR, RMSSD, NN50, pNN50, RR Trian, TNN (STD), VLF peak, HF peak (Hz), VLF power (ms2), LF power (ms2), HF power (ms2), LF / HF ratio, VLF power (%), LF power(%)and HF power(%).
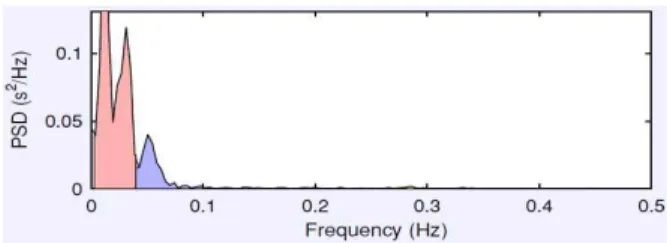
Figure 3 and Figure 4 compare HRV frequencies in non-REM and REM sleep when sleep apnea occurs, confirming that the high-frequency band disappears and the low-frequency band appears. Non-REM stage is compared AHI degree of the 3 groups (mild 5-15, moderate 15-30, severe ≥30) during the sleep apnea and performed statistical significance. In the statistical results, NN50, pNN50, VLF peak (Hz), LF/HF factors were statistically significant shown in Table 1.
However, no significant differences were found in STD HR, RMSSD, LF peak(Hz) and HF peak(Hz). The REM stage was analyzed statistically by dividing the degree of the AHI into two groups(AHI<30≥30) during sleep apnea. In the experiment, the non-normal distributions was included in the RMSSD and HF peak(ms2). The t-test was also statistically significant, with STD HR, NN50, pNN50 and VLF% shown in Table 2. The result of the LF/HF(ratio) and HF power (%) of the between of non-REM and REM in the OSA patients were significantly significance from those of the control group (p<0.05) shown in Table 3. At the non-REM stage, statistical analysis was performed on patients with sleep apnea before and after 57 years of age. In the experiment, we obtained a only the HF peak (Hz) band statistical significance of in the frequency domain shown in Table 4. Table 5 used in the experiment were used in 5 minutes and analysed the baseline and REM during sleep apnea. Statistical analysis showed that the Mean RR, RMSSD, pNN50 and TINN were not statistically significant in the time domain. In the frequency domain, VLF peak (Hz), LF peak (Hz), HF peak (Hz), VLF power (ms) and LF % were not statistically significant. And other parameters of HRV showed statistical significance. The results of this study demonstrated that sleep stages and age, as in
previous studies, affect HRV. AHI was compared between two levels (<30 ≥ 30) and three levels (5-15, 15-30, ≥30) in the HRV comparison study, NN50 and pNN50 parameters were statistically significant. Thus, AHI was also found to affect sleep stages and HRV.
[Fig. 3] sleep apnea(non-RME, sleep stage 2)
[Fig. 4] Sleep apnea(REM)
Parameters Group(average) p
AHI 5-15 15-30 ≥30
STD HR 5.50±1.52 8.36±6.70 5.67±2.66 0.281 RMSSD 55.28±20.75 105.24±79.14 56.61±8.3 0.149 NN50 35.40±23.33 48.20±28.26 23.61±24.35 0.043 pNN50 21.06±14.67 28.41±18.49 13.06±13.42 0.044 peak(Hz)VLF 0.06944±0.114 0.0140±0.0072 0.0157±0.0059 0.022
LF peak(Hz) 0.04924±0.0059 0.0654±0.0302 0.0568±0.0348 0.506 HF
peak(Hz) 0.30±0.072 0.260±0.055 0.270±0.0426 0.345 LF/HF 1.8536±1.848 1.263±1.116 4.779±5.819 0.028
<Table 1> Results of inspection in statistic significance according to AHI degree
Parameters Average(STD) p value
STD HR 11.26±10.14 0.032
NN50 51.58±46.76 0.017
pNN50 28.88±25.62 0.018
VLF power(%) 52.51±28.84 0.005
<Table 2> Results of two groups(AHI<30≥30) during sleep apnea
Sleep state p value
Parameters Non-REM REM
RMSSD 73.7±9.4 72.7±9.90 0.149
NN50 24.2±22.0 22.3±22.0 0.503
pNN50 21.6±20.0 19.1±19.0 0.247
VLF peak(Hz) 0.0147±0.005 0.0140±0.009 0.572 LF peak(Hz) 0.060±0.031 0.056±0.0210 0.612 HF peak(Hz) 0.246±0.050 0.264±0.071 0.352
LF/HF 2.633±3.75 4.26±4.89 0.045
VLF power (%) 61.78±24.2 66.3±23.70 0.427 LF power (%) 17.08±9.6 17.14±11.40 0.967 HF power (%) 21.1±22.0 16.4±16.0 0.039
<Table 3> Result of comparison of statistically difference between Non-REM and REM using HRV parameters
Age p value
Parameters ≤57 ≥57
Mean RR 1467.8±203.22 970.68±103.94 0.294
STD RR 100.35±44.16 89.63±59.07 0.530
Mean HR 62.62±10.77 63.28±6.63 0.821
STD HR 7.32±5.59 6.81±5.02 0.770
RMSSD 81.95±63.48 82.11±90.76 0.995
NN50 43.36±24.66 32.84±30.98 0.254
pNN50 26.56±18.05 17.82±16.81 0.126
VLF peak(Hz) 0.0293±0.0593 0.0144±0.0785 0.285 LF peak(Hz) 0.062±0.028 0.058±0.032 0.731 HF peak(Hz) 0.251±0.050 0.286±0.052 0.045
LF/HF 2.32±2.14 2.85±5.04 0.622
<Table 4> Result of comparison of statistically main factor according to average age
≤ ≥
Parameters Average(STD) p value
STD RR 61.04±65.48 0.0002
Mean HR 963.5±168.7 0.0185
STD HR 61.04±65.4 0.0081
NN50 20.31±25.03 0.0421
RR trian 7.53±3.45 0.0005
LF peak 0.069±0.032 0.0073
HF peak 0.253±0.0053 0.0377
LF/HF 0.971±1.016 0.0040
VLF power(%) 38.05±21.83 0.0003
<Table 5> Results of statistical analysed of baseline and REM during sleep apnea
4. Discussions and Conclusions
HRV is a non-invasive measurement of the
autonomic nervous system with proven clinical value in diagnosing multiple diseases. The HRV indices were calculated in every 5-min interval of the patient’s recordings in order to look for significant differences between intervals in which apnea had occurred and intervals in which no apnea had occurred. There are studies that have addressed the relationship between HRV and OSA. Most of these studies are based on comparing OSA patients with normal ones, or comparing patients with distinct levels of OSA, with the goal of discriminating among them. Moreover, these papers are usually focused at analyzing the HRV behavior in a full-night ECG recording.
This paper presents the results of a double analysis of spectral parameters in 40 patients admitted to a hospital sleep unit. First, we have obtained the HRV spectral indices for all patients and we have analyzed the differences among OSA patients along the whole night. This study demonstrated that statistical significance of HRV parameters can be assessed according to various conditions such as AHI, NRM and REM. Patients with OSA have a decrease in the high frequency component of HRV and an increase in low frequency component. This pattern is thought to reflect decreased parasympathetic and increased sympathetic modulation of heart rate. In this paper, we are expected to help understand the mechanisms of sleep apnea and HRV by analyzing AHI, sleep stages and age-based statistical analysis.
REFERENCES
[1] S.N. Hong et al.,“ Upper Airway Evaluation in Patients with Obstructive Sleep Apnea”, Sleep Med. Res., Vol. 7, pp. 1-9, 2016.
[2] B. Ron et al,“The Use of Clinical Prtameters to Predict Obstructive Sleep Apnea Syndrome Severity in Children”, JAMA Otolaryngol Head Neck Surq. Vol. 141, pp. 130-136, 2015.
[3] V.K. Kapur et al.,“Clinical Practice Guideline for Diagnostic Testing for Adult OSA:An Americal Academy of Sleep Medicine Clinical Practice Guideline”,
Journal of Clinical Sleep Medicine, Vol. 13, pp. 479-504, 2017.
[4] C.F. Anamelia, H. Claudia and R. Rogerio,“ Sleep Apnea Clinical Score, Berlin Questionnaire or E pworth Sleepiness Scale:which is the best OSA predictor in patients with COPD?”, Int J Gen Med., Vol.8, pp.275-281, 2015.
[5] M.R. Risk, V. Bril, C. Broadbridge,“Heart rate variability measurement in diabetic neuropathy: review of methods.
Diabetes”, Technol Ther Vol.3, pp.63–76, 2001.
[6] American academy of sleep medcine task force.:
“Sleep-related breathing disorders in adults:
recommendations for syndrome definition and measurement techniques in clinical research”, Sleep, Vol.22, pp. 667–689, 1999.
[7] M.J. Ferreira, A. Zanesco,“Heart rate variability as important approach for assessment autinomic modulation”, Motriz, Rio Claro, Vol.22, pp.3-8, 2016 [8] M. Bootsma, C.A. Swenne, H.H. Van,“ Heart rate and
heart rate variability as indexes of sympathyovagal balance”, Am J Physiol., Vol.266, pp.H1565–H1571, 1994.
[9] A.L. Vinik, R.E. Maser, B. Mitchell,“ Diabetic autonomic neuropathy”, Diabetes Care, Vol.26, pp.1553–1579, 2003.
[10] M.H. Bonnet, D.L. Arand,“ Heart rate variability: sleep stage, time of night, and arousal influences”, Electroencephalogr Clin Neurophysiol., Vol.102, pp.390-396, 1997.
[11] C. Cajochen, J. Pischke, D. Aeschbach,“ Heart rate dynamics during human sleep”, Physiol. Behav., Vol.55, pp.769–774, 1994.
[12] J. Trinder, J. Kleiman, M. Carrington,“ Autonomic activity during human sleep as a function of time and sleep stage”, J Sleep Res., Vol.10, pp.253–264, 2001.
[13] “Heart rate variability: standards of measurement, physiological interpretation and clinical use. Task Force of the European Society of Cardiology and the North American Society of Pacing and Electrophysiology“, Circulation, Vol.93, pp.1043-1065, 1996.
[14] S. Akselrod, D. Gordon, F.A. Ubel,“ Power spectrum analysis of heart rate fluctuation: a quantitative probe of beat-to-beat cardiovascular control”, Science, Vol.213, pp.220-222, 1981.
[15] M. Pagani, F. Lombardi, S. Guzzetti,“ Power spectral analysis of heart rate and arterial pressure variabilities as a marker of sympatho-vagal interaction in man and conscious dog”, Circ. Res., Vol. 59, pp.178-193, 1986.
[16] J.N. Rottman, R.C. Steinman, P. Albrecht,“ Efficient estimation of the heart period power spectrum suitable
for physiologic or pharmacologic studies”, Am J Cardiol., Vol. 66, pp.1522, 1999.
[17] M.S. Kim, Y.C. Cho et al.,“Auto-detection of R Wave in ECG for Patch Type ECG Remote Monitoring System”, Biomedical Engineering Letters“, Vol.1, pp.180-187, 2011.