Using the Loss parameter calculation method for the CPV system simulation
Kang-Yeon Lee1, Byeong-Ho Jeong2*, Ji-won Kim3
1Dept. of Electricity, Chosun College of Science & Technology
2Division. of Automotive, Nambu University
3Dept. of Physical Therapy, Nambu University
손실파라미터계산방법을 이용한 집광형태양광발전시스템 시뮬레이션
이강연1, 정병호2*, 김지원3
1조선이공대학교 전기과, 2남부대학교 자동차공학부, 3남부대학교 물리치료학과
Abstract CPV system is composed with CPV cells, modules, PCS(power conditioning system), solar tracker, system installation and balance of systems(BOS). Mention about modelling method which is applied for CPV system simulation and evaluation system analysis. This paper focuses on CPV system modeling and optimal design of the electric energy production analysis through the development of proposed optimal CPV system simulation. Calculated simulation results of the generalized CPV system in regard to loss parameter calculation method can make out optimal configuration of CPV system with high reliability and stability. The loss parameter calculation method establish a mathematical modeling for the purposed of simulation and utilization various data for economical analysis of the CPV system design.
• Key Words : CPV system, CPV cell modeling, Loss parameter, simulation, Performance analysis
요 약 집광형태양광발전시스템은 집광형태양전지 셀, 모듈, PCS, 태양위치추적기, 시스템설비와 그에 따른 시
스템주변창치들로 구성된다. 이러한 다양한 요소를 반영하여 시스템모델링이 이루어져 집광형태양광발전시스템에 대한 분석과 모델링방법이 적용되어야 한다. 본 논문에서 제안된 이러한 다양한 요소를 반영하여 최적의 CPV 시 스템 시뮬레이션을 제안하여 집광형태양광발전시스템 모델링과 에너지의 발생분석에 대한 최적 설계가 이루어지 도록 모델링에 중점 두어 설계하였다. 손실 파라미터 계산 방법에 관한 일반화된 집광형태양광발전시스템의 계산 된 시뮬레이션 결과는 높은 신뢰성과 안정성을 갖는 집광형태양광발전시스템의 최적의 설계가 가능하다. 손실 파 라미터 계산 방법은 CPV 시스템 설계의 경제적 분석을 위한 시뮬레이션 및 다양한 데이터 활용을 위한 시뮬레이 션방법을 활용할 수 있다.
• 주제어 : 집광형태양광발전시스템, 집광형태양전지셀 모델링, 손실파라미터, 성능분석, 시뮬레이션
*Corresponding Author : 정병호([email protected])
Received June 9, 2017 Revised July 10, 2017 Accepted August 20, 2017 Published August 28, 2017
1. Introduction
The CPV systems is possible to increase cell efficiency in comparison with a conventional silicon material photovoltaic system in accordance with optical components which concentrate the sunray on multi-junction(MJ) solar cells for high efficiency convert energy. In previous study, CPV modules configurations have been worked out for application in exceed of 600[suns] across the world[1,2].
The high efficiency structure of MJ solar cells makes that highly attractive for effective designed terrestrial concentrator systems. Concentration is achieved by using mirrors or lenses to focus sunlight onto the small MJ solar cell surface. Most of tracking concentrator systems, focal optics are employed and as a result, a CPV module must be accurately aligned with the sun at all the time, since only the direct component of solar radiation can be used[3,4,5].
The primary advantages of CPV systems are their high efficiencies, the systems use less expensive silicon PV to achieve a specified electrical output. By concentrating the sun’s radiation through magnification, the intensity of solar radiation may be increased by several times or several hundred times of its standard output. MJ solar cell is a combination of various type of photovoltaic junctions overlap one another nanowire homo p-n junctions, As the CPV system industry growing, a lot of engineer and researcher are using simulators to routinely characterize CPV modules, implying a demand standard procedures to characterize CPV modules modeling both indoor and outdoor test.
Because of high concentration solar radiation, It’s difficult to indoor experiment test to realize system and accomplish test method and system design method[6,7,8]. The strategy for indoor CPV system measurement is not well founded, but may headed adjusting the simulator intensity based on outdoor measurement of the photocurrent produced by a solar irradiation for reference module[9,10,11].
Concentrating photovoltaic is used to describe systems that combine photovoltaic cells with an optical
component that concentrates light. The optical components, which are also called optical concentrators, are designed to harvest sunlight from a wide area and focus it directly onto a small area covered by PV cells.
This increases the intensity of the light reaching the PV cells, which in turn increases the amount of power the cells can produce[12,13].
In this paper highlights on the optimization simulation design of the electric energy production by CPV system and analysis through the development of proposed optimal CPV system. Calculated CPV system modeling results of the generalized CPV system in regard to loss parameter calculation method can make out optimal configuration of CPV system with high reliability and stability. The loss parameter calculation method adopts a mathematical modeling with a view to simulate and utilize various data for economical analysis of the optimal CPV system design.
2. Analysis of CPV system
2.1 CPV cell structure
Crystalline III-V compound MJ solar cells begin as raw wafers, from which individual layers of crystalline semiconductor are formed on a substrate, in a process known as epitaxial growth[14]. A typical triple junction cells structure comprises three p-n junctions made from GaInP(top junction, generally responsive in the range of 350-700[nm]), GaInAs(middle junction, responsive from 500-1000[nm]) and Ge(bottom junction, covering from 800-1800[nm]) monolithically stacked on top of each other[15,16]. They must be assembled in this exact order, so that the top junction, with the highest band-gap, it can collect shortest wavelengths light in the solar spectrum, which means that photons with energy lower than that band gap will pass to the lower junction[17].
Current balancing between substrate cells is also important for MJ CPV systems in the field. The spectral content of solar ray changes not only varying weather situation and solar conditions but also optical
system design. For instance, solar concentration systems using transmit lenses or reflect mirrors light completely at entire wavelength.
Consequently, CPV system modeling method should be performed designing many of system components for the average system configuration[18]. [Fig. 1]
shows mechanism of high efficiency CPV cells stack structure.
[Fig. 1] Mechanism of high efficiency CPV cell stack structure.
Advanced technology for the III-V compound MJ solar cells present state in close-packed array and point focus systems. The ability of a MJ solar cell formal to absorb light at each wavelength inside a limit specific spectral band with AR coating. Consequently, generating electric current can be described by its spectral response curve. Meanwhile, the external quantum efficiency, EQE present to relative ratio of absorbed photons that may produce electron-hole pairs.
It is a qualify of how many photons in specific spectral band produce minority charge carriers which are subsequently collected by the cells to form valuable current, hence already including the effect of optical losses e.g. transmission and reflection. EQE relates to SR by equation (1).
(1)
where is the Plank constant 6.625×10⁻³⁴[J⋅s],
is the speed of light in vacuum, is the elementary charge and is the wavelength. The EQE is inherent to the sunlight absorbing material performance index of CPV cells. The short circuit current density, of each substrate cell is determined by the quantum efficiency of the substrate cell, QE(λ), and by the spectrum of sunlight incident on that specific cell Φinc(λ).
∙ (2)
Short circuit current density, or only short circuit current() when the area of the cell is considered, is one of the most important parameters for photovoltaic evaluation in general, but specially for CPV cells, since studying provides a means to avoid the voltage temperature dependence.
[Fig. 2] Typical I-V characteristic for a solar cell, with relevant parameters assigned.
Derived another parameter that from an I-V curve is the fill factor, a measure of the × square of the I-V curve, which gives an insight into the cell quality, i.e. electrode interval, optimal composition of cell performance and so on. Most high quality III-V MJ concentrator cells have fill factor in the higher than 85%. If the intensity of the incident spectrum is known, the efficiency of the solar cell can also be determined through I-V characteristic curve analysis. Isc and Voc increase with concentration, as well as fill factor and system efficiency, but suffer a drop when certain levels are reached approximately 500[suns], at which series
resistance becomes dominant and recombination processes differ.
×
∙
(3)For using a concentration system, the electrical power produced by a single cell can be calculated from the equation below cell electrical power, .
∙ ∙ ∙ ∙ ∈∙ (4)
Where, ηC and ηopt are the cell efficiency and the optical effi-ciency. AC is the area in . is the direct irradiance per hour. f is the non-ideal tracking system factor and equal 0.9. The optical efficiency is depending on mirror type, shape, materials, focal length and etc. and its state of cleanliness. A high reflect mirror made of low-iron glass with a backside coated silver should provide a reflectivity of 90~94%. It can use a concentration ratio of a few hundred and optical efficiency ηopt equel to 0.85 typical values for parabolic concentrators. The cell efficiency varies with concentration magnification ratio C and cell surface temperature .
2.2 CPV module characteristics
CPV modules uses focus lenses and reflect mirrors to concentrate sunlight onto small area, to achieve highly efficient. In addition, CPV modules should be utilize solar trackers and cooling system to further increase their system efficiency. CPV is of most interest for power generation in sun belt with Direct Normal Irradiance, DNI values of more than 2,000W/m². Concentrating solar light device consist primarily of an optical element that can be a parabolic troughs dishes, fresnel lens, V-trough mirrors, luminescent glass, refractive prism or a compound parabolic concentrator. Other elements of the system include receiver and a heat dissipation system.
Concentrating the sunlight by a factor of between 300x to 500x onto a small cell area enables the use of highly efficient. Figure 4. shows the basic structure of refractive fresnel lens CPV module.
[Fig. 3] Basic structure of CPV module with refractive fresnel lens.
Designing of CPV module structure, the maximum slope changes in open circuit voltage at specific optical concentration magnification ratio, relative to the ideal gain at infinite concentration, and can be calculated as equation (5).
×
∙ (5)
where k is Boltzman’s constant, q is one electron charge, T is the operating temperature, I is operating current under one sun, x is the concentration magnification and is the band gap energy for silicon material, approximately 1.12[eV]. CPV module losses are caused by some unavoidable spaces among the cells by front contacts that shaded active area of cells and by voltage mismatch due to differences series connection. The electric power produced by the module can be obtained by ideal module electric power equation (6).
mod ∙ ∙ ∙ mod (6)
Where mod is the efficiency of module and fixed to 0.9 and NC is the cell number.
2.3 CPV array characteristics
Every CPV module is designed to be perfectly pointed at the sun for get the maximum power generation. But this alignment could not be perfect because the module is composed of small cells that get some misalignment during its assembling. This makes the maximum power vector of the module, to be the best compromise of the maximum pointing power points. Design of the CPV systems is available for on-grid and off-grid power generation for the renewable energy industry. Because raw materials for composite the BOS like metals, glasses, and building have enough margin for further cost down and other solution must be contemplated. [Fig. 4]. shows classify CPV system component for system design and simulation.
[Fig. 4] Classify CPV system component for system design and simulation.
For the purposes of checking the behavior of the experimental installation, the starting point is the definition of a reference scenario to confront with the real results. The final PV system yield, Yf is the net energy output E divided by the DC power of the installed PV array. The reference yield, Yr is the total effective in-plane irradiance H divided by the reference irradiance G of PV cell. The performance ratio, consist of 7 independent parameters, IAM factor loss, Irradiance level loss, Temperature loss, Module quality loss, Array mismatch loss, Ohmic wiring loss and Inverter operation loss, PR is the Yf divided by the Yr.
∙
∙
(7)
By normalizing with present irradiance, sunlight quantifies effect of losses on the rated output due to PCS losses, electric wiring resistance, series-parallel voltage mismatch, and other losses with power conversion from DC to AC. CPV module surface temperature incorrect use of irradiance by reflection from the CPV module front surface contaminated i.e.
soiling or snowing, it can be PR had a negative effect reported energy production on a monthly or yearly basis. It is possible to calculate the expected production of photovoltaic system during a given period. To do this we simply identify the type of expected losses, quantify and apply them to calculate a theoretical PR which is multiplied by the energy produced in ideal conditions (nominal), resulting in the following expression:
mod
(8)
[Fig. 5] CPV system simulation flow with various element.
Month Jan Feb Mar Apr May Jun Jul Aug Sep Oct Nov Dec Year
Daily
mean °C 0.6 2.5 7.0 13.2 18.3 22.4 25.6 26.2 21.9 15.8 9.1 3.1 13.8
Average precipitat ion[mm]
37.1 47.9 60.8 80.7 96.6 181.5 308.9 297.8 150.5 46.8 48.8 33.5 1,391
Average
RH[%] 67.7 65.2 62.9 61.9 66.4 72.8 80.0 78.1 74.3 68.4 68.1 68.8 69.5
M e a n monthly sunshine hours
159.9 164.6 192.0 213.0 222.8 169.2 145.4 172.6 172.3 205.2 163.6 155.9 2,136.
<Table. 1> Climate data for Gwangju (1981–2010) It is possible to calculate the expected production of photovoltaic system during a given period. To do this we simply identify the type of expected losses, quantify and apply them to calculate a theoretical PR. The details of process flows of the methodology are described [Fig. 5].
When predicting the output current of devices, it is of extreme importance to use the most accurate weather data, i.e. 1971~2000, 30 years weather data.
Spectro-radiometers measure spectral irradiance, but they are expensive instruments and due to their typically uncertainty of 5-10% they are not commonly employed. Besides, their use is not trivial, especially when outdoor solar spectra are to be measured continuously and reliable over several months.
2.4 Atmospheric data
If the air mass is calculated easily and with high accuracy as a function of the solar geometry, other variables such as turbidity and precipitable water are difficult to model and seldom measured. For this analysis, more recent values could have been used, although, as the concentration of pollutants is not only seasonal but dependent on weather parameters, such as wind speed and temperature, and socioeconomic aspects, such as the amount of car circulation and industrial production, the level of pollution at the site was evaluated taking data. Table. 1 present Climate data for Gwangju city, South korea, during 1981–2010, 30 years. Gwangju city Latitude and Longitude is 35.1595° N, 126.8526° E, respectively. In addition to, city
elecvation is 30[m] and UTC/GMT difference is +09:00.
[Fig. 6] and [Fig. 7] shows temperature and irradiation trend respectively for a day average from 1971 to 2000, 30 years in Gwanju city.
[Fig. 6] Temperature trend for a day average from 1971 to 2000, 30 years
[Fig. 7] Irradiation trend for a day average from 1971 to 2000, 30 years
However, on the other hand, no further importance was given to these gaseous concentrations, since ozone, nitrogen dioxide or site pressure have only a second-order impact on DNI. Consequently, their accuracy is of much less concern and has negligible impact on CPV efficiency.
2.5 Primary and Secondary optics
Most optical designs for the CPV system include both primary and secondary optics to increase solar tracking tolerance. The majority of first optics uses lenses rather than mirrors. However, several factors are still a challenge when designing the optics. For the secondary optics, which is exposed to great intensities, any absorption can cause large increases in temperature. Although the secondary optic device is
100% transparent, it may operate +50°C or more above ambient temperature. The geometric concentration is defined as the ratio of concentrator aperture area to MJ solar cell surface area. Considering the aperture area of the cells and the primary lenses area gives a ratio of 325~330[nm]. Although, as the secondary with good alignment focuses the light into a CPV cell square.
Finally, implementing adequate changes to equation (9) the expression used for the estimation of is below equation.
×
∙
××(9)
Where is the short-circuit current in [A], A the area of light focused on the cells, in [], the spectral response of each sub-cell, in [A/W], is the spectral irradiance model, in [W//nm], is the optical transmission functions respectively for the primary and secondary optics, is the geometric concentration ratio [%], optic the efficiency of the optics and the wavelength range of the spectral response.
2.6 Solar tracker
There are two methods commonly used to control solar trackers: 1)optical sensing and 2)calculated sun position. Optical sensing mechanisms only work if the skies are clear, and don’t perform well if the sensors become dirty. Solar tracker positional feedback is typically done through the use of encoders, limit switches, or inclinometer. Motor mounted encoders are typically most cost effective, but also introduce inaccuracies caused by the mechanical gears. For those systems, the gear slop can easily reach ±1 degree.
Another variable is the tracker platform itself, such as bearings or the ductility of the construction materials.
In this study, we considering high accuracy solar tracker performance and system cost.
3. Simulation Results
In this section, only measured values are used to compare the energy yield of CPV system, considering all the background discussed above. Following, the results of the power rating procedure with CPV system simulation, that was based on Excel Macro, supported by Windows system will also be present. The determining the energy yield of a module, it is interest to understand how this power output varies under weather data which means performing a power rating analysis, so that knowledge on the behaviour of the modules is acquired and further prediction is allowed.
The energy yield of the modules can be determined simply through the integration of the power-time curve, from the maximum power delivered by the modules. [Fig. 8] present the energy yield for November, January, April and June, as well as the yearly energy yield from 1971 to 2000, for all modules under study.
[Fig. 8] Irradiation trend for a day average from 1971 to 2000, 30 years
Before the spectrum is written into the text a file, the correction of the spectrum for the calibration of the spectrometer is internally applied, as well as a normalization of the integrated irradiance to DNI, which means that the correction for the filter and quartz window have to be applied at a later stage. Figure 10.
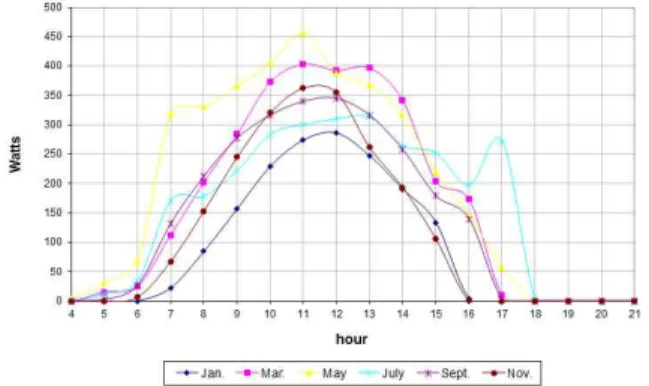
shows CPV array power output in each hour during a day in the adequate month with proposed CPV simulator, performing loss parameter method.
[Fig. 9] CPV array power output in each hour during a day in the adequate month
Figure 10. shows CPV array energy output per month in year average.
[Fig. 10] CPV array energy output per month in year average
Figure 11. shows CPV system net energy output per month in year average.
[Fig. 11] CPV system net energy output per month in year average
4. Conclusion
In this paper, simulation model of a CPV system which is analysised and established the real energy production of the CPV system. The experiment results
shows good linearity with respect to the 30 years long term weather data. This generally applicable characteristics allows the implementation of a model with a variable monthly performance ratio that estimate energy production at any location using weather data.
Proposed simulation calculates various loss parameters during the simulation, as shown in the losses diagram. This diagram appears at the end of each project design. Following is an overview of the loss parameters, calculated successively. This design must cover and think on all the possible sources of errors that could occur on a tracker and notice that is not needed only to track correctly the local vector of the sun, but also to take care about the size and deformations of the frame, which are a cause of a global drift of the local frame vector when pointing at the sun. A various parameter which is influenced CPV system energy production, and therefore loss parameters impacting the overall CPV system.
In summary, CPV system simulation should be taken into consideration with loss parameter calculation method when predicting energy production.
REFERENCES
[1] Kalogirou, S. A., “Solar Energy Engineering:
Processes and Systems”, 2nd ed.; Academic Press:
Millbrae, CA, USA, 2014.
[2] Jintaek Jeon, Daeseok Rho, Chanhyeok Kim, Yongpeel Wang, “The PV System Modeling Based on the PSCAD/EMTDC”, Journal of the Korea Convergence Society, Vol. 2, No. 3, pp. 15-23, 2011.
[3] Sarah Kurtz, Matthew Muller, Bill Marion, Keith Emery, Robert McConnell, Sandheep Surendran, Adrianne Kimber, “Considerations for How to Rate CPV”, ICCPV 6, Freiburg, Germany April 7-9, 2010.
[4] B. Marion, J. Adelstein,1 K. Boyle,1 H. Hayden, B.
Hammond, T. Fletcher, B. Canada, D. Narang, D.
Shugar, H. Wenger, A. Kimber, L. Mitchell, G. Rich, and T. Townsend, “Performance Parameters for Grid-Connected PV Systems”, Prepared for the 31st
IEEE Photovoltaics Specialists Conference and Exhibition Lake Buena Vista, Florida January 3-7, 2005.
[5] G. Kosmadakis, D. Manolakos, G. Papadakis,
“Simulation and economic analysis of a CPV/thermal system coupled with an organic Rankine cycle for increased power generation”, Solar Energy, Volume 85, Issue 2, pp. 308–324, 2011.
[6] Carlo Renno, and Michele De Giacomo, Dynamic
“Simulation of a CPV/T System Using the Finite Element Method, Energies”, 7(11), 7395-7414, 2014 [8] Francisco J. Gómez-Gil 1, Xiaoting Wang and Allen Barnett, “Analysis and Prediction of Energy Production in Concentrating Photovoltaic (CPV) Installations, Energies”, 5, 770-789, 2012.
[9] W Lawrance and A Schaub, “Promoting Grid Connected PV Systems in Western Australia, Promoting GCPV in WA, Solar: Life, the Universe and Renewables”, 2004.
[10] Fei-Lu Siaw and Kok-Keong Chong, “A Systematic Method of Interconnection Optimization for Dense-Array Concentrator Photovoltaic System”, The Scientific World Journal, Article ID 275169, Volume 2013.
[11] H. I. Abdelkader, A. Y. Hatata, A. Elansari, M. A.
Abo-Elsoud, “Modeling and Simulation of Hybrid Concentrated Photovoltaic/Thermal System”, International Journal of Scientific & Engineering Research, Volume 6, Issue 5, 2015.
[12] J. Olson, D. Friedman, and S. Kurtz,
“High-efficiency III-V multijunction solar cells”, Handbook of Photovoltaic Science and Engineering, 2003.
[13] G. Kinsey and K. Edmondson, “Spectral response and energy output of concentrator multijunction solar cells,” Progress in Photovoltaics Research and Applications, pp. 279–288, 2009.
[14] S. Kurtz, “Opportunities and challenges for development of a mature concentrating photovoltaic power industry”, NREL/TP-520-43208, pp. 8–11, 2009.
[15] B. H. Jeong, N. O. Kim, K. Y. Lee, “A Study on the Performance Analysis for the CPV Module Applying Sphericalness Lens”, TRANSACTION OF KIEE, Vol. 59P, 9, pp. 293-297, 2010.
[16] B. H. Jeong, K. Y. Lee , J. H. Park, E. A. Moon, S. H. Lee, D. G. Kim, “A Characteristics of the Applied SOG Lens for the CPV Module”, TRANSACTION OF KIEE P Vol. 61(2), 97-102, 2012.
[17] K. Y. Lee, B. H. Jeong, H. J. Kim, “Applied Spherical Lens with Reflect Mirror for the CPV module, Journal of the Korean Institute of IIIuminating and Electrical Installation Engineers”, 25(11), pp. 83~90, 2011.
[18] S. H. Lee, "Development of Smart PCS(Power Conditioning System) Integrating PV/ESS for Home", Journal of digital Convergence , Vol. 14, No.
7, pp. 193-200, 2016.
저자소개
정 병 호(Byeong-Ho Jeong) [정회원]
•1999년 8월 : 조선대학교 전기공 학과(공학석사)
•2006년 8월 : 조선대학교 전기공 학과(공학박사)
•2006년 9월 ~ 2009년 2월 : ㈜기 영미다스 선임연구원
•2009년 3월 ~ 현재 : 남부대학교 자동차공학부 교수
<관심분야> : 의공융합, 전력전자공학, 신재생에너지
김 지 원(Ji-won Kim) [정회원]
•2014년 2월 : 인제대학교 일반대 학원 물리치료학과(이학박사)
•2014년 4월 ~ 현재 : 남부대학교 물리치료학과 교수
<관심분야> : 운동역학, 의공융합, 운동치료
이 강 연(Kang-Yeon Lee) [정회원]
•1999년 2월 : 조선대학교 전기공 학과(공학석사)
•2005년 2월 : 조선대학교 전기공 학과(공학박사)
•2014년 3월 ~ 현재 : 조선이공대 학교 전기과 교수
<관심분야> : 신재생에너지, 전력전자, 자동화시스템