1. Introduction
A new problem arises in the ubiquitous environment where data collected in different environments should be used as learning data. First, if the data collected at location A has 3 attributes and the data collected at
location B has 4 attributes, then the problem of learning these data together is an example. The second is a rule refinement problem that must deal with the "rule + new learning data" type. In other words, new data is added to information in the form of a rule. And as data is collected from remote sensors, it is a problem that must
Application Examples Applying Extended Data Expression Technique to Classification Problems
Jong Chan Lee
Professor, Deptartment of Computer Engineering, ChungWoon University
패턴 분류 문제에 확장된 데이터 표현 기법을 적용한 응용 사례
이종찬
청운대학교 컴퓨터공학과 교수
Abstract The main goal of extended data expression is to develop a data structure suitable for common problems in ubiquitous environments. The greatest feature of this method is that the attribute values can be represented with probability. The next feature is that each event in the training data has a weight value that represents its importance.
After this data structure has been developed, an algorithm has been devised that can learn it. In the meantime, this algorithm has been applied to various problems in various fields to obtain good results. This paper first introduces the extended data expression technique, UChoo, and rule refinement method, which are the theoretical basis. Next, this paper introduces some examples of application areas such as rule refinement, missing data processing, BEWS problem, and ensemble system.
Key Words : Extended data expression, Classification, Learning, Rule refinement, Missing data
요 약 확장된 데이터 표현의 주요 목표는 유비쿼터스 환경에서 일반적인 문제에 적합한 데이터 구조를 개발하는 것이다.
이 방법의 가장 큰 특징은 속성 값을 확률로 표현할 수 있다는 것이다. 다음 특성은 훈련 데이터의 각 이벤트가 중요도를 나타내는 가중치 값을 갖도록 한다는 것이다. 데이터 구조가 개발된 후에 이를 학습할 수 있는 알고리즘이 고안된다. 그 동안 이 알고리즘은 여러 분야에서 여러 문제에 적용하여 좋은 결과를 산출해 왔다. 본 논문은 먼저 데이터 표현 기법인 UChoo를 소개하고 이론적인 배경이 되는 규칙 개선 문제를 소개한다. 그리고 규칙 개선, 손실 데이터 처리, BEWS 문제, 앙상블 시스템과 같은 응용 분야의 예를 소개한다.
주제어 : 확장된 데이터 표현, 분류, 학습, 규칙 개선, 손실 데이터
*This paper is sponsored by the academic research project of Chungwoon University in 2018. (No. 2018-51)
*Corresponding Author : Jong Chan Lee ([email protected]) Received October 5, 2018
Accepted December 20, 2018
Revised October 31, 2018 Published December 28, 2018
be learned with partially damaged loss data. However, no adequate method has been suggested to solve these problems. As a solution to this problem, a new learning data structure called extended data expression has been proposed, and UChoo, which is a modified version of this data structure to C4.5 [1], has been developed. In the meantime, UChoo [2-5] has been reported to produce very good results by applying it to various fields and application problems. This paper analyzes the algorithms, introduces the existing application fields, and tries to summarize the contents needed to deal with them incidentally.
A typical characteristic of the extended data expression is that the attribute values can be presented as a probability. For example, if the "headache"
attribute has 3 cardinalities such as {high, medium, low}, then the previous method should choose one of 3 values. And in the case of class, you also had to choose one of {Flu, Normal}. However, the new data structure allows for probability values such as {High = 20%, Medium = 30%, High = 50%} in the headache attribute and {Flu = 40% and Normal = 60%} in the class. The advantage of this method is that the "Normal" value in the case of the class is 20% higher than the "flu", so if you judge it to be "normal", the information that the probability of "flu" is 40% is lost. Therefore, it has the advantage of preserving small information when expressed as probability.
The second characteristic has a weight for each event in the training data. This weight can have a probability value or mean the number of samples. For example, if the weight of A event is 0.2 and the B event is 0.6, then A event is three times as important as B event. This is a significant role in the voting system with the results of several classifiers, such as the ensemble system.
2. Background 2.1 Extended Data Expression
Age Case History Phenomenon Class
50 Yes Low Observation
60 No Low Normality
50 No Middle Observation
70 No High Emergency
60 Yes Middle Emergency
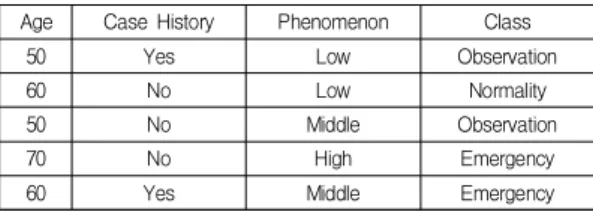
Table 1. An example of a simple training data set
Table 1 is an example data set collected for the prevention of sudden death. This table consists of one numerical attribute(“Age”), two nominal attributes(“Case History”, “Phenomenon”) and a class label. The difference between the numerical and normative attributes is whether or not there is an order in the constituent values. Among these attributes, "age"
refers to the age at which sudden death begins to occur. The "Case History" attribute is categorized as
"Yes" or "No" depending on whether a person has a genetic disease in your family or has had a similar illness in the past. Symptoms of suspected stroke include severe dizziness, sudden loss of vision, and confusion of consciousness. And sleep disorders, sleep apnea, and cardiac arrest are known to be directly related to sudden death. Therefore, the "Phenomenon"
attribute is classified as "High" regardless of other conditions if there is a single symptom. Stroke is known to be an important factor of sudden death. The causes of stroke are family history, hypertension, diabetes, smoking, drinking and obesity. The
"Phenomenon" attribute assigns a value of "Low(Lo)" if it has less than 2 elements, "Middle(Mid)" if it has 3 or 4 elements, and "High(Hi)" if it has more than 5 elements. Classes are classified as "Normality(Nor)",
"Observation(Obs)", and "Emergency(Eme)" depend -ing on the values of the attributes that make up each record.
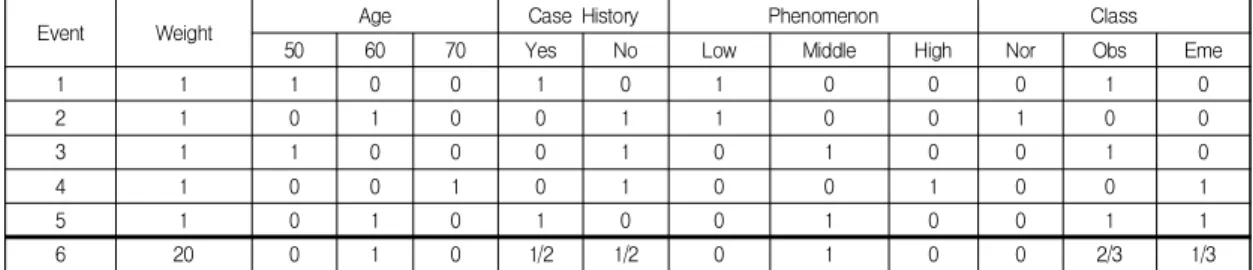
Table 2 shows the modified expression of the
training data set of Table 1. It simply put 0 and 1 into
the entry of the training data set in order to help
understanding on the data expression. More precisely,
it fills each entry with a probability value between 0
and 1. Using this method has the effect of saving some
of the uninformed information instead of excluding it from learning when some attribute values are corrupted. In addition, it is possible to combine data composed of different attributes in a ubiquitous environment. In particular, note the event 6 in Table 2.
First, the weight value of this event has 20. Here, the weight is a measure of how important this event is.
This means that it has 20 times more importance than other events with a weight value of 1. This allows the expert to intervene and act as a bias to use critical material for learning. Second, notice that the "Case History" attribute and class fill the entry with probability values. This is a way to preserve this event if the attribute value is corrupted. In addition, when learning is complete, a decision tree is created to form the rules. This method is needed when combining this rule with new learning data.
2.2 UChoo
UChoo[2-5] is a classification algorithm that modifies C4.5[1] to fit the format of the extended data representation method.
k(n) : the cardinality of the class(each attribute)
C i (r) : a value indicating the probability that the r th event belongs to C i . Where,
O Aj (r) : the probability that the attribute A has j in the r th event. Where,
T Aj : the event number whose attribute A has a value j in the total event T.
e(T) : the event number in the set T.
Weight(r,T) : the weight value of the r th event in the set T.
freq#(C i ,T) : the instance number in T whose class value is C i..
freq#(C i ,T Aj ) : the instance number in T Aj , whose class value is C i
|T Aj |: the instance number in the set T Aj .