Evaluation of Groundwater Quality in Northern Bangladesh for Irrigation, Drinking and Industrial Uses
Jahidul Mohammad Islam*··Nahida Laiju*··Tarek Nasirullah**·· Nuruddin Mohammad Miah***··Jeffrey S. Owen*··Bomchul Kim*
Department of Environmental Science, Kangwon National University, Chuncheon, Korea*
Department of Agricultural Chemistry and Biochemistry, Hajee Mohammad Danesh Science and Technology University, Dinajpur-5200, Bangladesh**
Sher-e Bangla Agricultural University, Dhaka-1207, Bangladesh***
(Manuscript received 18 February 2010; accepted 5 June 2010)
북부 방글라데시에서 관개, 음용 및 공업용수로 사용되는 지하수의 수질
자히둘 이슬람*·나히다 라이주*·타레크 나시룰라**·누루딘 미아***·제프리 오웬*·김범철*
강원대학교 자연과학대학 환경과학과*, 하지다네시 과학기술대학교**, 셰레방글라 농업대학교***
(2010년 2월 18일 접수, 2010년 6월 5일 승인)
Abstract
방그라데시 북부에 위치한 풀바리 우파질라 지역의 지하수에서 pH, EC, 주요 양이온 (Ca2+, Mg2+, Na+, K+, Zn2+, Cu2+, Mn2+, Fe3+, and As3+), 주요 음이온 (CO32-, HCO3-, NO3-, SO42-and Cl-) 그리고 total dissolved solids (TDS) 등의 용존물질 함량을 측정하였다. 또한 sodium adsorption ratio (SAR), soluble sodium percentage (SSP), residual sodium carbonate (RSC), 경도 등의 지표도 계산하였다. 전체적으로 지하수의 pH는 약알칼리성 (6.24 - 8.10)을 띄었으며, 주요 양이온은 Ca2+, Mg2+and Na+이었고, 주요 음이온은 HCO3-and Cl-으 로서 전형적인 담수의 이온조성을 보였다. Cu2+, Mn2+ and Fe3+ 의 최대 농도는 각각 1.71, 0.606, 0.125 mg/L 이었다. 방글라데시의 여러 지역에서는 비소에 의한 지하수의 오염이 흔히 나 타나고 있으나 이지역에서 비소의 최대농도가 0.41 mg/L로서 기준치인 0.05 mg/L 보다 낮은 오 염도를 보였다. TDS와 SAR, SSP 등으로 볼 때 이 지역의 지하수는 대부분 양호한 수질을 가지는 담수인 것으로 평가된다. As3+, Zn2+, Mn2+, Fe3+, SO42-, NO3-and Cl-등의 농도는 음용수로 적합한 수준이었으나 일부 항목은 특정 산업용도로는 부적합한 농도를 보였다. 현재로서는 이지역 의 지하수는 대부분 음용이 가능하고 일부 산업용에 대해서만 부적합성을 보였다. 그러나 앞으로 지 하수의 이용과 산업활동이 증가하면 방글라데시의 많은 다른 지역의 지하수에서 발생한 사례와 같 이 용존물질의 농도가 증가하여 물의 용도에 제한을 받게 될 우려가 있다.
주요어 : 방글라데시, 지하수, 수질, 전기전도도
Corresponding Author: Bomchul Kim, Department of Environmental Science, Kangwon National University, Chuncheon 200-701, Korea Tel: +82-33-250-8572 Fax: +82-33-251-3991 E-mail: bkim@kangwon.ac.kr
연구논문
I. Introduction
Water of desirable quality is essential for irri- gation, drinking and domestic uses, industrial uses, and functioning of both terrestrial and aquatic ecosystems. Water quality can also have a direct impact on crop production and soil prop- erties. The quality of irrigation water can affect crops in different ways, depending upon soil properties, underlying geology, irrigation type, the specific crop grown, and the farming meth- ods used. Although a large portion of irrigation water is used by plants or evaporates from the soil, a portion of the water is returned to the source. Depending on climatic regime, salts from the irrigation water can accumulate in soil pro- files and lead to soil dispersion and surface seal development during irrigation, thus decreasing the infiltration rate and amount (Agassi et al., 1981). Clay dispersion resulting in particle clog- ging within a soil column reduces the hydraulic conductivity (Felhendler et al., 1974).
Groundwater is a critical source of water for irrigation, domestic and industrial uses in some rural areas of Bangladesh. Presently the cultivat- ed land under irrigation with groundwater accounts for more than 70 % of the total irrigated area and contributes significantly to Bangladesh’s grain production (Rashid and Islam, 2007).
Phulbari Upazilla is a coal-mining area and the utilization of water from groundwater sources is gradually increasing for irrigation, domestic and industrial purposes. Yet few studies related to groundwater quality and irrigation practices are available for this region.
Some research in other regions has investigat- ed the effect of irrigation water quality on crop production or soil properties. For example, Baumhardt et al.(1992) reported that the infiltra-
tion rate of soil was influenced by the chemical properties of irrigation water. Studies in Bangladesh have (Rahman and Zaman, 1995;
Zaman and Majid, 1995; Quddus and Zaman, 1996) showed that HCO3-, Na+, Ca2+, Mg2+and Cl- were the dominant ions in groundwater col- lected from different regions. In modern agricul- ture, assessment of water quality is essential for a better understanding and management of groundwater resources and future irrigation prac- tices in Bangladesh. Better assessments of water quality are needed to prevent degradation of water and soil quality, in addition to human health concerns. Todd (1980) suggested that, among the many ions which might be considered important as related to groundwater quality, Cl-, Fe3+, SO42-, NO3-, Mn2+, pH, TDS and hardness are the important chemical constituemts to assess the suitability of water for industrial purposes (Todd, 1980). Therefore, the objective of the pre- sent research was to examine the concentrations of selected dissolved ions in groundwater and classify the waters according to their suitability for irrigation, drinking and industrial uses.
II. Materials and Methods
1. Location, climate and geological setting
The study area is located (25˚31′0.12″, 88˚52′
59.88″) in Phulbari Upazilla in the northern part of Bangladesh, and has an area of approximately 230 km2. Bangladesh has a tropical monsoon cli- mate characterized by heavy seasonal rainfall, high temperatures and high humidity. The aver- age rainfall during monsoon ranges from 1194 mm to 3454 mm.
The lithology of most northern region of Bangladesh, especially this study area, consists
predominantly of medium to coarse grained, poorly sorted sands and gravels with thin surface clays. A coal deposit in this Upazilla is one of the largest coal basins in Bangladesh. The coal-bear- ing sediments are comprised of Permian-age sandstones, silt stones, subordinate carbonaceous shales, and six coal seams (Islam and Hayashi, 2008). A previous UNDP study classified the groundwater aquifers of Bangladesh into three zones, namely the upper aquifer, main aquifer and deep aquifer (UNDP, 1982). We collected the water samples from the main aquifer. This is the main water bearing zone and occurs at depths ranging from less than 5 m in the northwest region of Bangladesh. This aquifer is either semi- confined or leaky, and consists of stratified inter- connected, unconfined water bearing zones. The aquifer is comprised of medium and coarse grained sediments, in places inter-bedded with gravel (UNDP, 1982). These sediments occur to depths of about 140 m below ground surface.
2. Collection of water sample and sampling techniques
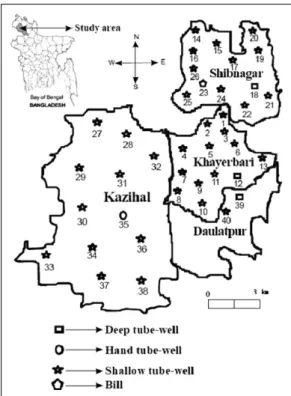
Well water samples were collected during February, March and April 2006 during the time period when groundwater levels are generally lower relative to other seasons of the year (Shamsudduha et al., 2009). Water samples were collected monthly from 35 shallow tube wells, 1 hand tube well, 1 shallow well and 3 deep tube wells (Figure 1). Samples were collected in two liter plastic bottles that had been cleaned with hydrochloric acid (1:1) and then rinsed with tap water followed by rinsing with distilled water.
Before collecting each sample, bottles were rinsed 3 to 4 times with sample. Samples were analyzed in Department of Agricultural Chemistry & Bio-
Chemistry, Hajee Mohammad Danesh Science and Technology University, Dinajpur.
3. Analytical procedures
In order to assess the suitability classes for irri- gation, domestic and industrial uses, we mea- sured pH, EC, TDS, Ca2+, Mg2+, Na+, K+, Zn2+, Cu2+, Mn2+, Fe3+, PO43-, As3+, CO32-, HCO3-, SO42-, NO3- and Cl-. The pH and electrical con- ductivity (EC) were determined electrometrically (APHA, 1998). TDS was estimated after Chopra and Kanwar (1980). Ca2+ and Mg2+ were ana- lyzed by complexometric titration (Page et al., 1982). K+and Na+were estimated by flame emis- sion spectrophotometry (Ghosh et al., 1983). SO42- was determined turbidimetrically (Wolf, 1982).
CO32- and HCO3- were analyzed titrimetrically (Chopra and Kanwar, 1980; Ghosh et al., 1983).
Figure 1. Map of the sampling sites of the Phulbari Upazilla under the District of Dinajpur along with the map of Bangladesh
Chloride was estimated by argentometric titration (APHA, 1998; Ghosh et al., 1983) and PO43- and NO3- were determined colorimetrically (APHA, 1998). Arsenic was determined by atomic absorp- tion spectrophotometer equipped with hydride generator (APHA, 1998). Zn2+, Cu2+, Mn2+and Fe3+ were analyzed by atomic absorption spec- trophotometry (APHA, 1998) in the Soil Science Division Laboratory, Bangladesh Agricultural Research Institute (BARI), Gazipur, Bangladesh.
A Perkin-Elmer Analyst 100 atomic absorption spectrophotometer equipped with a FIAS-100- flow injection hydride generation system was used for arsenic measurements. All samples for arsenic determination were pre-reduced with concentrated HCl (1 ml), 5 % KI and ascorbic acid mixture prior to hydride generation.
4. Equations used in calculating water class rating parameters
Whether groundwater is suitable for a particu- lar purpose depends on the criteria or standards of acceptable quality for that specific use. The fol- lowing formulae related to the irrigation water classes rating were used to classify water samples using the chemical data.
a) Sodium Adsorption Ratio (SAR) SAR =
b) Soluble Sodium Percentage (SSP) SSP =
c) Residual Sodium Carbonate (RSC) RSC = (CO32-+ HCO3-) _(Ca2++ Mg2+) d) Hardness or Total Hardness (HT)
HT= 2.5×Ca2++ 4.1×Mg2+
(Freeze and Cherry, 1979)
where concentrations of ionic constituents for
calculating all parameters are in meq/L except hardness (mg/L).
III. Results and Discussion
1. Chemical composition of water samples Details of the sampling sites are presented in Figure 1 and Table 1. Some summary results from our survey of groundwater are shown in Tables 2 and 3. The pH of the samples ranged from neutral to alkaline (pH ranged from 6.24 to 8.10; Table 2). The EC and TDS ranged from 209 to 1667 mS/cm and 107 to 1044 mg/L, respec- tively. The EC values were distinctly dissimilar among the samples. Ground water contain higher TDS due to appreciable amount of dissolved bicarbonate, chloride and sulfate compounds con- taining Ca2+, Mg2+, Na+and K+ (Karanth, 1994).
NO3- and SO42-concentrations were 0.10 to 1.22 mg/L and trace to 0.54 meq/L, respectively.
Concentrations of Na+and K+ranged from 0.13 to 9.00 meq/L and 0.10 to 1.50 meq/L, respec- tively. Potassium concentrations were generally lower than Na concentrations. Ca2+ and Mg2+
were major cations in groundwater and ranged from 0.70 to 5.30 meq/L and 0.95 to 4.60 meq/L, respectively. An appreciable amount of HCO3- was present in all water samples, though CO32- was negligible in most cases. The range for HCO3- were 0.64 to 5.61 meq/L while Cl- con- centrations ranged from 0.09 to 10.24 meq/L.
Fe3+and Mn2+ concentrations varied from trace to 0.125 mg/L and trace to 0.606 mg/L, respec- tively (Table 3). Arsenic concentrations ranged from trace to 0.041 mg/L. The computed vari- able, hardness, varied from 84 to 491 mg/L.
Soluble Na concentration (meq/L) Total cation concentration (meq/L)
Na+ [(Ca2++ Mg2+)/2]
Table 1. Information regarding of sampling sites of the Phulbari Upazilla under the District of Dinajpur, Bangladesh; location, well type, depth, and the duration of uses
Sample Sampling sites Depth Well type Duration
No. Location Union (Small of sink of uses
administrative unit) (m) (year)
1 Balupara Khayerbari 13.71 STW 2.5
2 Lakkhipur Khayerbari 27.43 STW 5
3 Fhakirpara Khayerbari 13.71 STW 0.4
4 Jailapara Khayerbari 18.28 STW 12
5 Napitpara Khayerbari 12.19 STW 1
6 Balupara Khayerbari 21.33 STW 6
7 Naldange Khayerbari 12.19 STW 1.5
8 Boiragipara Khayerbari 13.71 STW 4
9 Akhillahpara Khayerbari 25.9 STW 18
10 Phakirpara Khayerbari 13.71 STW 4
11 Muktarpur Khayerbari 29.14 STW 5
12 Khaarbari Khayerbari 69.62 DTW 1
13 Kasmatlalpur Khayerbari 18.28 STW 4
14 Rajarampur Sibnagar 19.81 STW 12
15 Sibnagar Sibnagar 19.81 STW 15
16 North Gopalpur Sibnagar 18.28 STW 7
17 Amdungirhat Sibnagar 10.66 STW 2
18 Ghatpara Sibnagar 60.48 DTW 5
19 South Gopalpur Sibnagar 21.33 STW 2
20 MiddleSibnagar Sibnagar 24.38 STW 3
21 Sibnagar Sibnagar 21.33 STW 4
22 Rajarampur Sibnagar 21.33 STW 8
23 Rajarampur Sibnagar 4.00 SW 5
24 Gopalpur Sibnagar 18.28 STW 4
25 Dangapara Sibnagar 16.76 STW 8
26 Samsernagar Sibnagar 18.28 STW 8
27 Rashidpur Kazihal 19.81 STW 1
28 Rasulpur Kazihal 18.28 STW 13
29 Ramchandrapur Kazihal 15.24 STW 20
30 Hajratpur Kazihal 20.3 STW 12
31 Amra Kazihal 18.28 STW 8
32 South Veram Kazihal 18.89 STW 4
33 Joyanty Kazihal 12.19 STW 15
34 Pukuri Kazihal 18.28 STW 3
35 Kakuldanga Kazihal 14.04 HTW 5
36 Pukuri Kazihal 18.28 STW 3
37 Dadul Kazihal 21.33 STW 22
38 Amra Kazihal 18.28 STW 4
39 Joynagar Daulatpur 85.34 DTW 20
40 Daulatpur Daulatpur 24.38 STW 10
STW=Shallow tube well, DTW= Deep tube well, SW= Shallow well, HTW= Hand tube well
Sample Sampling sites
Depth of sink Duration of uses
No. Location Union (Small (m) Well type
(year) administrative unit)
2. Factors controlling the composition of groundwater
Most groundwater samples in this study had Na:Cl ratio lower than unity, while a few had Na:Cl ratio equal to one (Figure 2). A ratio equal to one is sometimes attributed to dissolution of NaCl while a Na:Cl ratio greater than one might reflect release of Na+ from silicate weathering (Meyback, 1987). Among the anions, HCO3- and Cl- are often dominant anions in groundwater.
Precipitation of salts can cause a decline in the concentration of HCO3- and thereby anions in groundwater are dominated by Cl-. The precipi- tation of CaCO3might result in a decline in Ca2+
concentration, supporting our finding of higher concentrations of Na+ in groundwater. As a result, the ratio of Mg2+:Ca2+ was greater than unity in the groundwater showed in Figure 2 (e).
In the areas of increased clay-rich soil dispersed and where Na+ concentration is higher [20], the Mg2+concentration is relatively higher than that of Ca2+. The Na+ hazard can be greater, where the groundwater is dominated by Na+ + Mg2+
ions rather Na+ + Ca2+ions (Yousaf et al., 1987).
The higher concentrations of Na decrease the hydraulic conductivity of soil/weathered materi- als, thus reducing the drainage conditions. In this study, all the groundwater samples had a ratio of Ca2+:HCO3-+CO32- and Mg2+:HCO3-+CO32- greater than unity while the ratio of Na+:HCO3- +CO32- were approximately unity suggesting the predominance of Ca and Mg-containing minerals over Na-containing minerals in the study area.
As a result, the ratios of Ca2++Mg2+: total cations of most of the water samples had ratios approaching unity while the ratios of Na++K+: total cations were far below unity (Figure 2).
Because our study area has a higher rate of evapotranspiration characterized by tropical cli- mate and restricted fresh water exchange, salt layers may form near the evaporating surface (Karanth, 1994). On the other hand, human activ- ities in areas of groundwater withdrawal might lead to future changes in groundwater chemical composition. For instance, intensive and long- term irrigation can leach salts from the Table 2. pH, EC, TDS, hardness and anionic constituents of groundwater during the study period
pH EC TDS Hardness Cl- HCO3- SO4-2 NO3- PO43-
mS/cm mg/L mg/L meq/L meq/L meq/L mg/L mg/L
Min 6.24 209 107 84 0.09 0.640 Trace 0.10 Trace
Max 8.10 1667 1044 491 10.24 5.61 0.54 1.22 0.672
Mean 7.2 652 399 87 2.90 2.59 0.14 0.39 0.050
SD 0.48 402 63 42 2.87 1.27 0.13 0.28 0.110
Traces for sulfate and phosphate were considered <0.001meq/L and <0.001mg/L, respectively
pH EC TDS Hardness Cl- HCO3- SO4-2 NO3- PO43-
mS/cm mg/L mg/L meq/L meq/L meq/L mg/L mg/L
Table 3. Concentrations of cationic constituents of groundwater during the study period
Ca2+ Mg2+ Na+ K+ Cu2+ Zn2+ Mn2+ Fe3+ As5+
meq/L meq/L meq/L meq/L mg/L mg/L mg/L mg/L mg/L
Min 0.70 0.95 0.13 0.10 Trace Trace Trace Trace Trace
Max 5.30 4.60 9.00 1.50 1.710 0.464 0.606 0.125 0.041
Mean 1.72 2.43 1.78 0.53 0.050 0.010 0.090 0.010 0.035
SD 0.83 0.97 2.74 0.36 0.270 0.070 0.160 0.030 0.006
Traces for Fe, Zn, Cu, Mn and As were considered <0.01, <0.01, <0.01, <0.01 and <0.01 mg/L, respectively
Ca2+ Mg2+ Na+ K+ Cu2+ Zn2+ Mn2+ Fe3+ As5+
meq/L meq/L meq/L meq/L mg/L mg/L mg/L mg/L mg/L
soil/weathered rock zone, because of the avail- ability of water (Hem, 1991).
3. Suitability for irrigation based on pH, EC, SAR and SSP
Irrigation water quality can have a profound
impact on crop production. In this study, most of the samples were alkaline in nature as the pH values were above 7 which might be due to the presence of relatively significant amounts of Ca2+, Mg2+, Na+, CO32-and HCO3-(Michael, 1978; Rao et al., 1982). The major factors that influence the Figure 2. Ratios of the major anions and cations in groundwater from Phulbari Upazilla, Bangladesh
substrate solution pH during plant production: 1) pre-plant materials such as dolomitic limestone put into the substrate and substrate components themselves, 2) the alkalinity of the irrigation water, 3) the acidity / basicity of the fertilizers used during production, and 4) the plant species being grown. All the groundwater samples were suitable for irrigation according to the results for pH since the acceptable pH for agricultural use ranges from 6.0 to 8.5 (Ayers and Westcot, 1985).
We found significant variability in EC values, with the values ranging from 209 to 1667 mS/cm.
This result of EC was in close agreement in the groundwater of neighboring country Nepal reported by Chapagain et al. (2009). Higher EC values reflected higher concentrations of dis- solved constituents that may affect the irrigation water quality in relation to salinity hazard (Agarwal et al., 1982). Table 4 shows that out of 40 samples, 29 were rated as ‘good’, 7 were as
‘permissible’ and 4 were as ‘excellent’ for irriga- tion purposes based on Wilcox requirement (Wilcox, 1955). Salts can accumulate in the root zone by two processes; the upward movement of a shallow saline-water table and salts left in the soil due to insufficient leaching. According to Richards (1968), all irrigation waters were classi- fied as C2S1 with one C3S1 (sample no. 25) and one C4S1 (sample no. 3) categories. C1 indicated
‘low’ salinity (EC < 250 mS/cm), C2 indicated
‘medium’ salinity (EC=250-750 mS/cm), C3 indi- cated ‘high’ salinity (EC=750-2250 mS/cm), and C4indicated ‘very high’ salinity (EC >2250 mS/cm), and S1 indicated ‘low sodium’ with respect to SAR. Irrigation with C1 and C2 class waters is unlikely to affect the osmotic pressure of the soil solution and the cell sap of the crop plants. If water with a high salinity level is used
for a long period of time, the soil profile, espe- cially the root zone, might be affected by the accumulation of salts which would ultimately reduce crop yields. As the total concentration of salts increases into the saline sodic range, concen- trations of Ca2+are adequate for most plants and osmotic effects begin to predominate. However, some species are susceptible to salinity induced by Ca2+ deficiencies. Some cultivars of corn, sorghum, rice, wheat and barley exhibit a severe deficiency in Ca2+ at a high Na+/Ca2+ ratios (Grieve and Fujiyama, 1987). With respect to the SAR values, all the groundwater samples were classified as excellent (S1) for crop irrigation and would not be expected to negatively affect soil quality. Both a low salt content (low EC) and high SAR can mean there is a high potential for permeability or water infiltration problems. They can act separately or collectively to disperse soil aggregates, which in turn reduces the number of large pores in the soil. These large pores are responsible for aeration and drainage (Grattan, 2002). In this study, all groundwater samples were suitable based on SAR values (Table 4).
Soluble sodium percentage (SSP) is an impor- tant criterion for soil physical properties and can affect plant growth. Water with a SSP greater than 60 percent may result in accumulation of Na that will cause a breakdown in the soil physi- cal properties (http://agnewsarchive.tamu.edu/
drought/DRGHTPAK/SALINITY.HTM). Among the groundwater samples we collected, 30 were rated as ‘excellent’, 5 were rated as ‘good’, 3 were rated as ‘permissible’, and 1 was rated as
‘doubtful’ according to Wilcox (1955). Water belonging to the excellent, good and permissible categories may be used for irrigation purposes.
Doubtful waters are considered to be harmful
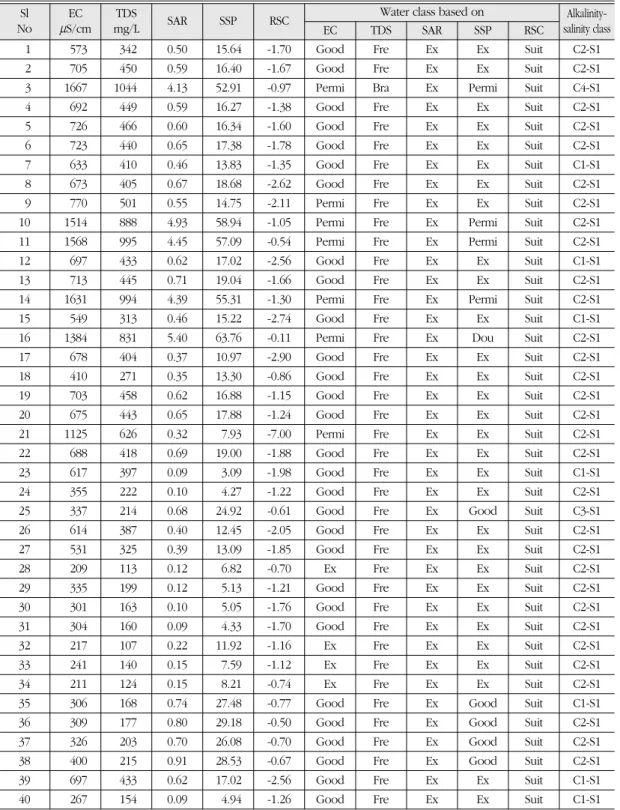
Table 4. Quality classification of water samples for irrigation
Sl EC TDS SAR SSP RSCWater class based on Alkalinity-
No mS/cm mg/L EC TDS SAR SSP RSC salinity class
1 573 342 0.50 15.64 -1.70 Good Fre Ex Ex Suit C2-S1
2 705 450 0.59 16.40 -1.67 Good Fre Ex Ex Suit C2-S1
3 1667 1044 4.13 52.91 -0.97 Permi Bra Ex Permi Suit C4-S1
4 692 449 0.59 16.27 -1.38 Good Fre Ex Ex Suit C2-S1
5 726 466 0.60 16.34 -1.60 Good Fre Ex Ex Suit C2-S1
6 723 440 0.65 17.38 -1.78 Good Fre Ex Ex Suit C2-S1
7 633 410 0.46 13.83 -1.35 Good Fre Ex Ex Suit C1-S1
8 673 405 0.67 18.68 -2.62 Good Fre Ex Ex Suit C2-S1
9 770 501 0.55 14.75 -2.11 Permi Fre Ex Ex Suit C2-S1
10 1514 888 4.93 58.94 -1.05 Permi Fre Ex Permi Suit C2-S1
11 1568 995 4.45 57.09 -0.54 Permi Fre Ex Permi Suit C2-S1
12 697 433 0.62 17.02 -2.56 Good Fre Ex Ex Suit C1-S1
13 713 445 0.71 19.04 -1.66 Good Fre Ex Ex Suit C2-S1
14 1631 994 4.39 55.31 -1.30 Permi Fre Ex Permi Suit C2-S1
15 549 313 0.46 15.22 -2.74 Good Fre Ex Ex Suit C1-S1
16 1384 831 5.40 63.76 -0.11 Permi Fre Ex Dou Suit C2-S1
17 678 404 0.37 10.97 -2.90 Good Fre Ex Ex Suit C2-S1
18 410 271 0.35 13.30 -0.86 Good Fre Ex Ex Suit C2-S1
19 703 458 0.62 16.88 -1.15 Good Fre Ex Ex Suit C2-S1
20 675 443 0.65 17.88 -1.24 Good Fre Ex Ex Suit C2-S1
21 1125 626 0.32 7.93 -7.00 Permi Fre Ex Ex Suit C2-S1
22 688 418 0.69 19.00 -1.88 Good Fre Ex Ex Suit C2-S1
23 617 397 0.09 3.09 -1.98 Good Fre Ex Ex Suit C1-S1
24 355 222 0.10 4.27 -1.22 Good Fre Ex Ex Suit C2-S1
25 337 214 0.68 24.92 -0.61 Good Fre Ex Good Suit C3-S1
26 614 387 0.40 12.45 -2.05 Good Fre Ex Ex Suit C2-S1
27 531 325 0.39 13.09 -1.85 Good Fre Ex Ex Suit C2-S1
28 209 113 0.12 6.82 -0.70 Ex Fre Ex Ex Suit C2-S1
29 335 199 0.12 5.13 -1.21 Good Fre Ex Ex Suit C2-S1
30 301 163 0.10 5.05 -1.76 Good Fre Ex Ex Suit C2-S1
31 304 160 0.09 4.33 -1.70 Good Fre Ex Ex Suit C2-S1
32 217 107 0.22 11.92 -1.16 Ex Fre Ex Ex Suit C2-S1
33 241 140 0.15 7.59 -1.12 Ex Fre Ex Ex Suit C2-S1
34 211 124 0.15 8.21 -0.74 Ex Fre Ex Ex Suit C2-S1
35 306 168 0.74 27.48 -0.77 Good Fre Ex Good Suit C1-S1
36 309 177 0.80 29.18 -0.50 Good Fre Ex Good Suit C2-S1
37 326 203 0.70 26.08 -0.70 Good Fre Ex Good Suit C2-S1
38 400 215 0.91 28.53 -0.67 Good Fre Ex Good Suit C2-S1
39 697 433 0.62 17.02 -2.56 Good Fre Ex Ex Suit C1-S1
40 267 154 0.09 4.94 -1.26 Good Fre Ex Ex Suit C1-S1
Ex = Excellent, Fre = Fresh, Dou = Doubtful, Suit = Suitable, Bra = Brackish, Permi = Permissible
Sl EC TDS
SAR SSP RSC Water class based on Alkalinity-
No mS/cm mg/L EC TDS SAR SSP RSC salinity class
and unsuitable for crop cultivation. Natural occurrence of Na enriched minerals in parent materials and geochemical processes during inter- action with groundwater may account for elevat- ed Na concentration. As a result, soils may undergo deterioration due to the accumulation of Na, resulting in crust formation and seal devel- opment on the soil surface over a long period of time. Sodium toxicity is often modified and reduced if Ca and Mg are also present (Clemson University, http://www.clemson.edu/agsrvlb/
IRRWAT.htm). Moderate amounts of Ca and Mg may reduce sodium damage and higher amounts even prevent it.
4. Suitability for irrigation based on TDS, RSC, HT, Cl-, NO3-and metals
The TDS values ranged from 107 to 1044 mg/L with an average value of 399 mg/L. All the waters except one were rated as ‘fresh’
according to the guidelines given in Freeze and Cherry (1979). In our study, almost all the water samples were suitable for growing crops (Table 4). The Residual sodium carbonate (RSC) is the most important criterion to examine the water quality as suggested by Eaton (1950). A negative RSC value indicates that the total concentration of CO32-and HCO3-is lower than the sum of the Ca2+ and Mg2+ concentrations, reflecting that there is no residual carbonate to react with Na+to increase the Na hazard in the soil. As for the RSC values, all the water samples were graded as ‘suitable’ and these waters may be used safely.
Sawyer and McCarty (1967) classified irrigation water into four categories on the basis of hard- ness (HT). In our study, according to this classifi- cation, 2 groundwater samples were classified as very hard (data not shown). Natural concentra-
tions of significant amounts of soluble Ca2+and Mg2+ might be the possible cause of very hard water. For the remaining samples, 26 samples were classified as hard and 12 samples were grouped as moderately hard waters these can be considered to be suitable for irrigation.
Chloride is not adsorbed by soils but moves readily with the soil water. It is taken up by the roots and moves upward to accumulate in the leaves. According to Ayers and Westcot (1985), the recommended concentration of chloride is 4.0 meq/L. Our results showed that chloride concen- tration ranged from 0.09 to 10.24 meq/L. In these samples 6 samples exceeded the above guideline and may threaten crop production which can produce the typical symptoms of leaf burn or drying of leaf tissues at the extreme leaf tip of older leaves and progress back along the edges as severity increases. Excessive leaf burn is often accompanied by abnormal early drop and defoli- ation. NO3--N concentrations in the groundwater samples ranged from 0.1 to 1.22 mg/L.
Production of N sensitive crops may be affected at N concentrations of above 5 mg/L. Sugar beets, for example, under excessive N fertiliza- tion, grow to a large size but with low purity and low sugar content and the amount of sugar produced per hectare may actually be reduced.
For many grasses and grain crops, lodging may result from excessive vegetative growth (Clemson University, http://www.clemson.edu/agsrvlb/
IRRWAT.htm). Our results showed that the groundwater NO3--N did not exceed the maxi- mum concentration 30 mg/L as because most crops are relatively unaffected until N exceeds 30 mg/L (http://www.fao.org/docrep/003/T0234E/
T0234E06.htm). Therefore, most crops can be irri- gated in this region without any N hazard.
Trace metals including Cu2+, Zn2+, Fe3+, As3+, Mn2+ were concentrations werelow and consid- ered to be suitable for crop production and the soil environment (Ayers and Westcot, 1985).
However, the average concentrations of Cu2+, Zn2+, Fe3+, As3+and Mn2+ were 0.05 mg/L, 0.01 mg/L, 0.01 mg/L, 0.035 mg/L and 0.09 mg/L, respectively.
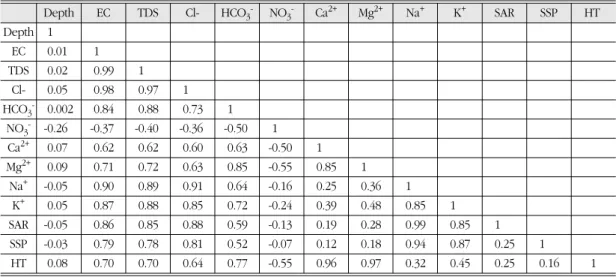
5. Correlations among the parameters with depth
There were few significant relationships among the measured concentrations with depth (Table 5). The high correlation between EC and TDS reflects the interdependency of these measure- ments as general measures of the amount of total dissolved solutes. The correlation between EC and TDS (r=0.99) is due to the fact that conduc- tivity depends on total dissolved solids. The non- significant positive correlation (r=0.25) observed between SSP and SAR indicates that sodium adsorption by soil particles may or will increase with the amount of soluble sodium but might not create an alkali hazard in soil and will not
hinder successful crop production. However, the relationship between EC and TDS indicates the increase of one element will or may increase the concentration of the other and synergistic behav- ior amongst the dissolved ions in water. The pos- itive relationship between EC and SAR (r=0.86) may indicate their common origin from geologi- cal sources the terrestrial watershed.
6. Suitability for drinking and domestic uses In our survey, the pH (range 6.24 to 8.10) of all groundwater samples was within the safe lim- its prescribed for drinking water by WHO (1984).
The recommended concentration of TDS is 500 mg/L (WHO, 1984) and 6 samples were above the recommended limit. Hard water leads to high incidence of urolithiosis (WHO, 1984), anen- cephaly, parental mortality, some types of cancer (Agarwal and Jagetia, 1997) and cardio-vascular disorders (Durvey et al., 1991). Such waters can develop scales in water heaters, distribution pipes and well pumps, boilers and cooking utensils, and require more soap for washing clothes (Todd, 1980; Karanth, 1994). In drinking water,
Table 5. Correlation matrix of different chemical constituents of groundwater with depth, n=40, units of each parameter are in Table 2 and Table 3
Depth EC TDS Cl- HCO3- NO3- Ca2+ Mg2+ Na+ K+ SAR SSP HT
Depth 1
EC 0.01 1
TDS 0.02 0.99 1
Cl- 0.05 0.98 0.97 1
HCO3- 0.002 0.84 0.88 0.73 1
NO3- -0.26 -0.37 -0.40 -0.36 -0.50 1
Ca2+ 0.07 0.62 0.62 0.60 0.63 -0.50 1
Mg2+ 0.09 0.71 0.72 0.63 0.85 -0.55 0.85 1
Na+ -0.05 0.90 0.89 0.91 0.64 -0.16 0.25 0.36 1
K+ 0.05 0.87 0.88 0.85 0.72 -0.24 0.39 0.48 0.85 1
SAR -0.05 0.86 0.85 0.88 0.59 -0.13 0.19 0.28 0.99 0.85 1
SSP -0.03 0.79 0.78 0.81 0.52 -0.07 0.12 0.18 0.94 0.87 0.25 1
HT 0.08 0.70 0.70 0.64 0.77 -0.55 0.96 0.97 0.32 0.45 0.25 0.16 1
Italic values are significant at p=0.05 where r ≥ 0.32
Depth EC TDS Cl- HCO3- NO3- Ca2+ Mg2+ Na+ K+ SAR SSP HT
excess concentration of some nutrients can cause health hazard. For example, the concentration of Na+ should not exceed 200 mg/L. A sodium- restricted diet is recommended to patients suffer- ing from hypertension or congenial heart diseases and also from kidney problems. For such people, extra intake of Na+ through drinking water may prove critical (Holden, 1971). Excess concentration of Cl- gives a salty taste and has a laxative effect in people not accustomed to it. Higher concentra- tion of SO42- in drinking water is associated with respiratory problems (Maiti, 1982; Subba Rao, 1993). Excess NO3- can cause methemoglobine- mia, gastric cancer, birth malformations and
hypertension. However, the concentrations of Na, Cl-, SO42- and NO3- of the studied groundwater samples were far below the recommended limits (Na+=200 mg/L, Cl-=250 mg/L, SO42-=150 mg/L, NO3-=10 mg/L) for drinking according to WHO (1984) and ISI (1983).
7. Industrial rating of groundwater samples based on Cl-, Fe3+, SO42-, NO3-, Mn2+, pH, TDS and hardness
Based on pH (6.24 to 8.10), these waters might not be suitable for brewing and laundering but could safely be used for tanning. For brewing, laundering and tanning, the recommended limits
Figure 3. Relative suitability of studied water samples for various industries based on a) TDS, b) hardness, c) chloride, and d) manganese concentrations. In X axis, the recommended concentrations for different industries are shown according to USEPA (1975)
of pH are 6.5-7.0, 6.0-6.8 and 6.0-8.0, respectively (Todd, 1980). The TDS concentrations ranged from 107 to 1044 mg/L. These concentrations were not found suitable for confectionery as the recommended limits of TDS for the above indus- try is 50-100 mg/L (USEPA, 1975). However, for brewing, carbonated beverage, dairy, ice manu- facture, and paper and pulp industries, the per- cent suitability were 15, 90, 82, 20 and 75, respec- tively (Fig. 3). Hardness was due to the sufficien- cy of divalent cations like Ca2+and Mg2+(Todd, 1980). As regards to hardness, all waters were unsuitable for textile and laundering while the suitability were for tanning (100 %), paper and pulp industries (20 %), carbonated beverage (32
%), dairy (37 %) and confectionery industries (100
%) in the studied samples. Based on chloride concentration, the percent suitability for brewing, carbonated beverage, dairy, sugar and textile industries were 30, 95, 27, 12 and 12. The allow- able limits of Mn for various industries range from 0.05 to 1.0 mg/L except for sugar manufac- ture (Todd, 1980). For sugar manufacture water should be free from Mn. The concentration of Fe in the present study ranged from trace to 0.125 mg/L and the groundwater sampled in this study may be suitable for nearly all industrial uses.
IV. Conclusion
Because irrigation is a primary use of ground- water in this region, irrigation return-flow could become a cause of groundwater pollution in this region. If salts accumulate on the surface in irri- gated fields, they can leach through the soil zone by recharge water and reach the water table.
Further, recycling of groundwater for irrigation can result in a progressive increase in soil and
groundwater salinity. Based on the patterns we observed, it can be concluded that all the shallow tube well and deep tube well water samples of the Phulbari Upazilla in the district of Dinajpur, Bangladesh were suitable for irrigation, drinking, domestic and industrial uses; although some samples were rated to be unsuitable for some specific industries for some specific ions. Our results illustrate the necessity of improving our knowledge of groundwater quality in the study area. Especially for drinking and industrial water use, continued monitoring of chemical and bacte- riological indicators of water quality is needed.
Acknowledgements
The authors gratefully acknowledge the Honorable Vice-Chancellor of the Hajee Mohammad Danesh Science and Technology University, Dinajpur-5200, Bangladesh for giving the financial support to this study. We express our sincere appreciation to the Director, Research and Training Division, Hajee Mohammad Danesh Science and Technology University, Dinajpur-5200, Bangladesh for providing some research equipment to conduct this research.
Special thanks are due to the Chairman, Department of Agricultural Chemistry and Biochemistry, Hajee Mohammad Danesh Science and Technology University, Bangladesh for con- ducting and supporting this research. And part of this study was supported by the Institute of Environmental Research at Kangwon National University, Korea.
References
Agarwal, R. R., J. S. P. Yadav and R. N. Gupta,
1982, Saline Soils of India, Indian Council of Agricultural Research, New Delhi.
Agrawal, V. and M. Jagetia, 1997, Hydrogeochemical assessment of groundwater quality in Udaipur City, Rajasthan, India, Proceedings of National Conference on Dimension of Environmental Stress in India, Department of Geology, MS University, Baroda, India.
Agassi, M., I. Shainberg and J. Morin, 1981, Effect of electrolyte concentration and soil sodic- ity on infiltration rate and crust formation.
Soil Sci. Soc. Am. J., 45, 848-861.
APHA (American Public Health Association), 1998, Standard Methods for the Examination of Water and Wastewater, 20th Edition, American Public Health Association, 1015 Fifteenth Street, NW, Washington, DC 20005-2605.
Ayers R. S. and D. W. Westcot, 1985, Water Quality for Agriculture, FAO Irrigation and Drainage Paper 29: 1-144.
Baumhardt, R. L., C. W. Wendt and J. Moore, 1992, Infiltration in response to water quality, tillage, and gypsum. Soil Sci. Soc.
Am. J., 56(1), 261-266.
Chapagain, S. K., S. Shrestha, T. Nakamura, V. P.
Pandey and F. Kazama, 2009, Arsenic occurrence in groundwater of Kathmandu Valley, Nepal. Desalination and Water Treatment, 4, 248-254.
Chopra, S. L. and J. S. Kanwar, 1980, Analytical Agricultural Chemistry, Kalyani Publishers, Ludhiana and New Delhi, pp. 168-307.
Durvey, V. S., L. L. Sharma, V. P. Saini and B. K.
Sharma, 1991, Handbook on the method- ology of water quality assessment, Rajasthan Agriculture University, India.
Eaton, F. M., 1950, Significance of carbonate in
irrigation waters. Soil Science, 69(2), 123- 133.
Felhendler, R., I. Shainberg and H. Frenkel, 1974, Dispersion and hydraulic conductivity of soils in mixed solution. Int. Congr. Soil Sci. Trans. 10th(Moscow), 1, 103-112.
Freeze, A. R. and J. A. Cherry, 1979, Groundwater, Prentice Hall Inc. Englewood Cliffs, New Jersey 07632, pp. 84-387.
Ghosh, A. B., J. C. Bajaj, R. Hasan and D. Singh, 1983, Soil and Water Testing Methods- A Laboratory Manual, Division of Soil Science and Agricultural Chemistry, IARI, New Delhi.
Grattan, S. R., 2002, Irrigation Water Salinity and Crop Production, University of California, Davis.
Guidelines for interpretation of water quality for irrigation. Agriculture Service Laboratory, Clemson University (http://www.clem- son.edu/agsrvlb/IRRWAT.htm).
Hem, J. D., 1991, Study and interpretation of the chemical characteristics of natural water, 3rded., Scientific Publishers, India.
Holden, W. S., 1971, Water treatment and exami- nation, J & Churchill Publishers, London.
Grieve C. M. and H. Fujiyama, 1987, The response of two rice cultivars to external N/Ca ratio. Plant and Soil, 103, 245-250.
Irrigation Water Quality Standards and Salinity Management (http://agnewsarchive.tamu.
edu/drought/DRGHTPAK/SALINITY.H TM)
ISI, 1983, Indian standard specification for drink- ing water, IS:10500, Indian Standard Institute, India.
Islam, M. R. and D. Hayashi, 2008, Geology and coal bed methane resource potential of the
Gondwana Barapukuria Coal Basin, Dinajpur, Bangladesh. International J. Coal Geology, 75, 127-143.
Karanth, K. R., 1994, Groundwater Assessment Development and Management, McGraw- Hill Publishing Co. Ltd., New Delhi.
Maiti, T. C., 1982, The dangerous acid rain. Sci.
Report, 19, 360-363.
Meyback, M., 1987, Global chemical weathering of surficial rocks estimated from river- associated loads. Am. J. Sci., 287(5), 401- 428.
Michael, A. M., 1978, Irrigation: Theory and Practice, Vikash Publishing House Pvt.
Ltd., New Delhi.
Miscellaneous problems (http://www.fao.org/
docrep/003/T0234E/T0234E06.htm).
Page, A. L., R. H. Miller and D. R. Keeney, 1982, Methods of Soil Analysis, Part-2, Chemical and Microbiological properties, 2nded., American Society of Agronomy, Inc., Soil Science Society of America, Inc.
Madison, Wisconsin, USA.
Quddus, K. G. and M. W. Zaman, 1996, Irrigation water quality in some selected villages of Meherpur in Bangladesh, Bangladesh J.
Agric. Sci., 23(2), 51-57.
Rahman, M. M. and M. W. Zaman, 1995, Quality assessment of river and groundwater for irrigation at Shahzadpur in Bangladesh.
Progress. Agric., 6(2), 89-96.
Rao, D. K. S., S. Panchaksharjah, B. N. Patil, A.
Narayan and D. L. S. Kaiker, 1982, Chemical composition of irrigation waters from selected parts of Bijapur district.
Karnataka. Mysore J. Agric. Sci., 16(4), 426-432.
Rashid, M. H. and M. S. Islam, 2007, Adaptation
to climate change for sustainable develop- ment of Bangladesh Agriculture. Paper for presentation in the 3rd session of Technical Committee of Asian and Pacific Center for Agricultural Engineering and Machinery (APCAEM) on November 20- 21, 2007, Beijing, China.
Richards, L. A. (ed.), 1968, Diagnosis and Improvement of Saline and Alkali Soils, Agricultural Handbook 60, USDA and IBH. Publishing Co. Ltd. New Delhi, India.
Sawyer, C. N. and P. L. McCarty, 1967, Chemistry of Sanitary Engineers, 2nded., McGraw Hill, New York.
Shamsudduha, M., R. E. Chandler, R. G. Taylor and K. M. Ahmed, 2009, Recent trends in groundwater levels in a highly seasonal hydrological system: the Ganges- Brahmaputra-Meghna Delta, Hydrology and Earth System Sciences Discussions, 6, 4125-4154.
Subba Rao, N., 1993, Environmental impact of industrial effluents in groundwater regions of Visakhapatnam Industrial Complex. Indian J. Geol., 65, 35-43.
Todd, D. K., 1980, Groundwater Hydrology, 2nded., John Wiley and Sons Inc., New York.
UNDP (United Nations Development Program), 1982, Groundwater Survey, The Hydrological Condition of Bangladesh, UNDP Technical Report DP/UN/BGD- 74-009/1.
USEPA (US Environmental Protection Agency), 1975, Federal Register 40: 59566-59588.
Wilcox, L. V., 1955, Classifications and uses of irri- gation water, United States Department of
Agriculture Circular No. 969, Washington DC.
WHO, 1984, Guidelines for drinking water quali- ty, World Health Organization, Geneva.
Wolf, B., 1982, A comprehensive system of leaf analysis and its use for diagnostic crop nutrients status. Communications of Soil Sci. and Plant Ana., 13(12), 1035-1059.
Yousaf, M., O. M. Ali and J. D. Rhoades, 1987, Dispersion of clay from some salt-affected, and land soil aggregates. Soil Sci. Soc.
Am. J., 51(4), 920-924.
Zaman, M. W. and M. A. Majid, 1995, Irrigation water quality of Madhupur in Bangladesh.
Progress. Agric., 6(2), 103-108.
최종원고채택 10. 06. 14