소나무잎을 PAS로 이용하여 지역별 대기 중 PCBs 농도 추정
천만영*
한경대학교 환경공학과
Estimation of Atmospheric PCBs Concentrations of Several Sites Using Pine Needles as Passive Air Sampler(PAS)
Man-Young Chun*
Department of Environmental Engineering, Hankyung National University, Anseong, Korea
ABSTRACT
Objective: This study was carried out in order to estimate atmospheric Polychlorinated Biphenyls (PCBs) concentrations using pine needles as a passive air sampler (PAS) in urban, semi-rural and rural regions.
Methods: One-year old pine needles were collected to analyze their PCBs concentrations (Cp, pg/g dry) at the end of December. PCBs concentrations in ambient air (Ca, pg/m3) were calculated with the logKoa-log(Cp/Ca) model.
Results: PCBs concentrations in ambient air (Ca) were high in the order of urban, semi-rural and rural regions.
The lower-chlorinated PCBs showed a higher concentration in ambient air. However, the distribution of PCBs congeners was similar in all three regions. Correlation between Ca and the population density of the three regions was significant (R2=0.9834, p<0.001).
Conclusions: It was concluded that although the production and use of PCBs was banned in the1970s, PCBs are currently being produced unintentionally by human activities.
Keywords: air, pine needles, PCBs, passive air sampler (PAS), logKoa-log (Cp/Ca) model
I. 서 론
Polychlorinated biphenyls (PCBs)와 다이옥신/퓨란 (polychlorinared dibenzo-p-dioxins/furans, PCDD/Fs) 등 잔류성 유기오염물질(persistent organic pollutants, POPs)는 반휘발성 유기화합물(semivolatile organic compounds, SOCs)로서 대기를 통하여 장거리 이동 되며 강우 시나 기온이 낮아지면 대기로 부터 식물, 토양, 수계에 건식 및 습식 침착되고 반대로 기온이 높아지면 이들 환경매체로부터 대기 중으로 휘발되 므로 대기 중 POPs 농도를 아는 것은 POPs의 환경 중에서의 순환을 이해하는데 매우 중요하다.1-4)
대기 중 POPs를 측정하기 위해서는 전통적으로 polyurethane foam (PUF) 시료채취기를 사용하여 시 료를 채취하는데, PUF 시료채취기는 고가이고 가동 시 전원이 필요하므로 여러 장소에서 동시에 대기시 료를 채취하여야 하거나 전원을 이용할 수 없는 지 역에서는 사용이 어렵다. 이러한 제약 때문에 자주 이용되는 것이 passive air sampler (PAS)이다.5-20)
지금까지 대기 중 POPs의 PAS로는 토양, 나뭇잎, 식물, 나무껍질, 이끼 등이 많이 이용되어 왔다.6-20) 그러나 상술한 PAS에 침착된 POPs 농도는 자외선, OH radical에 의한 분해, 풍속, PAS의 대기 중 노출 시간 등에 영향을 받기 때문에 PAS에 침착된 POPs
†Corresponding author: Department of Environmental Engineering, Hankyung National University, Tel : +82-31-670- 5172, Fax : +82-31-673-2704, E-mail : [email protected]
Received: 1 February 2013, Revised: 7 March 2013, Accepted: 25 March 2013
농도로 대기 중 POPs 농도를 추정하는 데에는 어려 움이 많았다.21-24)이러한 이유로 최근에는 보호용기 (shelter) 안에 XAD-2 resin, PUF 및 semipermeable membrane devices (SPMDs)를 넣어서 바람과 광분 해로 생기는 영향을 줄인 PAS를 개발하여 대기 중 POPs 농도를 추정하는데 이용하고 있다.5)그러나 이 러한 PAS 역시 제작단가가 비교적 높고 시료채취 전에 흡착제를 세척하고 밀봉하여 보관하여야 하며 시료채취를 위하여 시료채취기의 설치와 수거를 해 야 하는 등 번거로운 점이 많다. 그러나 PAS중 나 뭇잎은 보호용기의 제작이나 흡착제의 세척 같은 예 비단계가 필요 없고, 언제 어디서나 시료의 채취가 가능하여 매우 편리하고 경제적이다. 특히 다른 나 뭇잎에 비하여 소나무잎은 세계의 많은 지역에 자생 하고 있어 시료의 채취가 용이하고 다른 수종보다 잎의 상피(cuticle)에 지질(lipid)이 많아 친유성인 POPs의 침착이 쉽다.6) 또 다년생이이라서 대기 중 POPs가 잎에 누적 침착되므로 장기간의 대기 중 POPs 농도변화에 대한 정보를 얻을 수 있고, 상록 수이므로 겨울에도 시료 채취가 가능하여 나뭇잎 중 에서도 PAS로 가장 많이 이용된다.6-8,10,11,13,15)
나뭇잎을 비롯한 식물잎은 대기 중 POPs의 PAS 로 사용하기 위해서는 먼저 대기 중 POPs 농도가 식물에 침착되는 양에 대한 관계식이 구해져야 한다.
지금까지는 단기간 보호용기(shelter) 안에 식물을 넣 고 가스상 POPs의 농도를 변화시켜 가면서 POPs가 잎에 어떻게 침착되고 휘발되는지에 대한 연구가 많 이 이루어졌다.12,13) 그러나 모델에 대입하여야 할 POPs의 헨리상수(Henry's constant), 옥탄올-물 분배 계수(octanol-water partitioning coefficient, Kow), 옥 탄올-공기 분배계수(octanol-air partitioning coefficient, Koa), 공기-물 분배계수(air-water partitioning coefficient, Kaw), 잎 중 지질의 비율 등 변수들이 많은데 아직 Koa, Kow, Kaw등의 물리·화학적 값이 연구자에 따 라 차이가 다소 크며, 식물잎에 침착된 POPs는 대 기 중에서 자외선, OH radical 등에 의하여 감소가 일어나는데 이것을 정확하게 반영하지 못하여 만족 할만한 결과는 얻지 못하였다.21-24,26,27)
대기에서 식물잎으로 침착되는 POPs의 주경로는 건 식 가스상 침착이므로29)대기 중에서 POPs의 가스상 농도가 높을수록 대기 중 POPs 농도와 소나무잎 중 POPs 농도간 상관성은 높아진다.28,30,31) 그런데 대기
중에서 PCBs는 다른 POPs보다 가스상 분율이 높아28) 소나무잎은 PCBs의 PAS로서 사용 가능성이 높다. 천6) 은 소나무잎과 대기 중 PCBs 농도를 7개월 동안 동 시에 측정하고 각 PCBs의 LogKoa, 소나무잎 중 PCBs 농도(Cp, pg/g dry)와 대기 중 PCBs의 농도(Ca, pg/m3) 간의 대수비 Log(Cp/Ca) 사이에는 큰 상관성이 있음 을 확인하였다. 이 방법은 대기 중 PCBs 농도와 소 나무잎 중 PCBs 농도 간의 상관식을 구하였기 때문 에 상기의 복잡한 PCBs에 대한 물리ㆍ화학적 상수와 자외선, OH radical 등에 의한 감소율을 반영하지도 않아도 소나무잎을 PAS로 사용하여 비교적 정확하게 대기 중 PCBs 농도를 구할 수 있다.
본 연구는 도시지역, 도농복합지역 및 농촌지역에 서 소나무잎에 침착된 PCBs 농도를 분석하고 이 값 을 logKoa-log(Cp/Ca) 모델에 대입하여 각 지역의 대 기 중 PCBs 농도를 계산하였으며 그 결과를 이용 하여 지역별 PCBs 농도 특성을 규명한 것이다.
II. 재료 및 방법 1. 시약
정제용 내부표준물질(13C12 PCBs mixture, IUPAC No. 28, 52, 101, 138, 153, 180, catalog No. EC- 4058)은 Cambridge Isotope Laboratories, Inc., (Andover, MA, U.S.A.), 첨가용 내부표준물질(recovery surrogate standard; 4,4'-dibromooctafluorobiphenyl)는 Supelco (Bellefonte, PA, U.S.A.)에서 구매하여 사용하였고 용매인 dichloromethane (DCM) 및 n-hexane은 HPLC grade (J.T.Baker, Philipsburg, NJ, USA)를 사 용하였으며 n-hexane은 증류하여 사용하였다.
Na2SO4 (anhydrous granular, Shinyo Pure Chemical, Osaska, Japan), silica(SiO2, 70-230 mesh ASTM, Merck, Darmstadt, Germany)는 130oC의 오븐에 24 시간 이상 넣어 활성화시킨 후 사용하였다. GPC (gel permeation chromatography) 칼럼에 사용된 Bio-bead 는 Bio Rad사의 S-X3, 40-80 µm (Hercules, CA, USA)를 사용하였으며, 분석에 사용된 PCBs 검량선 작성용 표준용액(calibration standard)는 Cambridge Isotope Laboratories, Inc.,의 PCBs mixture (IUPAC No. 28, 52, 101, 138, 153, 180, catalog No. EC- 5179)를 사용하였다. 황산(H2SO4)은 유해금속측정용 (Matsuneon Chemicals, Osaka, Japan)을 사용하였다.
2. 시료채취
소나무잎은 도시지역(평택), 도농복합지역(안성), 농 촌지역(진천)에서 채취하였으며 시료채취 장소에 대 한 자세한 사항은 Table 2에 나타내었다. 소나무잎 시료는 주위 10 m 이내에서 자생하는 소나무 4-5 그 루에서 지상 1.5-1.8 m 높이의 통풍이 잘되는 곳에 서 자라는 1년생 잎만을 2012년 12월 말에 채취하 였다. 채취한 소나무잎은 n-hexane으로 세척한 알루 미늄 호일에 싸서 PE 지퍼 백에 넣어 밀봉한 다음 아이스박스에 담아 실험실로 운반한 후 분석 때까지 -20oC 냉동고에 보관하였다.
3. 추출 및 시료 건조
소나무잎은 골고루 혼합한 후 약 50 g을 시료로 사용하였으며 2개의 시료(duplicate)을 만들어 정제 용 내부표준물질을 주입한 후 속슬렛에서 n-hexane 으로 20-24 시간동안 추출하였다. 소나무잎의 습/건 시료 무게비는 습시료 약 10 g을 95oC에서 24시간 이상 건조시킨 후 전후 무게차이를 이용하여 계산하 였다.
4. 전처리
PCBs에 대한 전처리 및 분석은 여 등25)이 개발한 아래의 방법으로 분석하였다.
1) Acidic Silica 칼럼
속슬렛에서 추출한 추출액을 회전증발 농축기에서 약 2-3 mL까지 농축하였다. 시료는 내경 200 mm, 길이 300 mm인 유리 칼럼에 밑에서부터 acidic silica 20 g (H2SO4 30 w/w %), 중성 silica 10 g, 무수 Na2SO4 약 10 g을 차례로 넣고 n-hexane 500 mL로 세척한 후 농축한 시료를 넣고 n-hexane 500 mL로 용출시켜 방해물질을 제거하였다. 용출한 시료는 회 전증발농축기에서 약 1 mL까지 농축하였다.
2) GPC 칼럼
Acidic silica 칼럼만으로는 시료에 포함되어 있는 방 해물질을 충분히 제거할 수 없으므로 내경 20 mm, 길 이 220 mm 유리관에 bio-beads 12 g을 충전시킨 GPC 칼럼으로 다시 시료를 정제하였다. Acidic silica 칼럼으 로 용출한 용매를 n-hexane:DCM (1:1) 혼합용매 100 mL 로 세척한 GPC 칼럼에 넣고 n-hexane: DCM (1:1) 혼 합용매 90 mL로 용출시켰다. 용출액의 처음 34 mL에 는 방해물질이 포함되어 있으므로 버리고 나머지 56 mL 는 PCBs 분율(fraction)이므로 분석에 이용하였다.
5. 분석
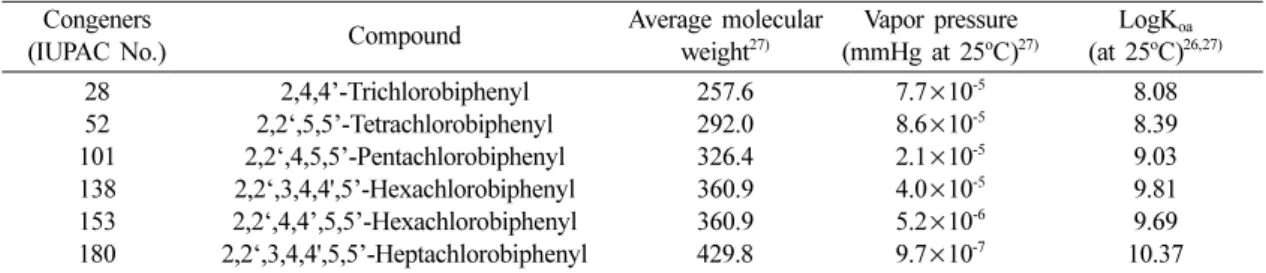
GPC 칼럼의 PCBs 분율을 회전증발 농축기에서 약 1-2 mL까지 농축한 다음 10 mL vial에 정량적으 Table 1. Physico-chemical properties of Selected PCB Congeners
Congeners
(IUPAC No.) Compound Average molecular
weight27)
Vapor pressure (mmHg at 25oC)27)
LogKoa (at 25oC)26,27) 28
52 101 138 153 180
2,4,4’-Trichlorobiphenyl 2,2‘,5,5’-Tetrachlorobiphenyl 2,2‘,4,5,5’-Pentachlorobiphenyl 2,2‘,3,4,4',5’-Hexachlorobiphenyl 2,2‘,4,4’,5,5’-Hexachlorobiphenyl 2,2‘,3,4,4',5,5’-Heptachlorobiphenyl
257.6 292.0 326.4 360.9 360.9 429.8
7.7×10⁻⁵ 8.6×10⁻⁵ 2.1×10⁻⁵ 4.0×10⁻⁵ 5.2×10⁻⁶ 9.7×10⁻⁷
8.08 8.39 9.03 9.81 9.69 10.37
Table 2. Characteristics of sampling sites
Sampling site City name Population Density of population (people/km2)
Geographic Coordinate
Urban Pyeongtaek 432,000 948 N 36o 59 35
E 127o 06 51
Semi-rural Anseong 185,000 334 N 37o 00 45
E 127o 15 50
Rural Jincheon 64,000 158 N 36o 56 06
E 127o 19 52
′ ″
′ ″
′ ″
′ ″
′ ″
′ ″
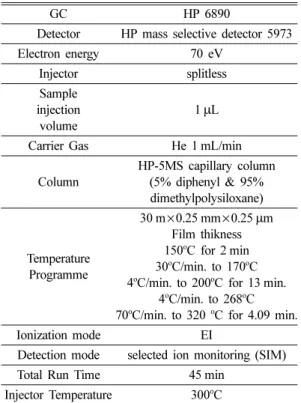
로 옮기고 첨가용 내부표준물질과 최종농축용매로 n-nonane 50 µL를 가한 후 전열판(hot plate) 위에서 질소로 천천히 약 50 µL까지 농축하여 GC-MSD로 분석하였는데, Table 3은 GC-MSD의 PCBs 분석조 건을 나타낸 것이다.
6. 정성 및 정량(QA/QC)
PCBs의 정량 시 크로마토그램의 높이가 노이즈의 3배 이상인 것만 정량에 포함시켰으며, 정제용 내부 표준물질로 사용된 6종의 13C12 PCBs를 이용하여 모 든 전처리 과정에 대한 회수율을 총 5회 평가한 결 과 회수율은 81.2-110.5%였으며, 분자량이 작을수록 회수율이 낮았다. 시료마다 두 개(duplicate)의 부시 료를 만들어 분석하였는데, 두 부시료 간 변이계수 (coefficient of variation, CV)는 평균 18.01% (1.92- 51.74%)였다.
III. 결 과
Table 4는 세 지역(도시지역, 도농복합지역, 농촌 지역)에서 채취한 소나무잎에 침착된 PCBs 농도(Cp, pg/g dry)를 나타낸 것이다. 소나무잎에 침착된 PCBs 농도(Cp,pg/g dry)는 도시지역(101.57 pg/g dry)>도 농복합지역(71.36 pg/g dry)>농촌지역(62.70 pg/g dry) 순으로 높았고, 저염소화(tri-tetra) PCBs 농도가 고 염소화(penta-hepta) PCBs 농도보다 더 높았다.
IV. 고 찰
PCBs는 친지질성(lipophilicity)이므로 대기 중의 PCBs는 소나무잎 상피에 존재하는 지질(lipid)에 침 착되는데 옥탄올[CH3(CH2)7OH]은 식물잎에 존재하 는 지질을 잘 모사한다.32,33) 그러므로 옥탄올-공기 Table 3. GC/MSD operating parameters for PCBs analysis
GC HP 6890
Detector HP mass selective detector 5973
Electron energy 70 eV
Injector splitless
Sample injection
volume
1µL
Carrier Gas He 1 mL/min
Column
HP-5MS capillary column (5% diphenyl & 95%
dimethylpolysiloxane)
Temperature Programme
30 m×0.25 mm×0.25 µm Film thikness 150oC for 2 min 30oC/min. to 170oC 4oC/min. to 200oC for 13 min.
4oC/min. to 268oC 70oC/min. to 320 oC for 4.09 min.
Ionization mode EI
Detection mode selected ion monitoring (SIM)
Total Run Time 45 min
Injector Temperature 300oC
Table 4. PCBs concentrations(pg/g dry) in pine needles at three sampling sites
Congener Urban(Pyeongtaek) Semi-rural(Anseong) Rural(Jincheon)
1 2 Mean C.V 1 2 Mean C.V 1 2 Mean C.V
28 52.36 58.65 55.51 8.01 42.58 40.28 41.43 3.93 31.06 35.32 33.19 9.08 52 26.43 23.87 25.15 7.20 17.58 18.98 18.28 5.42 12.65 16.58 14.62 19.01
101 9.56 10.28 9.92 5.13 4.32 5.98 5.15 22.79 8.58 9.58 9.08 7.79
138 3.12 4.98 4.05 32.47 2.01 1.58 1.80 16.94 2.35 2.95 2.65 16.01
153 5.80 5.96 5.88 1.92 4.65 3.25 3.95 25.06 3.25 2.25 2.75 25.71
180 1.23 0.89 1.06 22.68 0.98 0.52 0.75 43.37 0.56 0.26 0.41 51.74
Total 98.50 104.63 101.57 72.12 70.59 71.36 58.45 66.94 62.70
Min 1.92 3.93 7.79
Max 32.47 43.37 51.74
Mean 12.90 19.58 9.58
C.V : coefficient of variation(%)
분배계수(octanol-air partitioning coefficient, Koa)는 소나무잎에 침착된 PCBs 농도(Cp, pg/g dry)와 공기 중 PCBs 농도(Ca, pg/m3)의 비(Cp/Ca)와 큰 상관성을 가진다. 천6)은 소나무잎이 대기 중에 노출되어 있는 기간과 동일한 기간 동안 대기 중 PCBs 농도를 측 정하여 PCBs 옥탄올-공기 분배계수의 대수값(logKoa) 과 Cp/Ca의 대수값[log(Cp/Ca)] 사이의 관계를 구한 결과 식 (1)과 같이 두 값 사이에는 큰 상관성이 있 다는 것을 알았다.
log(Cp/Ca) =
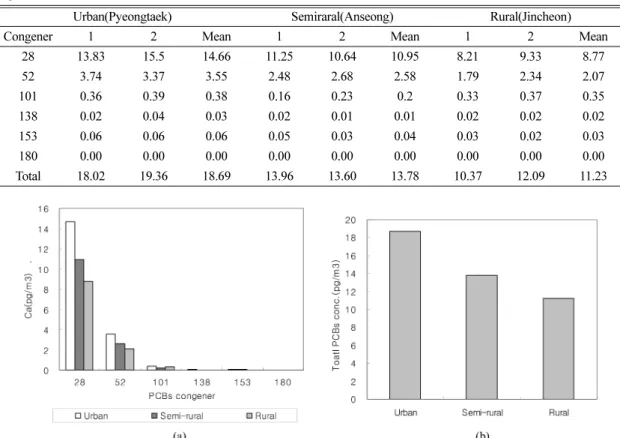
LogKoa − 6.5875 (R2 = 0.8651, P<0.001) (1) 식 (1)을 이용하여 소나무잎에 침착된 PCBs 농도 (Cp)로 계산한 대기 중 PCBs 농도(Ca)는 Table 5 및 Fig. 1과 같다. Table 5와 Fig. 1에서 보인 대기 중
PCBs 농도(Ca)는 6월에서 12월 말까지 각 지역의 대기 중 PCBs의 평균농도를 나타낸 것으로 도시지 역>도농복합지역>농촌지역 순으로 농도가 높았다.
또 모든 지역에서 또 저염소화 PCBs(분자량이 적은 ) 농도는 높고 저염소화 PCBs(분자량이 큰) 농도는 낮았다. 그러나 모든 지역에서 대기 중 PCBs congener 분포는 모두 비슷하였다. 이것은 Table 1에 나타낸 것과 같이 분자량이 적은 PCBs는 휘발성이 커서 대 기 중에 많이 존재하기 때문으로 생각되며, 세 지역 모두 비슷한 PCBs 발생원을 가지고 있기 때문으로 판단된다.27)
Fig. 2는 세 지역의 대기 중 PCBs 총농도(pg/m3) 와 인구밀도(명/km2) 간의 상관성을 나타낸 것으로 인구밀도가 높을수록 대기 중 PCBs 농도가 높았다.
PCBs는 1970년대 초반 이후부터 생산과 사용이 엄 격히 제한되고 있다.27) 그러므로 지금도 PCBs는 인 Table 5. Calculated PCBs concentrations(pg/m3) in ambient air using LogKoa-Log(Cp/Ca) model at three sampling regions
Urban(Pyeongtaek) Semiraral(Anseong) Rural(Jincheon)
Congener 1 2 Mean 1 2 Mean 1 2 Mean
28 13.83 15.5 14.66 11.25 10.64 10.95 8.21 9.33 8.77
52 3.74 3.37 3.55 2.48 2.68 2.58 1.79 2.34 2.07
101 0.36 0.39 0.38 0.16 0.23 0.2 0.33 0.37 0.35
138 0.02 0.04 0.03 0.02 0.01 0.01 0.02 0.02 0.02
153 0.06 0.06 0.06 0.05 0.03 0.04 0.03 0.02 0.03
180 0.00 0.00 0.00 0.00 0.00 0.00 0.00 0.00 0.00
Total 18.02 19.36 18.69 13.96 13.60 13.78 10.37 12.09 11.23
Fig. 1. PCBs concentrations in ambient air (Ca) at three sampling sites (a) spatial distribution of congener (b) total PCBs concentrations.
간활동에 의하여 비의도적으로 계속 발생되고 있다 는 것을 알 수 있다.27)
위에서 살펴 본 바와 같이 소나무잎에 침착된 PCBs 농도와 LogKoa - Log(Cp/Ca) 모델를 이용하면 각 지 역의 대기 중 PCBs 평균농도를 계산할 수 있다. 소 나무잎은 우리나라 어디에서나 쉽게 채취가 가능하 므로 앞으로 소나무잎을 대기 중 PCBs의 PAS로 아 주 요긴하게 사용할 수 있다.
V. 결 론
이 연구는 도시지역(평택), 도농복합지역(안성), 농 촌지역(진천)에서 채취한 소나무잎을 passive air sampler (PAS)로 이용하여 소나무잎에 침착된 PCBs 농도로 대기 중 PCBs 농도를 계산하고 지역별 특 징을 규명한 것이다.
소나무잎에 침착된 PCBs 농도(Cp,pg/g dry)는 도 시지역(101.57 pg/g dry)>도농복합지역(71.36 pg/g dry)>농촌지역(62.70 pg/g dry) 순으로 높았고, 저염 소화(tri-tetra) PCBs 농도가 고염소화(penta-hepta) PCBs 농도보다 더 높았다. 대기 중 PCBs 농도 역 시 도시지역(18.69 pg/m3)>도농복합지역(13.78 pg/m3)
>농촌지역(11.23 pg/m3) 순으로 높았고 모든 지역에 서 저염소화(tri-tetra) PCBs 농도는 높고 고염소화 (penta-hepta) PCBs 농도는 낮았다. 그러나 PCBs congener의 분포는 모든 지역에서 비슷하였다. 세 지
역의 대기 중 PCBs 농도와 인구밀도간 상관성 (R2=0.9834, p<0.001)이 커서 1970년 대 초반부터 이미 PCBs의 생산과 사용은 금지되었지만 아직도 PCBs는 비의도적인 인간활동과 관련되어 생성되는 물질임을 알 수 있었다.
참고문헌
1. Eitzer BD, Hites RA. Atmospheric transport and deposition of Polychlorinated Dibenzo-p-dioxins and Dibenzofurans. Environ Sci Technol. 1989;
23(11): 1396-1401.
2. Gareth T, Sweetman AJ, Ockenden WA, Mackay D, Jones KC. Air-pasture transfer of PCBs. Environ Sci Technol. 1998; 32(7): 936-942.
3. Bacci E, Cerejeira MJ, Gaggi C, Chemello G, Calamari D, Vighi M. Chlorinated dioxins : volatil- lization from soils and bioconcentration in leaves.
Bull Environ Contam Toxicol. 1992; 48(3): 401-408.
4. Gouin T, Mackay D, Jones KC, Harner T, Meijer SN. Evidence for “grasshoper” effect and fraction- ation during long-range atmospheric transport of organic contaminants. Environmental pollution 2004;
128: 139-148.
5. Shoeib M, Harner T. Characterization and compar- ison of three passive samplers for persistent organic pollutants. Environ Sci Technol. 2002; 36(19): 4142- 4151.
6. Chun MY. Estimation of PCBs concentrations in ambient air using pine needles as a passive air sam- pler (PAS) J. Environ Health Sci. 2012; 38(4): 360- 368.
7. Shim IY, Yeo HG, Choi MK, Kim TW, Chun MY.
Spartial distribution of PCBs pine needles. J. of Korean Society of Environmental Engineering.
2002; 24(12): 2227-2237.
8. Aboal JR, Fernandez JA, Carballeira A. Sampling optimization, at site scale, in contamination moni- toring with moss, pine and oak. Environmental Pol- lution. 2001; 115(2), 313-316.
9. Meredith M, Hites RA. Polychlorinated biphenyl accumulation in tree bark and wood growth rings.
Environ Sci Technol. 1987; 21(7): 709-712.
10. Yeo HG, Cho KC, Choi MK, Chun MY, Kim TW.
Deposition characteristics of atmospheric PCBs depending on exposure periods using pine needles.
Journal of Korean Society of Environmental Engi- neering. 2006; 28(8): 836-842.
11. Guardo AD, Zaccara S, Cerabolini B, Acciarri M, Fig. 2. Relationship between total PCBs concentrations in
ambient air (Ca, pg/m3) and populations density.
Terzaghi G, Calamari D. Conifer needles as passive biomonitors of the spartial and temporal distribu- tion of DDT from a point source. Chemosphere.
2003; 52(5): 789-797.
12. Bacci E, Calamari D, Gaggi C, Vighi M. Biocon- centration of organic chemical vapors in plant leaves: experimental measurements and correlation.
Environ Sci Technol. 1990; 24(6): 885-889.
13. Hauk H, Umlauf G, McLachlan MS. Uptake of gas- eous DDE in spruce needles. Environ Sci Technol.
1994; 28(13): 2372-2379.
14. Sinkkonen S, Paasivirta J. Degradation half-life times of PCDDs, PCDFs and PCBs for environ- mental fate modeling. Chemosphere, 2000; 40: 943- 949.
15. Chun MY, TW Kim. Comparison of regional differ- ences of PCBs concentration using pine needles and soil. J. Environ Toxicol. 2009; 24(3), 251-259.
16. Lim. TB, Xu R, Tan B, Obbard JP. Persistent organic pollutants in moss as bioindicators of atmo- spheric pollution in Singapore. Chemosphere, 2006;
64: 596-602.
17. Wen S, Yang F, Li JG, Gong Y, Zhang XL, Hui Y, et al. Polychlorinated dibenzo-p-dioxin and diben- zofurans (PCDD/Fs) polychlorinated diphenyl ethers (PBDEs), and polychlorinated biphenyls (PCBs) monitored by tree bark in an e-waste recycling area.
Chemosphere, 2009; 74: 981-987.
18. Guegen F, Stille P, Millet M. Air quality assess- ment by tree bark biomonitoring in urban, indus- trial and rural environments of Rhine valley : PCDD/Fs, PCBs and trace metal evidence. Chemo- sphere, 2011; 85: 195-202.
19. Hermanson MH, Johnson GW. Polychlorinated biphenyls in tree bark near a former manufacturing plant in Anniston Alabama. Chemosphere, 2011;
68: 191-198.
20. Tremolada P, Burnett V, Calamari D, Jones KC. A study of the spatial distribution of PCBs in the UK atmosphere using pine needles. Chemosphere. 1996;
32: 2189-2203.
21. Xue LI, Lei F, Jun H, Gang YU. Photolysis of mono- through deca-chlorinated biphenyls by ultra- violet irradiation in n-hexane and quantitative struc- ture-property relationship analysis. Journal of Environmental Sciences. 2008; 20: 753-759.
22. Chang FC, Chiu TC, Yen JH, Wang YS. Dechlori- nation pathways of ortho-substituted PCBs by UV irradiation in n-hexane and their correlation to the charge distribution on carbon atom. Chemosphere, 2003; 51: 775-784.
23. Miao XS, Chu SG, Xu XB. Degradation pathways of PCBs upon UV irratation in hexane. Chemo- sphere. 1999; 39(10), 1639-1650.
24. Totten LA, Eisenreich SJ, Brunciak PA. Evidence for destruction of PCBs by the OH radical in urban atmospheres. Chemosphere. 2002; 47: 735-746.
25. Yeo HG, Choi MK, Chun MY, Kim TW, Sunwoo Y.
Estimation of bio-monitering for PCBs concentra- tion in air using plant. Journal of Korean Society for Atmospheric Environment. 2002; 18(4): 265- 274.
26. Mackay M, Shiu WY, Ma KC. Illustrated hand- book of physical-chemical properies and environ- mental fate for organic chemicals, Vol. I. Chelsea:
Lewis publishers, Inc.; 1992. p.324-644.
27. Erickson MD. Analytical chemistry of PCBs, 1st ed.
Boston: Lewis Publishers; 1992. p.1-51.
28. Yeo HG, Choi MK, Chun MY, Kim TW, Sunwoo Y.
Temperature dependence of PCBs in urban area of Seoul city. Journal of Korean Society for Atmo- spheric Environment. 2002; 18(3): 193-204.
29. Pausch KW, McLachlan MS, Umlauf G. Determina- tion of the principal pathways of polychlorinated dibenzo-p-dioxins and dibenzofurans to Lolium multiflorum(Rye grass). Environ Sci Technol. 1995;
29(4): 1090-1098.
30. Yeo HG, Choi MK, Chun MY, Sunwoo Y. Air-soil partitioning of PCBs in rural area. Journal of Korean Society for Atmospheric Environment. 2003;
19(E1): 1-9.
31. Chun MY. Characteristics of PCDD/Fs deposited on pine needles. Journal of Korean Society of Environ- mental Engineering. 2005; 27(6): 599-605.
32. Falconer RL, Bidleman TF. Vapor pressures and predicted particle/gas distributions of polychlori- nated biphenyl congeners as functions of tempera- ture and ortho-chlorine substitution. Atmosph Environ.
1994; 28(3), 547-554.
33. Harner T, Bidleman TF. Measurement of octanol-air partition coefficients for polychlorinated biphenyls.
J. Chem. Eng. Data. 1996; 41, 895-899.