• 검색 결과가 없습니다.

The Relationship Between Debt Literacy and Peer-To-Peer Lending: A Case Study in Indonesia

N/A
N/A
Protected

Academic year: 2021

Share "The Relationship Between Debt Literacy and Peer-To-Peer Lending: A Case Study in Indonesia"

Copied!
9
0
0

로드 중.... (전체 텍스트 보기)

전체 글

(1)

Print ISSN: 2288-4637 / Online ISSN 2288-4645 doi:10.13106/jafeb.2021.vol8.no5.0403

The Relationship Between Debt Literacy and Peer-To-Peer Lending: A Case Study in Indonesia*

Taofik HIDAJAT

1

Received: December 20, 2020 Revised: March 07, 2021 Accepted: April 01, 2021

Abstract

This paper discusses the relationship between debt literacy, peer-to-peer lending, and over-indebtedness in Indonesia. It is essential because the number of loans on this platform continues to increase, both legal and illegal. Data was collected online in collaboration with commercial market research firms, JajakPendapat.net. Debt literacy and over-indebtedness were measured by self-assessment with questions from Lusardi and Tufano (2009a). Questions for debt literacy are about interest compounding, debt interest, and the application of time value of money in payment options. The question for over-indebtedness is about the amount of debt and the conditions resulting from that debt.

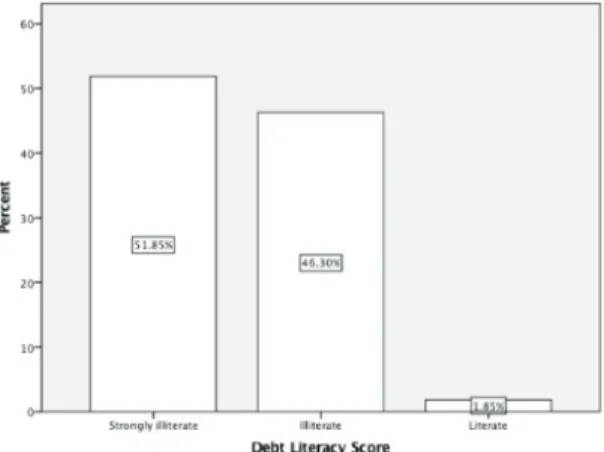
By using descriptive methods, it is clear that the majority of respondents, both borrowers and non-peer-to-peer lending borrowers are debt illiterate, and those who have poor debt literacy have huge debt. Overall, only 1.85% of the respondents were debt literate. Those who live on the island of Java have better literacy because they are the center of economic growth in Indonesia. Debt from peer-to-peer (P2P) lending also has the potential to create problems, namely over-indebtedness. P2P lending borrowers also have very poor debt literacy. However, there is no difference in debt literacy between P2P lending borrowers and non-P2P lending borrowers.

Keyword: Debt Literacy, Financial Literacy, Peer-To-Peer Lending, Over-Indebtedness JEL Classification Code: G5, I1, M5

(Pokorná & Sponer, 2016; Zhu, 2018). In addition to not having to face-to-face, the platform manager also has more information compared to borrowers and lenders. The asymmetry of information and low financial literacy makes P2P lending managers offer (trap) loans on a massive scale (predatory lending) because borrowers with low financial literacy cannot calculate fines if they are late or delay paying.

Information asymmetry is a key issue in P2P lending that can result in a moral hazard or adverse selection and ultimately impact the viability and success of individual P2P lending platforms. Gathergood (2012) and Lusardi and Tufano (2009a) proved that those who have low financial literacy tend to borrow money at high-interest rates. Thus, the presence of P2P lending that is not accompanied by good financial literacy, especially debt literacy, can hurt borrowers.

The negative impact will be more significant if the borrower is a household. Households are owners and borrowers of financial assets that can have an impact on the economy because of interconnectedness with other elements of the financial system. In its capacity as a borrower of funds, the inability of households to pay their obligations to other parties, especially banks, will have an impact not only on the banking sector but also on the national economy. According

*Acknowledgements:

This research was supported by STIE Bank BPD Jateng. Contract Number: 001/SKP/P3M/STIEBPD/2019.

1

First Author and Corresponding Author. Management Department, STIE Bank BPD Jawa Tengah, Indonesia [Postal Address: Soekarno Hatta 88, Semarang, Central Java, 50196, Indonesia]

Email: [email protected]

© Copyright: The Author(s)

This is an Open Access article distributed under the terms of the Creative Commons Attribution Non-Commercial License (https://creativecommons.org/licenses/by-nc/4.0/) which permits unrestricted non-commercial use, distribution, and reproduction in any medium, provided the original work is properly cited.

1. Introduction

Low financial literacy becomes increasingly risky due to the emergence of new financial products and their increasingly complex derivatives. Ignorance of increasingly complex financial products can make people lose money due to information asymmetry.

Peer-to-peer lending (P2P lending), is the practice of

lending money to individuals or businesses through online

services that match lenders with borrowers. However, Peer-

to-peer (P2P) lending is a platform of financial technology

product innovation that has information asymmetry

(2)

to Cardaci (2018), an explosion of consumption financed by debt will lead to instability of the economic system and thus pave the way for the financial crisis.

Sub-prime mortgages in the United States are proof that credit risk originating from the household sector can have a systemic impact on the economy. It was confirmed by Meniago et al. (2013), who confirmed the existence of a long-run cointegrating relationship between household debt and other macroeconomic determinants. Alternatively, household borrowing was found to be significantly and insignificantly affected by negative changes in income and prime rate, respectively. Lowe (2017) who researched in Australia, also concluded that increasing household debt relative to income has made the economy less resilient to future shocks.

This phenomenon illustrates that household loans, including through P2P lending, are crucial. A series of empirical research proves that debt affects the vulnerability of the household sector (Ardhienus, 2018). The greater the debt held, the higher the vulnerability of the household to shock, especially those arising from an increase in interest rates (Andersen et al., 2016).

This research was conducted to look at the relationship between debt literacy, peer-to-peer lending, and over- indebtedness. While some research discusses financial literacy, there is only a little research that discusses debt literacy. Research on financial literacy is more associated with financial decisions such as investing in the capital market, saving, planning for retirement, buying insurance products, and so on.

Little research that discusses debt literacy is Lusardi and Tufano (2015) who found a relationship between debt literacy and both financial experiences and debt loads.

Individuals with lower levels of debt literacy tend to transact in high-cost manners, incurring higher fees and using high- cost borrowing. Besides having significant debt arrears, they also do not know the amount of debt. Financial experiences are the participants’ reported experiences with traditional borrowing, alternative borrowing, and investing. Over- indebtedness is a self-reported measure.

The novelty of this research is to discuss P2P lending from the perspective of debt literacy and over-indebtedness.

Online Peer-to-Peer (P2P) lending has emerged recently.

Research, so far, on P2P lending explores the P2P loan characteristics, evaluates their credit risk, and measures loan performances (Emekter et al., 2015).

This research is essential because the number of loans on this platform continues to increase. According to the Financial Stability Board (2017), fintech growth is influenced by two factors, namely demand and supply. Demand comes from a shift in consumer choices for financial products and services that are faster, more convenient, and easier to use. From the supply side, the development of information technology and

regulation makes it easier to establish a fintech company.

China is one of the countries that has made a significant contribution to fintech growth. This country has the most number of P2P lending in the world (Stern et al., 2017) as a consequence of the highly developed digital financial services ecosystem (Zhou et al., 2018). In 2016, almost half of P2P in China was a problematic business (Shen & Huang, 2016). After being regulated, many P2P lending operations in other countries, including Indonesia.

P2P lending is also preferred because borrowers do not need to have collateral, so the potential for debt traps becomes even more significant. Household’s over-indebtedness due to loans through P2P lending will not only affect the household but can also affect the economy in the aggregate. This condition if not checked and corrected, will cause problems because the literacy and financial inclusion of the Indonesian people are still low (Hidajat et al., 2020; OJK, 2018).

2. Methodology

This research collaborates with a commercial market research firm, Jajak Pendapat (www.jakpat.net) to get respondents (Survey ID 20716). Data collection for 108 respondents was done online in July 2019.

Debt literacy is measured using questions from Lusardi and Tufano (2009a), i.e., interest compounding (first question), how to work and calculate credit card interest (second question), and the application of time value of money in payment options (third question). The score for each correct answer is 1 (one), while for the wrong answer is 0 (zero). The literacy level classification for the scores obtained is Strongly Illiterate (0), Illiterate (1), Literate (2), and Strongly Literate (3).

The first question about interest compounding is “If you owe $ 1,000 on your credit card where interest is 20% per year, compounded annually, how many years would it take for the amount to double if you didn’t pay anything off?” The answer choices for this question are (i) Two years; (ii) Less than five years; (iii) Five to ten years; (iv) More than ten years; (v) Do not know; (vi) Prefer not to answer. Those who know the “rule of 72” will answer this question correctly which is 3.6 years or (ii) less than five years.

The second question about how credit cards work is “If you owe $ 3,000 on credit cards and you pay a minimum payment of $ 30 each month at an annual percentage rate of 12% (or 1% per month), how many years would it take to pay your debt if you made no additional new charges?”

The answer choices for this question are (i) Less than five

years; (ii) Between five and ten years; (iii) Between ten and

fifteen years; (iv) Never, I will continue to be in debt; (v) Do

not know; (vi) Prefer not to answer. The correct answer to

this question is that the borrower will still have debt (answer

number iv).

(3)

The third question regarding the application of time value of money in determining payment options is “If you purchase an appliance which costs $ 1,000 and to pay for this appliance you have the following two options: a) Pay 12 monthly installments of $ 100 each; b) Borrow at a 20%

annual interest rate and payback of $ 1,200 a year from now.

Which is the more advantageous offer?” The answer choices for this question are (i) Option (a); (ii) Option (b); (iii) They are the same; (iv) Do not know; (v) Prefer not to answer.

An indicator commonly used to measure over- indebtedness is the financial margin (FM) which measures the ability to meet needs and pay off debt. Vulnerable households are those that have negative FM (FM ≤ 0). FM is calculated from the difference in income with necessary expenses (food expenses, housing & household facilities, clothing and fashion, as well as expenses for various goods and services) and debt installments. However, in this study, over-indebtedness was measured using self-assessment from Lusardi and Tufano (2009a), namely “Which of the following best describes your current debt position?” The answer choices for this question are (a) I have too much debt right now, and I have or may have difficulty paying it off; (b) I have about the right amount of debt right now, and I face no problems with it; (c) I have too little debt right now, I wish I could get more; (d) I just don’t know.

3. Results and Discussion 3.1. Who is Debt Literate?

Debt literacy is one component in financial literacy that measures the ability to make decisions related to debt and applies basic knowledge about compound interest in everyday life (Lusardi & Tufano, 2009a). The questions used to measure this literacy are (1) knowledge of interest compounding, (2) how to calculate credit card interest, and (3) application of time value of money in payment options.

Respondents’ answers to this question are in Table 1.

For the first question (about interest compounding), only 33% answered the question about interest compounding correctly. The majority of respondents who answered questions about interest compounding correctly were men, monthly spending between USD 201 to USD 300, aged 25 to 34 years, and living in the province of Central Java.

Someone who knows how to calculate interest or the “rule of 72” will answer less than five years, which is 3.6 years. It shows that the majority (67%) of respondents did not know the concept of interest accruals. In comparison, the results of Lusardi and Tufano (2015) and Loke and Hageman (2013) yielded 36% and 47.9% respectively.

The answer to the second question (about the time to pay off credit card debt) gives very poor results. Only 5%

of respondents answered the question correctly, monthly

spending less than USD 100, aged 17 to 24 years, and living in the province of West Java. Although the number of women who answered correctly is higher than men, there are no significant differences. It shows that the majority of respondents (95%) did not know that the minimum payment of credit card debt would never pay off the money borrowed.

The minimum payment will only reduce the loan principal, but the loan interest will continue to be calculated and increased. In comparison, the results of Lusardi and Tufano (2015) and Loke and Hageman (2013) yielded 35% and 45.9%, respectively.

The third question (about understanding the time value of money in the choice of payment method) was answered correctly by 10% of respondents. In comparison, the results of Lusardi and Tufano (2015) and Loke and Hageman (2013) yielded 7% and 4.2% respectively. The majority of respondents who answered correctly were male, monthly spending USD 201 to USD 300, aged 17–24 years, and living on the island of Java (West and East Java). Payment options (a) and (b) at a glance look the same. However, option (b) is the right answer because it gives a smaller amount of payment. It shows that the majority (90%) of respondents do not understand the time value of money.

In general, the majority of respondents are debt illiterate, similar to the results of Lusardi and Tufano (2009b) who looked deeper, studying consumers’ debt literacy, the ability to understand how interest rates work, and make simple decisions about borrowing. They found it to be strikingly low. They had expected that a sizable percentage would not be able to understand the workings of credit cards or apply the concept of compound interest to everyday situations;

what surprised them was that the vast majority could not.

Overall, only 1.85% of the respondents were debt literate.

Those who are debt literate are men, monthly spending USD 201 to USD 300, age 17–24 years, and live on the island of Java. This result is consistent with findings that women have low financial literacy (Bucher-Koenen et al., 2017) and low debt literacy (Lusardi & Tufano, 2015). According to Fonseca et al. (2012), a possible mechanism through which men and women “produce” different levels of financial literacy may arise through a process by which, within the household, men specialize in acquiring financial knowledge and women specialize in other household functions.

Those who live on the island of Java have better literacy because they are the center of economic growth in Indonesia.

This island also has the most significant number of cities

and educational institutions in Indonesia. This condition

correlates with the level of financial literacy because

according to Jappelli (2010), the urban population has a

positive correlation with literacy. In countries where the

majority of the population is in big cities, the population is

proven to have higher literacy. In big cities, there are many

financial institutions, and residents more often do financial

(4)

Table 1: Debt Literacy and Demographics Factors Debt Literacy (%) Interest compounding knowledge (Q1) Credit card knowledge (Q2) Time value of money and payment knowledge (Q3)

Q 11 Q 12 Q 13 Q 14 Q 15 Q 16 Q 21 Q 22 Q 23 Q 24 Q 25 Q 26 Q 31 Q 32 Q 33 Q 34 Q 35

DEMOGRAPHICS

Gender Male 12 20 8 2 11 7 19 19 6 2 11 5 28 7 13 7 5 Female 10 12 10 0 3 5 7 14 7 3 7 3 15 3 10 7 6

Monthly spending

£$100 7 9 4 0 7 1 8 7 2 3 8 1 10 3 7 7 3 $101–200 7 7 7 0 4 6 5 10 5 1 7 3 11 2 7 3 7 $201–300 7 10 3 1 1 4 7 8 5 1 2 3 12 5 4 4 1 $301–500 1 4 5 1 0 0 4 5 1 0 1 0 6 1 3 1 0 $501–750 1 1 1 0 0 1 2 1 0 0 0 1 3 0 1 0 0 >$750 0 1 0 0 2 0 0 2 0 0 1 0 1 0 2 0 0

Age range

17–24 15 15 7 0 7 3 14 15 6 3 7 2 19 6 12 6 4 25–34 5 13 12 1 4 7 7 15 7 1 8 4 18 4 7 6 7 35–44 3 4 0 1 3 2 5 2 0 1 3 2 5 1 4 3 0 45–54 0 1 0 0 0 0 0 1 0 0 0 0 1 0 0 0 0 Total 22 33 19 2 14 11 25 33 12 5 19 0 43 10 23 14 10 Note: This table contains the percentage of respondents’ knowledge about debt literacy , namely interest compounding knowledge (question 1), credit card knowledge (question 2), time value of money , and payment knowledge (question 3) from Lusardi and Tufano (2009) and demographic description of respondents. Question 1: “ If you owe $1,000 on your credit card where interest is 20% per year , compounded annually , how many years would it take for the amount to double if you didn’t

pay anything off? Answer Q1

n: Q1 1 Two years; Q12 Less than 5 years (correct answer); Q13 Five to ten years; Q14 More than 10 years; Q15 Do not know; Q16 Prefer no t to answer . Question 2: “ If you owe $3,000 on credit cards and you pay a minimum payment of $30 each month at an annual percentage rate of 12 (or 1 per month), how many years would it take to disappear your debt if you made no additional new charges? ” Answer Q2 n: Q21 Less than 5 years; Q22 Between 5 and 10 years; Q23 Between 10 and 15 years; Q24 Never , I will continue to be in debt (correct answer); Q25 Do not know; Q26 Prefer not to answer . Question Q3: “ If you purchase an appliance which costs $1,000 and to pay for this appliance you have the following two options: a) Pay 12 mon thly installments of $100 each; b) Borrow at a 20 annual interest rate and payback of $1,200 a year from now . Which is the more advantageous offer? Answer Q3 n: Q31 Option (a); Q32 Option (b) (correct answer); Q33 They are the same; Q34 Do not know; Q35 Prefer not to answer .

(5)

transactions, thereby increasing financial knowledge and experience. According to Nguyen and Nguyen (2020), those with higher levels of financial literacy, especially those with advanced levels of financial literacy, tend to participate in financial markets.

3.2. Debt Literacy and Peer to Peer Lending

From the description of respondents in Table 2 and Figure 1, the percentage of P2P lending borrowers is 40%.

They are men, monthly spending USD 201–300 and aged 17–24. This condition is slightly different from the research of Wang et al. (2019) on the P2P lending platform in China, who found that borrowers who are older, married, and have a higher educational background are more welcomed among P2P lenders.

P2P lending borrowers in Indonesia also have very poor debt literacy (Table 2 and Figure 2), especially understanding of the credit card mechanism. However, there is no difference in debt literacy between P2P lending borrowers and non-P2P lending borrowers. From the Chi-Square test, we get a value of 0.092 or greater than 0.05 (H0 accepted).

Figure 2: Borrowers’ Financial Literacy Scores

P2P borrowers who correctly answered questions about interest compounding is only 16%, about credit card mechanism is 0% and about the time value of money and payment is 9%. This phenomenon shows that the majority of P2P lending borrowers do not understand the concept of interest accrual or the “rule of 72” calculation. They do not know that the period of the loan amount will double if the borrower does not pay the debt. This condition is a cause for concern because the ‘rule of 72’ is a straightforward and simple calculation. Without the help of a calculator, one can easily calculate when the loan will double. Ignorance of these calculations can have fatal consequences because the borrower can get trapped in huge debt.

Even so, knowledge about interest compounding is still better than knowledge about the credit card mechanism. No P2P lending borrower could answer the second question correctly. They do not know that paying the loan principal will never clear the debt. This ignorance is fatal because P2P lending borrowers will continue to have debt if they only pay the principal.

Table 2: Borrower’s Characteristics and Knowledge

P2P Borrower

Yes No

Panel A: Demographics

Gender Male 31% 30%

Female 10% 30%

Monthly Spending £$100 11% 18%

$101–200 10% 19%

$201–300 12% 13%

$301–500 4% 7%

$501–750 3% 1%

>$750 1% 2%

Age Range 17–24 19% 27%

25–34 16% 25%

35–44 6% 7%

45–54 0% 1%

Panel B: Debt Literacy Interest compounding

knowledge Incorrect 25% 43%

Correct 16% 17%

Credit card knowledge Incorrect 41% 55%

Correct 0% 5%

Time value of money

and payment knowledge Incorrect 32% 58%

Correct 9% 1%

Figure 1: Debt Literacy Scores Comparison

(6)

Table 3: Debt Conditions Based on Demographics, Debt Literacy, P2P Borrowers

Debt Condition (%)

Q1 Q2 Q3 Q4

Panel A: Demographic

Gender Male 11.10 28.70 7.40 13.00

Female 5.60 13.90 3.70 16.70

Age Range 17–24 7.40 15.70 7.40 15.70

25–34 5.60 21.30 2.80 11.10

35–44 3.70 4.60 0.90 2.80

45–54 0.00 0.90 0.00 0.00

Education Elementary 0.90 0.00 0.00 0.00

Junior High 0.00 2.80 0.90 1.90

High School 10.20 23.10 7.40 16.70

Diploma 1 Year 0.90 0.90 0.90 0.90

Diploma 2 Year 0.90 0.00 0.00 0.00

Diploma 3 Year 0.00 4.60 0.00 2.80

Bachelor 2.80 9.30 0.90 7.40

Master 0.90 1.90 0.90 0.00

The third question about the time value of money and the most favorable payment option is correctly answered by only 9% of respondents. Although the borrower’s knowledge of this matter is better than that of non-borrowers (1%), this figure still illustrates the low debt literacy. Ignorance of the concept of the time value of money can trap people into detrimental payment options.

This ignorance is very alarming because P2P lending interest rates are very high. Being late in paying bills leads to borrowers being charged higher interest and also unpleasant treatment from the debt collector (Hidajat, 2019). There are regulatory weaknesses in regulating illegal P2P lending.

There are no strict legal sanctions for P2P lending operators who behave unethically with borrowers. Households with good financial literacy are able to take advantage of their income for saving, investing and entrepreneurship (Monsura, 2020).

3.3. Debt Literacy, P2P Lending, and Over-Indebtedness

Questions about the condition of the debt as answered by respondents were – “that they have much debt and have difficulty in repaying” (16.70%), “have debt but have the ability to repay” (42.60%), “have less debt, and want to get more” (11.10%) and “do not know” (29.60%). This answer illustrates that the majority of respondents have debts.

The majority of respondents who have financial difficulties due to debt are men, aged 17–24 years, high school education with a maximum monthly expenditure of USD 200. These demographic characteristics indicate that those who are young but not highly educated and have a small monthly expenditure are groups who have financial difficulties because of debt. It is possible because those who are young but cannot continue their tertiary education will tend to find jobs that offer low wages.

This group also has very bad debt literacy. Only 9.30%

know about the interest compounding mechanism, and 0.90% know the time value of money and payment options.

No one knows how to calculate credit card interest. However, there is no difference in debt literacy between P2P lending borrowers and non-P2P lending borrowers. From the Chi- Square test, we get a value of 0.266 or greater than 0.05 (H0 accepted).

There is a relationship between the condition of debt with the decision to borrow both in P2P lending and non- P2P lending because the Chi-Square test results show a value of 0.000 or less than 0.05. It could be hypothesized that debt could cause households to become financially strained.

Borrowers who have financial difficulties are P2P

lending borrowers (11.10%) and borrowers on other

platforms (5.60%). This condition is the same as the results

of Schicks (2014), who analyzed the over-indebtedness of

micro borrowers in Ghana and found that those who have

good debt literacy have lower amounts of debt. This result

(7)

Debt Condition (%)

Q1 Q2 Q3 Q4

Monthly Spending £$100 4.60 7.40 3.70 13.00

$101–200 4.60 12.00 1.90 11.10

$201–300 3.70 13.90 3.70 3.70

$301–500 1.90 5.60 1.90 0.90

$501–750 0.90 2.80 0.00 0.00

>$750 0.90 0.90 0.00 0.90

Panel B: Debt Literacy Interest compounding

knowledge 2 years 2.80 11.10 2.80 5.60

Less than 5 years 9.30 13.00 3.70 6.50

5 to 10 years 1.90 9.30 2.80 4.60

More than 10 years 0.00 1.90 0.00 0.00

Do not know 1.90 0.90 1.90 9.30

Prefer not to answer 0.90 6.50 0.00 3.70

Credit card knowledge Less than 5 years 2.80 13.00 4.60 4.60

Between 5 and 10 years 10.20 13.90 1.90 6.50

Between 10 and 15 years 1.90 4.60 3.70 1.90

Never, you will continue to be in debt 0.00 0.90 0.90 2.80

Do not know 0.90 6.50 0.00 11.10

Prefer not to answer 0.90 3.70 0.00 2.80

Time value of money and payment knowledge

Option (a) 8.30 20.40 6.50 7.40

Option (b) 0.90 6.50 1.90 0.90

They are the same 6.50 12.00 0.90 3.70

Do not know 0.90 0.90 0.90 11.10

Prefer not to answer 0.00 2.80 0.90 6.50

Panel C: P2P Borrower

P2P Borrower Yes 11.10 26.90 2.80 0.00

No 5.60 15.70 8.30 29.60

Total 16.70 42.60 11.10 29.60

Note: This table contains the percentage of debt conditions based on demographics, debt literacy, and P2P borrowers.

Respondents’ answers to debt conditions are divided into four categories, namely:

Q1: I have too much debt right now and I have or may have difficulty paying it off.

Q2: I have about the right amount of debt right now and I face no problems with it.

Q3: I have too little debt right now; I wish I could get more.

Q4: I just do not know . Table 3: (Continued)

is also consistent with the findings of Sevim et al. (2012) who measured the effects of financial literacy of Turkish financial consumers on borrowing behavior. Findings of the study indicated differences in the borrowing behaviour of consumers with different levels of financial literacy.

Considering the relationship between financial literacy

and borrowing behavior, they suggested that attempts to increase the financial literacy of financial consumers may have important implications in the prevention of excessive borrowing. With a good financial attitude, all generations will have high financial capabilities (Amonhaemanon &

Vora-Sitta, 2020).

(8)

Emekter, R., Tu, Y., Jirasakuldech, B., & Lu, M. (2015). Evaluating credit risk and loan performance in online peer-to-peer (P2P) lending. Applied Economics, 47(1), 54–70. https://doi.org/

10.1080/00036846.2014.962222

Financial Stability Board (FSB). (2017). Financial stability implications from FinTech. https://www.fsb.org/wp-content/

uploads/R270617.pdf

Fonseca, R., Mullen, K. J., Zamarro, G., & Zissimopoulos, J. (2012).

What explains the gender gap in financial literacy? The role of household decision-making. Journal of Consumer Affairs, 46(1), 90–106. https://doi.org/10.1111/j.1745-6606.2011.01221 Gathergood, J. (2012). Self-control, financial literacy, and consumer

over-indebtedness. Journal of Economic Psychology, 33(3), 590–

602. http://dx.doi.org/10.1016/j.joep.2011.11.006

Hidajat, T. (2019). Unethical practices peer-to-peer lending in Indonesia. Journal of Financial Crime, 27(1), 28–56. https://

doi.org/10.1108/JFC-02-2019-0028

Hidajat, T., Primiana, I., Rahman, S., & Febrian, E. (2020). Why are people trapped in Ponzi and pyramid schemes? Journal of Financial Crime, ahead-of-print. https://doi.org/10.1108/JFC- 05-2020-0093

Jappelli, T. (2010). Economic literacy: An international comparison.

The Economic Journal, 120(548), F429–F451. https://doi.org/

10.1111/j.1468-0297.2010.02397

Loke, V., & Hageman, S. A. (2013). Debt literacy and social work.

Journal of Financial Therapy, 4(1), 3. https://doi.org/10.4148/

jft.v4i1.1795

Lowe, P. (2017). Household debt, housing prices, and resilience.

Economic Analysis and Policy, 55, 124–131. https://doi.

org/10.1016/j.eap.2017.05.007

Lusardi, A., & Tufano, P. (2009a). Debt literacy, financial experiences, and overindebtedness (Working Paper No 14808).

National Bureau of Economic Research. https://www.nber.org/

system/files/working_papers/w14808/w14808.pdf

Lusardi, A., & Tufano, P. (2009b). Teach workers about the perils of debt. Harvard Business Review, 87(11), 22–24. https://hbr.

org/2009/11/teach-workers-about-the-perils-of-debt

Lusardi, A., & Tufano, P. (2015). Debt literacy, financial experiences, and overindebtedness. Journal of Pension Economics & Finance, 14(4), 332–368. https://doi.org/10.1017/

S1474747215000232

Meniago, C., Mukuddem-Petersen, J., Petersen, M. A., & Mongale, I. P. (2013). What causes household debt to increase in South Africa? Economic Modelling, 33, 482–492. https://doi.

org/10.1016/j.econmod.2013.04.028

Monsura, M. P. (2020). The importance of financial literacy:

Household’s income mobility measurement and decomposition approach. The Journal of Asian Finance, Economics, and Business, 7(12), 647–655. https://doi.org/10.13106/jafeb.2020.

vol7.no12.647

Nguyen, T. A. N., & Nguyen, K. M. (2020). Role of financial literacy and peer effect in the promotion of financial market Figure 3: Borrower’s Profile and Debt Conditions

4. Conclusion

The majority of respondents have low debt literacy. In addition to low debt literacy, the majority of respondents also have debts. P2P lending borrowers even have very poor debt literacy, especially knowledge about the mechanism of credit card loans. Respondents who have financial difficulties due to debt are those who are young but not highly educated, so they tend to get low-paying jobs. Borrowing from P2P lending is also not the right choice because it makes the household trapped in debt. Equitable development and financial education are one of the agendas that must be carried out to increase public debt literacy.

References

Amonhaemanon, D., & Vora-Sitta, P. (2020). From financial literacy to financial capability: A preliminary study of different generations in the informal labor market. The Journal of Asian Finance, Economics, and Business, 7(12), 355–363. https://doi.

org/10.13106/jafeb.2020.vol7.no12.355

Andersen, A. L., Duus, C., & Jensen, T. L. (2016). Household debt and spending during the financial crisis: Evidence from Danish microdata. European Economic Review, 89, 96–115. https://

doi.org/10.1016/j.euroecorev.2016.06.006

Ardhienus. (2018). Measuring the vulnerability of the household sector. https://id.beritasatu.com/home/mengukur-kerentanan- sektor-rumah-tangga/173142

Bucher-Koenen, T., Lusardi, A., Alessie, R., & Van Rooij, M.

(2017). How financially literate are women? An overview and new insights. Journal of Consumer Affairs, 51(2), 255–283.

https://doi.org/10.1111/joca.12121

Cardaci, A. (2018). Inequality, household debt, and financial instability: An agent-based perspective. Journal of Economic Behavior & Organization, 149, 434–458. https://doi.

org/10.1016/j.jebo.2018.01.010

(9)

participation: Empirical evidence in Vietnam. The Journal of Asian Finance, Economics, and Business, 7(6), 1–8. https://doi.

org/10.13106/jafeb.2020.vol7.no6.001

Otoritas Jasa Keuangan (OJK). (2018). Indonesia’s national strategy for financial literacy. https://www.ojk.go.id/id/berita- dan-kegiatan/publikasi/Pages/Strategi-Nasional-Literasi- Keuangan-Indonesia-(Revisit-2017)-.aspxPokorná, M., &

Sponer, M. (2016). Social lending and its risks. Procedia - Social and Behavioral Sciences, 220, 330–337. https://doi.

org/10.1016/j.sbspro.2016.05.506

Schicks, J. (2014). Over-indebtedness in microfinance: An empirical analysis of related factors on the borrower level.

World Development, 54, 301–324. https://doi.org/10.1016/j.

worlddev.2013.08.009

Sevim, N., Temizel, F., & Sayılır, Ö. (2012). The effects of financial literacy on the borrowing behavior of Turkish financial consumers. International Journal of Consumer Studies, 36(5), 573–579. https://doi.org/10.1111/j.1470-6431.2012.01123 Shen, Y., & Huang, Y. (2016). Evaluating the regulatory scheme

for internet finance in China: The case of peer-to-peer lending

AU-Wang, Jingyi. China Economic Journal, 9(3), 272–287.

https://doi.org/10.1080/17538963.2016.1214381

Stern, C., Makinen, M., & Qian, Z. (2017). FinTechs in China: With a special focus on peer-to-peer lending. Journal of Chinese Economic and Foreign Trade Studies, 10(3), 215–228. https://

doi.org/10.1108/JCEFTS-06-2017-0015

Wang, C., Zhang, W., Zhao, X., & Wang, J. (2019). Soft information in online peer-to-peer lending: Evidence from a leading platform in China. Electronic Commerce Research and Applications, 36, 100873. https://doi.org/10.1016/j.

elerap.2019.100873

Zhou, W., Arner, D. W., & Buckley, R. P. (2018). Regulating FinTech in China: From permissive to balanced. In D. Lee Kuo Chuen & R. B. T.H. Deng (Eds.), Digital finance, and inclusion (pp. 45–64). Cambridge, MA: Academic Press. https://doi.

org/10.1016/B978-0-12-812282-2.00003-6

Zhu, Z. (2018). Safety promise, moral hazard, and financial supervision: Evidence from peer-to-peer lending. Finance Research Letters, 27, 1–5. https://doi.org/10.1016/j.frl.

2018.07.002

수치

Table 1: Debt Literacy and Demographics Factors Debt Literacy (%) Interest compounding knowledge (Q1)Credit card knowledge (Q2) Time value of money and  payment knowledge (Q3)
Table 2: Borrower’s Characteristics and Knowledge
Table 3: Debt Conditions Based on Demographics, Debt Literacy, P2P Borrowers Debt Condition (%) Q1 Q2 Q3 Q4 Panel A: Demographic Gender Male 11.10 28.70 7.40 13.00 Female 5.60 13.90 3.70 16.70 Age Range 17–24 7.40 15.70 7.40 15.70 25–34 5.60 21.30 2.80 11.

참조

관련 문서