• 검색 결과가 없습니다.

Comparison of the Number Concentration and the Chemical Composition of the Atmospheric PM<sub>2.5</sub> in Jeju Area

N/A
N/A
Protected

Academic year: 2021

Share "Comparison of the Number Concentration and the Chemical Composition of the Atmospheric PM<sub>2.5</sub> in Jeju Area"

Copied!
11
0
0

로드 중.... (전체 텍스트 보기)

전체 글

(1)

23(5); 743~753; May 2014 http://dx.doi.org/10.5322/JESI.2014.5.743 ORIGINAL ARTICLE

Comparison of the Number Concentration and the Chemical Composition of the Atmospheric PM 2.5 in Jeju Area

Chang-Hee Kang, Chul-Goo Hu

1)*

Department of Chemistry, Jeju National University, Jeju 690-756, Korea

1)

Department of Environmental Engineering, Jeju National University, Jeju 690-756, Korea

Abstract

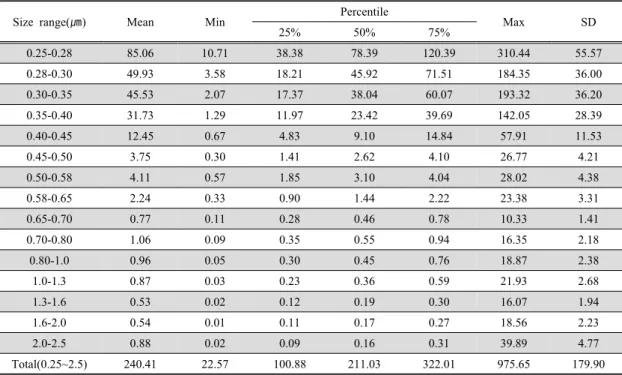
The number concentrations and the water soluble ionic concentrations of PM

2.5

have measured at Gosan site in Jeju, Korea, from March 2010 to December 2010, to clarify their characteristics. PM
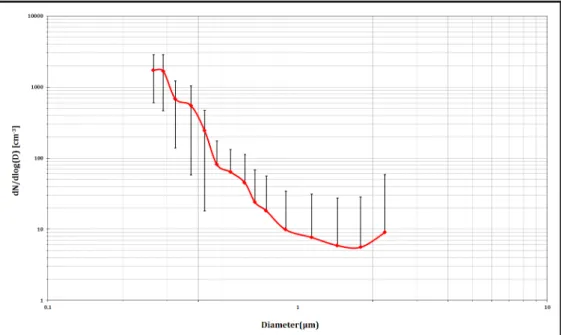
2.5

number concentrations vary from 22.57 to 975.65 particles/㎝

3

with an average value of 240.41 particles/㎝

3

, which have been recorded evidently high in spring season as compared with those in other season. And the concentrations in small size ranges are greatly higher than those in large size ranges, so the number concentration in the size range 0.25∼0.45 ㎛ has more than 94% of the total number concentration of PM
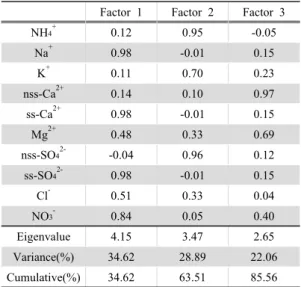
2.5

. The major ionic components in PM

2.5

are SO

42-

, NH

4+

and NO

3-

, which are mainly originated from anthropogenic sources, on the other hand, the concentrations of Cl

-

, K

+

, Ca

2+

and Mg

2+

are recorded relatively lower levels. The concentrations of the major ionic components are very high in spring season, but the concentration levels of the other components are recorded significantly high in winter season. On the other hand, in summer season, the lowest concentration levels are observed for overall components as well as the sum of them. The concentration ratios of nss-SO

42-

/SO

42-

and nss-Ca

2+

/Ca

2+

are 98.1% and 88.9%. And the concentration ratio of SO

42-

/NO

3-

(3.64) is greatly higher than the value in urban area due to no large NO
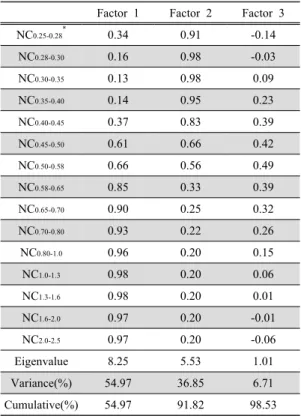
x

emission sources in the measurement. In addition, the correlation and the factor analysis for the number and the ionic concentrations of PM

2.5

are performed to identify their sources. From the Pearson correlation analysis and the factor analysis, it can be suggested that the smaller parts(<0.5 ㎛) of PM

2.5

is contributed by anthropogenic sources, but the sources of the remaining larger parts of PM

2.5

are not able to be specified sources in this study.

Key words : PM

2.5

, Number concentration, Ion concentration, Correlation analysis, Factor analysis, Jeju

1. Introduction 1)

Airborne particulate matter(PM) may affect human health, atmospheric visibility, precipitation patterns and the earth's radiation balance which have an important influence on the climate. Airborne PM is mainly formed by the dispersion process, such as, the breakup of solid and liquid particles, and by the condensation/reaction process which represents particle formation in atmosphere by the coming together of gases and smaller particles. Therefore, the PM is

composed of heterogeneous compounds varying in composition, size distribution, number and mass concentration and surface area(Lundgren et al., 1996;

Song et al., 2012).

In general, airborne particles are classified according to aerodynamic diameter into the following size fractions: particles less than 10 ㎛ in diameter (PM

10

), which are known as thoracic particulate, and fine particles less than 2.5 ㎛ in diameter(PM

2.5

), which are more likely to penetrate deep into the alveolar. PM

10

and PM

2.5

are usually selected as the

Received 9 December, 2013; Revised 6 March, 2014;

Accepted 11 March, 2014

*

Corresponding author : Chul-Goo Hu, Department of Environmental Engineering, Jeju National University, Jeju 690-756, Korea Phone: +82-64-754-3443

E-mail: [email protected]

ⓒ The Korean Environmental Sciences Society. All rights reserved.

This is an Open-Access article distributed under the terms of the Creative Commons Attribution Non-Commercial License (http://

creativecommons.org/licenses/by-nc/3.0) which permits unrestricted

non-commercial use, distribution, and reproduction in any medium,

provided the original work is properly cited.

(2)

monitoring parameters for evaluations of air quality (Heiu and Lee, 2010; Song et al., 2012). The air quality managements for ambient PM, in Korea, so far have been based on only PM

10

mass concentration, which has been established as air quality standard, in spite of, the effects on human health of PM

2.5

are much more than PM

10

. Recently, it is positively considered to establish air quality standard including PM

2.5

(Jung and Han, 2008; Lee et al., 2011).

The size distribution, concentration and chemical composition of ambient PM are important factors in assessing their effects and in managing them.

Recently, the interests in the health effects of fine particles have been increased. Several researchers have reported that the health effects of ambient PM are larger for smaller particles(Bigi and Ghermandi, 2011; Buzorius et al., 1999; Stanier et al., 2004). The number concentration of fine particles is usually very high, but its mass concentration is relatively low. It has been also shown that the health effects of ambient PM may be more sensitive to the number concentration than to the mass concentration(Yan et al., 2004).

Recently, a large number of observational studies on ambient PM

2.5

concentration and its chemical composition have been performed. A lot of studies on the characteristics of PM

2.5

mass concentrations and its chemical composition have been performed. Also, the relationships of the number and/or mass concentrations and the chemical compositions of PM

2.5

have been investigated(Jung and Han, 2008;

Lee et al., 2011, 2013; Watanabe et al., 2006).

Observational studies on the characteristics of PM

2.5

mass concentration and its water soluble ionic constituents and the backward trajectories analysis of PM

2.5

have been performed in Chuncheon, Korea (Jung and Han, 2008). The comparison of the size distributions of aerosol number concentrations and water soluble ionic constituents during Asian dust period with during non-Asian dust period have been investigated in Toyama, Japan(Watanabe et al.,

2006). A case study on the chemical composition characteristics of size-fractionated particles during heavy Asian dust event in spring, 2010 has been made at Gosan in Jeju, Korea(Lee et al., 2013).

Previous study performed at Gosan has shown that the aerosol number concentrations in the size range 0.3-0.5 ㎛, 0.5-0.82 ㎛, 0.82-1.35 ㎛, 1.35-2.23 ㎛ and 2.23-3.67 ㎛ are 36.04, 12.68, 1.36, 0.448 and 0.144 particles/㎝

3

, respectively(Lee et al., 2006).

And Kim et. al. have reported that the mean value of SO

42-

, NH

4+

, NO

3-

, Na

+

, Cl

-

, K

+

, Ca

2+

and Mg

2+

ion concentrations in PM

2.5

collected at Gosan in Jeju are 4.752, 1.53, 1.054, 0.391, 0.284, 0.273, 0.14 and 0.06

㎍/㎥, respectively(Kim et. al., 2003). Lee et. al. have also found that the maximum concentration levels in PM

2.5

sampled at Gosan are shown by nss-SO

42-

at 7.98 ㎍/㎥, followed by NH

4+

, NO

3-

, Na

+

, K

+

, nss-Ca

2+

, Cl

-

and Mg

2+

at 2.90, 2.28, 0.50, 0.41, 0.36, 0.33 and 0.14 ㎍/㎥, respectively(Lee et al., 2011).

However, few studies on the correlation between the number concentration and the chemical composition of PM

2.5

have been made in Jeju area.

In this study, the number concentration and chemical compositions of PM

2.5

are measured to examine the characteristics of the atmospheric PM

2.5

in Jeju area. And the factor analysis and correlation analysis for the number concentration and water soluble ionic concentration have been carried out to identify the sources of PM

2.5

.

2. Materials and Methods

2.1. Measurement site

The measurement site, Gosan(33˚17'N, 126˚10'E),

is located at the western tip of Jeju Island. The site,

shown in Fig. 1, is one of the background sites in

Korean Peninsula. Jeju Island is a volcanic island

with peak elevation of ∼2000 m and is a major resort

area with no large industrial sources. The island is

located in the East China Sea, ∼100 km south of the

(3)

Fig. 1. Location of the measurement site and surrounding region.

Korea mainland, ∼250 km west of Kyushu, Japan,

∼500 km east-northeast of Shanghai, China. The site is about 70 m above sea and adjacent to the seashore.

2.2. Instruments and measurements

An aerodynamic particle sizer spectrometer(APS, GRIMM Aerosol Technik GmbH & Co., Model #179), which uses light scattering method, has been used to measure aerosol number concentration in the present research. This instrument measures atmospheric aerosol number concentration in 30-channel of different size range from 0.25∼0.28 ㎛ to 30.0∼32.0

㎛, such as 11-channel in range of 0.25∼1.0 ㎛, 4-channel in range of 1.0∼2.5 ㎛, 8-channel in range of 2.5∼10.0 ㎛, 7-channel in range of 10.0∼32.0 ㎛.

Atmospheric aerosols have been sampled at 3 m from the ground level and the number concentration have been measured after having removed moisture.

The measurement of the aerosol number concentration

has been performed every 5 minute, from March 2010 to December 2010. The daily averaged data of the number concentration in 15-channel(0.25∼2.5

㎛) obtained from APS, during 69days sampled PM

2.5

for ionic analysis, have been used in this study.

And 69 PM

2.5

samples were collected on teflon filter using a cyclone sampler(URG, model URG- 2000-30EH, USA) for every 24-hours from March 2010 to December 2010 at Gosan site in Jeju.

Sampled filters were immersed with ethanol solution, then the filters were extracted with pure water in an ultrasonic water bath for 30 minutes and in a shaking water bath for 1 hour. And the extracts were filtered with syringe filters to remove insoluble matters.

The extracted solutions were used analytical samples to determine water soluble ion concentration.

In present study, 5 cations(NH

4+

, Na

+

, K

+

, Ca

2+

, Mg

2+

) and 3 anions(SO

42-

, NO

3-

, Cl

-

) in the PM

2.5

samples were analyzed using Metrohm Modula

(4)

Size range(㎛) Mean Min Percentile

Max SD

25% 50% 75%

0.25-0.28 85.06 10.71 38.38 78.39 120.39 310.44 55.57

0.28-0.30 49.93 3.58 18.21 45.92 71.51 184.35 36.00

0.30-0.35 45.53 2.07 17.37 38.04 60.07 193.32 36.20

0.35-0.40 31.73 1.29 11.97 23.42 39.69 142.05 28.39

0.40-0.45 12.45 0.67 4.83 9.10 14.84 57.91 11.53

0.45-0.50 3.75 0.30 1.41 2.62 4.10 26.77 4.21

0.50-0.58 4.11 0.57 1.85 3.10 4.04 28.02 4.38

0.58-0.65 2.24 0.33 0.90 1.44 2.22 23.38 3.31

0.65-0.70 0.77 0.11 0.28 0.46 0.78 10.33 1.41

0.70-0.80 1.06 0.09 0.35 0.55 0.94 16.35 2.18

0.80-1.0 0.96 0.05 0.30 0.45 0.76 18.87 2.38

1.0-1.3 0.87 0.03 0.23 0.36 0.59 21.93 2.68

1.3-1.6 0.53 0.02 0.12 0.19 0.30 16.07 1.94

1.6-2.0 0.54 0.01 0.11 0.17 0.27 18.56 2.23

2.0-2.5 0.88 0.02 0.09 0.16 0.31 39.89 4.77

Total(0.25~2.5) 240.41 22.57 100.88 211.03 322.01 975.65 179.90

Table 1. Statistic summary of the number concentration of the atmospheric PM2.5 sampled at Gosan in Jeju (Unit : particle/c㎥) IC(907 IC pump, 732 IC detector).

3. Results and Discussion

3.1. Characteristics of the PM

2.5

number concentration The statistic summary of the atmospheric PM

2.5

number concentrations measured separately in the 15 size ranges during the experimental period are shown in Table 1. As shown in Table 1, the PM

2.5

number concentrations vary from 22.57 to 975.65 particles/㎝

3

with an average value of 240.41 particles/㎝

3

. The 25, 50 and 75 percentile concentrations are about 101, 211 and 322 particles/㎝

3

, respectively. The PM

2.5

number concentrations measured in this study are low as compared to other previous researches performed in urban area(Park et al., 2001; Sharma et al., 2003).

The average number concentrations in small size ranges are greatly higher than those in large size ranges. The average concentration is about 85

particles/㎝

3

in the smallest size range (0.25∼0.28

㎛), 46 particles/㎝

3

in the size range 0.30∼0.35 ㎛, 4 particles/㎝

3

in the size range 0.45∼0.50 ㎛ and 2 particles/㎝

3

in the size range 0.58∼0.65 ㎛. On the other hand, the average number concentrations of aerosol particles larger than 0.65 ㎛ are lower than about 1.0 particles/㎝

3

. These results show that the number concentrations in the size range 0.25∼0.45

㎛ has more than 94% of the number concentration of PM

2.5

.

The median values(50 percentile concentrations)

are slightly lower than the mean values in the size

range 0.25∼0.58 ㎛, but the differences in the mean

values and the median values are very large in the

size range of larger than 0.7 ㎛. In addition, the

standard deviation values are lower than the mean

values in the size range of smaller than 0.45 ㎛,

however, the standard deviation values are more than

2times of the mean values in the size range of larger

(5)

Size range(㎛) Spring Summer Fall Winter

0.25-0.28 103.6 (310.44 ~ 29.68) 60.02 (168.13 ~ 10.71) 74.46 (239.48 ~ 14.59) 67.78 (153.45 ~ 23.05) 0.28-0.30 59.21 (145.94 ~ 16.94) 36.95 (107.8 ~ 3.58) 45.42 (184.35 ~ 6.13) 39.25 (103.79 ~ 8.63) 0.30-0.35 48.98 (136.13 ~ 15.42) 35.81 (102.76 ~ 2.07) 45.2 (193.32 ~ 4.82) 40.36 (118.92 ~ 7.79) 0.35-0.40 30.3 (105.05 ~ 9.79) 27.83 ( 76 ~ 1.29) 34.02 (142.05 ~ 3.56) 32.09 (102.33 ~ 6.32) 0.40-0.45 13.59 (57.91 ~ 4.81) 11.93 (30.59 ~ 0.67) 11.43 (42.6 ~ 1.66) 11.9 (36.24 ~ 3.06) 0.45-0.50 4.18 (26.77 ~ 1.26) 3.42 (8.13 ~ 0.3) 3.24 (11 ~ 0.51) 3.96 (11.19 ~ 1.13) 0.50-0.58 4.70 (28.02 ~ 1.36) 3.73 (7.95 ~ 0.57) 3.49 (10.19 ~ 0.71) 4.17 (10.21 ~ 1.51) 0.58-0.65 3.06 (23.38 ~ 0.53) 1.31 (2.26 ~ 0.4) 1.56 (8.73 ~ 0.33) 1.98 (4.28 ~ 0.76) 0.65-0.70 1.11 (10.33 ~ 0.11) 0.35 (0.46 ~ 0.16) 0.51 (3.92 ~ 0.11) 0.62 (1.28 ~ 0.24) 0.70-0.80 1.56 (16.35 ~ 0.09) 0.41 (0.6 ~ 0.24) 0.69 (6.15 ~ 0.15) 0.79 (1.6 ~ 0.32) 0.80-1.0 1.44 (18.87 ~ 0.05) 0.33 (0.51 ~ 0.24) 0.61 (5.74 ~ 0.14) 0.69 (1.4 ~ 0.26) 1.0-1.3 1.4 (21.93 ~ 0.03) 0.28 (0.43 ~ 0.24) 0.5 (4.6 ~ 0.12) 0.52 (1.14 ~ 0.16) 1.3-1.6 0.94 (16.07 ~ 0.02) 0.15 (0.21 ~ 0.11) 0.25 (2.47 ~ 0.05) 0.22 (0.51 ~ 0.06) 1.6-2.0 1.01 (18.56 ~ 0.01) 0.12 (0.14 ~ 0.07) 0.21 (2.35 ~ 0.04) 0.17 (0.4 ~ 0.05) 2.0-2.5 1.78 (39.89 ~ 0.02) 0.09 (0.12 ~ 0.04) 0.23 (2.85 ~ 0.03) 0.17 (0.41 ~ 0.05) Total(0.25~2.5) 276.9(80.13~975.65) 182.8(22.57~505.42) 221.8(35.57~829.69) 204.7(53.99~541.37) Table 2. Seasonal averages of the PM

2.5

number concentrations (Unit : particle/c㎥) than 0.7 ㎛. From these results, it is found that the

number concentrations in the larger size range(≥0.7

㎛) are severely varied in comparison with those in the smaller size range.

Table 2 shows the seasonal averages of the atmos- pheric PM

2.5

number concentrations. The measurement period from March to December was divided into spring(March through May), summer(June through August), fall(September through November) and winter (December) season. The highest seasonal average of PM

2.5

number concentrations is observed in spring season with 277 particles/㎝

3

, and the lowest seasonal average value is observed in summer season with 183 particles/㎝

3

. The differences in the seasonal averages of PM

2.5

number concentrations in each size range are very large in the size range 0.58∼2.5 ㎛, but the differences are not large in the size range 0.25∼0.58

㎛. For example, the maximum seasonal average is 1.7 times higher than the lowest seasonal average in the size range 0.25∼0.28 ㎛, on the other hand, in the size range 1.6∼2.0 ㎛, the maximum seasonal

average is 8.4 times higher than the lowest seasonal average. In particular, the PM

2.5

number concentrations in summer season for larger particles(≥0.7 ㎛) are dramatically low as compared to those in other season.

It is seemed that the higher PM

2.5

number concentrations in the spring season are due to the Asian dust storm effects and the dry atmospheric conditions. The Asian dust storm can greatly increase the atmospheric aerosol concentrations in coarse particles. Even after the main stream had passed through a certain region, there are still remaining smaller particles which can result in increasing local atmospheric aerosol concentrations. Also, the dry atmospheric conditions in spring season can generate suspended particles. Therefore, the PM

2.5

number concentrations in spring season are high and show a large fluctuation in comparison with other season.

The PM

2.5

number concentrations in summer season,

which usually have a large amount of precipitation,

are very low depending upon rainout or washout

(6)

Fig. 2. Size distribution of the entire averaged PM2.5 number concentration during experimental period.

processes, especially, for larger particles(Hieu and Lee, 2010).

It is known that the aerosol size distribution are important factors in assessing the effects on atmospheric visibility, irradiation balance, weather and human health(Bigi and Ghermandi, 2011). In general, the size distribution of aerosol number concentrations are estimated in [N(D)=dN/dlog(D)] because of the large differences of concentration values with size range.

Size-fractioned atmospheric PM

2.5

number concent- rations distribution for the entire averages are presented in Fig. 2. As shown in Fig. 2, it is found that the N(D) values for the entire averages are exponentially decreased with increasing particle size. Two different patterns are observed in size-fractioned N(D) values curve with the size range. The N(D) curve for smaller size range(<0.8 ㎛) has a steep slope but the N(D) curve for size range 0.8∼2.5 ㎛ has a more gentle slope. For example, the number concentration is significantly decreased from 31.73 particles/㎝

3

to 0.77 particles/㎝

3

in changing size range from 0.35 ㎛

to 0.7 ㎛, whereas the concentration is decreased a little from 0.96 particles/㎝

3

to 0.54 particles/㎝

3

in changing size range from 0.8 ㎛ to 2.0 ㎛.

3.2. Ionic composition of PM

2.5

Fig. 3 shows the water soluble ionic concentrations in PM

2.5

collected at Gosan site in Jeju during experimental period. The levels of non-sea-salt sulfate(nss-SO

42-

) and non-sea-salt calcium(nss-Ca

2+

) were estimated using the following equations :

nss-SO

42-

= SO

42-

- (SO

42-

/Na

+

)

seawater

⋅Na

+

nss-Ca

2+

= Ca

2+

- (Ca

2+

/Na

+

)

seawater

⋅Na

+

where (SO

42-

/Na

+

)

seawater

and (Ca

2+

/Na

+

)

seawater

are the concentration ratio of SO

42-

to Na

+

and that of Ca

2+

to Na

+

in seawater, which are 0.251 and 0.04, respectively(Lee et al., 2011; Watanabe and Honoki, 2003).

Maximum concentration levels are shown by SO

42-

at 6.31 ㎍/㎥, followed by NH

4+

, NO

3-

and Na

+

at

2.17, 1.74 and 0.48 ㎍/㎥, respectively. Relatively

lower levels are recorded for Cl

-

, K

+

, Ca

2+

and Mg

2+

(7)

Fig. 3. Box plots of the water soluble ionic concentration in PM

2.5

. at 0.31, 0.20, 0.18 and 0.08 ㎍/㎥, respectively. And

the concentrations of nss-SO

42-

and nss-Ca

2+

in PM

2.5

are measured at 6.19 and 0.16 ㎍/㎥. It is known that nss-SO

42-

is originated from anthropogenic sources and nss-Ca

2+

seems to be derived from soil(Lee et al., 2011; Watanabe et al., 2006). The concentration ratio of nss-SO

42-

to total SO

42-

is 98.1%, and the ratio of nss-Ca

2+

to total Ca

2+

is 88.9%.

From these results, we can see that the major ionic components in PM

2.5

are SO

42-

, NH

4+

and NO

3-

, which are mainly originated from anthropogenic sources, although the measurement site is adjacent to the seashore. It has been assumed that the fine particles(<2.5 ㎛) are mainly generated from traffic, combustion and secondary formation in atmosphere (Buzorius et al., 1999; Sharma et al., 2011). Most of water soluble ionic concentrations in PM

2.5

are slightly low, but the concentrations of Na

+

and Cl

-

are similar level, as compared with other data obtained at same site in 2008(Lee et al., 2011). And the concentration ratio of SO

42-

/NO

3-

is shown 3.64 in this study, whereas the value in urban area has been

reported 1.62(Jung and Han, 2008). It is suggested that the SO

42-

/NO

3-

ratio is greatly high due to no large NO

x

emission sources in the measurement site in this study(Lee et al., 2011).

The ionic composition of PM

2.5

is effected by atmospheric conditions, therefore the composition has seasonal variation. The seasonal averages of the water soluble cations(a) and anions(b) concentrations in PM

2.5

are shown in Fig. 4. The sum of ionic concentrations in spring season are significantly high as compared with those in other season, especially for nss-SO

42-

, NH

4+

, and NO

3-

originated from anthropo-

genic sources. However, the concentrations of ionic

components mainly originated from the sea, such as,

Na

+

, Cl

-

, K

+

and Mg

2+

, are highest in winter season. It

seems that the reason of this result is due to frequent

strong wind and wind direction from the sea in winter

season. On the other hand, in summer season, the

lowest concentration levels are observed for overall

components as well as the sum of them. It can be

assumed that the water soluble ionic concentrations

in PM

2.5

are very low depending upon scavenging by

(8)

Fig. 5. Correlation coefficient between the water solube ionic concentrations and the size-separated number concentrations of PM

2.5

.

Fig. 4. Seasonal averages of the water solube cation(a) and anion(b) concentration in PM

2.5

.

a large amount of precipitation in summer season (Hieu and Lee, 2010; Lee et al., 2011).

3.3. Comparison of the number concentration and the ionic composition

The Pearson correlation analysis has been carried out between the number concentrations and the water soluble ionic concentrations in PM

2.5

. The correlation

coefficients between the size-separated number concentrations and the water soluble ionic concentrations are given in Fig. 5. It brings out two categories of ionic components : those showing negative correlation with particle size, including NH

4+

, K

+

, and nss-SO

42-

,

and those showing slightly positive correlation with

particle size in the range of 0.25 ∼ 0.65 ㎛, but

negative correlation with particle size in the range of

(9)

0.65 ∼ 2.5 ㎛ , including Na

+

, ss-Ca

2+

, nss-Ca

2+

, Mg

2+

, ss-SO

42-

, Cl

-

and NO

3-

. The Pearson correlation analysis shows a high correlation (r>0.8) between the number concentrations for smaller size range(<0.4

㎛) and nss-SO

42-

and NH

4+

concentrations. In addition, nss-SO

42-

and NH

4+

are significantly correlated with(r>0.6) the number concentrations in the size range 0.40∼0.58 ㎛, but nss-SO

42-

and NH

4+

are moderately correlated with(r≒0.4) the number concentrations in the size range larger than 0.58 ㎛. It is believed, from these results, that nss-SO

42-

and NH

4+

are major ionic components of fine mode particles(size<0.4 ㎛) in PM

2.5

. And K

+

ion is significantly correlated with the number concentrations in the size range smaller than 0.58 ㎛. However, the other ions are hardly correlated with the number concentrations in overall size ranges.

  Factor 1 Factor 2 Factor 3

NC

0.25-0.28*

0.34 0.91 -0.14

NC

0.28-0.30

0.16 0.98 -0.03

NC

0.30-0.35

0.13 0.98 0.09

NC

0.35-0.40

0.14 0.95 0.23

NC

0.40-0.45

0.37 0.83 0.39

NC

0.45-0.50

0.61 0.66 0.42

NC

0.50-0.58

0.66 0.56 0.49

NC

0.58-0.65

0.85 0.33 0.39

NC

0.65-0.70

0.90 0.25 0.32

NC

0.70-0.80

0.93 0.22 0.26

NC

0.80-1.0

0.96 0.20 0.15

NC

1.0-1.3

0.98 0.20 0.06

NC

1.3-1.6

0.98 0.20 0.01

NC

1.6-2.0

0.97 0.20 -0.01

NC

2.0-2.5

0.97 0.20 -0.06

Eigenvalue 8.25 5.53 1.01

Variance(%) 54.97 36.85 6.71

Cumulative(%) 54.97 91.82 98.53

Table 3. Varimax normalized rotated factor loadings of the size-separated PM

2.5

number concentrations

Factor analysis for the size-separated number concentrations of PM

2.5

has been carried out, as seen in Table 3, to classify the sources of PM

2.5

with size.

Factor analysis with Varimax normalized rotation for the size-separated PM

2.5

number concentrations yields 3 factors, constituting more than 98% of total variance.

First factor with maximum variance (54.97%) shows higher factor loadings for NC

0.58-0.65

∼ NC

2.0-2.5

, and moderate factor loadings for NC

0.45-0.50

∼ NC

0.50-0.58

. Factor 2 has high factor loadings of NC

0.25-0.28

∼ NC

0.40-0.45

and moderate factor loadings of NC

0.45-0.50

∼ NC

0.50-0.58

which accounts for 36.85% of total

variance, but factor 3 is associated with very low factor loadings for overall size range which accounts for 6.71% of total variance. It can be suggested from these results that the sources of PM

2.5

are evidently classified into two group based on particle size 0.5

㎛.

Also, factor analysis for the water soluble ionic concentrations has been carried out to identify the sources of ionic components in PM

2.5

, then the result is shown in Table 4. The result shows three factors with a total variance of 85.56%. Factor 1, with higher factor loadings of Na

+

, ss-Ca

2+

, ss-SO

42-

, NO

3-

and Cl

-

, at 34.62% of total variance, is believed to originate from the sea. Factor 2, with higher factor loadings of NH

4+

, K

+

and nss-SO

42-

, at 28.89% of total variance, is contributed by anthropogenic sources. These ionic components in factor 2 are significantly correlated with the number concentrations in the size range smaller than 0.5 ㎛, as mentioned above. And factor 3, with higher factor loadings of nss-Ca

2+

and Mg

2+

, at 22.06% of total variance, is suggested to originate from soil. A similar result has been reported by Lee et al.(2011) from previous research performed at same site with this study(Jung and Han, 2008; Lee et al., 2011).

From the results of the correlation and factor

analysis for the number and ionic concentrations of

PM

2.5

, it can be found that the smaller parts(<0.5 ㎛)

(10)

of PM

2.5

is contributed by anthropogenic sources, but the sources of the remaining parts of PM

2.5

are not able to be specified in this study.

  Factor 1 Factor 2 Factor 3

NH

4+

0.12 0.95 -0.05

Na

+

0.98 -0.01 0.15

K

+

0.11 0.70 0.23

nss-Ca

2+

0.14 0.10 0.97

ss-Ca

2+

0.98 -0.01 0.15

Mg

2+

0.48 0.33 0.69

nss-SO

42-

-0.04 0.96 0.12

ss-SO

42-

0.98 -0.01 0.15

Cl

-

0.51 0.33 0.04

NO

3-

0.84 0.05 0.40

Eigenvalue 4.15 3.47 2.65

Variance(%) 34.62 28.89 22.06

Cumulative(%) 34.62 63.51 85.56

Table 4. Varimax normalized rotated factor loadings of the water soluble ionic concentrations in PM

2.5

4. Conclusions

The number concentrations and the ionic concent- rations of PM

2.5

have measured at Gosan site in Jeju, Korea, from March 2010 to December 2010. The feature of the number concentrations and the ionic compositions of PM

2.5

have found from measuring data. And the correlation and factor analysis for the number and the ionic concentrations of PM

2.5

are performed to identify their sources. Results derived from this study are summarized as follows:

PM

2.5

number concentrations vary from 22.57 to 975.65 particles/㎝

3

with an average value of 240.41 particles/㎝

3

, which are significantly decreased with increasing particle size and very high in spring season. The concentrations measured in this study are low as compared to other previous researches performed in urban area.

Maximum ionic concentration levels are shown by

SO

42-

at 6.31 ㎍/㎥, followed by NH

4+

, NO

3-

and Na

+

, and relatively lower levels are recorded for Cl

-

, K

+

, Ca

2+

and Mg

2+

. Most of water soluble ionic concentrations in PM

2.5

in this study are slightly low, but the concentrations of Na

+

and Cl

-

are similar level, as compared with other data obtained in previous research at same site. The concentrations of nss-SO

42-

, NH

4+

, and NO

3-

are very high in spring season, but the levels of the ions mainly originated from the sea are highest in winter.

NH

4+

, K

+

and nss-SO

42-

concentrations and the size-separated number concentrations are negatively correlated with size, which shows a high correlation in smaller size range(<0.5 ㎛), but the other ions are hardly correlated with the number concentrations in all size range.

It can be suggested, from the factor analysis, that PM

2.5

are evidently classified into two group based on particle size 0.5 ㎛, and NH

4+

, K

+

and SO

42-

come from anthropogenic sources, Na

+

, Cl

-

and NO

3-

come from the sea, Ca

2+

and Mg

2+

come from soil.

Consequently, it can be found that the smaller parts (<0.5 ㎛) of PM

2.5

is contributed by anthropogenic sources, but the sources of the remaining parts of PM

2.5

are not able to be specified in this study.

Acknowledgements

This research was supported by the 2013 scientific promotion program funded by Jeju National University.

References

Bigi, A. B., Ghermandi, G., 2011, Particle number size distribution and weight concentration of background urban aerosol in a Po Valley site, Water Air Soil Pollut., 220, 265-278.

Buzorius, G., Hämeri, K., Pekkanen, J., Kulmala, M., 1999, Spatial variation of aerosol number concentration in Helsinki city, Atmos. Environ., 33, 553-565.

Hieu, N. T., Lee, B. K., 2010, Characteristics of

(11)

particulate matter and metals in the ambient air from a residential area in the largest industrial city in Korea, Atmos. Res., 98, 526-537.

Jung, J. H., Han, Y. J., 2008, Study on Characteristics of PM

2.5

and Its Ionic Constituents in Chuncheon, Korea, J. of Korean Soc. for Atmos. Environ., 24(6), 682-692.

Kim, N. K., Kim, Y. P., Kang, C. H., Moon, K. C., 2003, Characteristics of Ion Concentrations of PM

2.5

Measured at Gosan: Measurement Data between 1998 and 2002, J. of Korean Soc. for Atmos.

Environ., 19(3), 333-343.

Lee, D. E., Kim, W. H., Ko, H. J., Oh, Y. S., Kang, C.

H., 2013, Chemical Composition Characteristics of Size-fractionated Particles during Heavy Asian Dust Event in Spring, 2010, J. of Korean Soc. for Atmos.

Environ., 29(3), 325-337.

Lee, M. J., Oh, S. N., Kim. E. Y., Chang. K. H., 2006, Relationship between Meteorological Elements and Aerosols Number Concentration at Gosan, Jeju for 2001 ∼ 2003, J. of Korean Soc. of Hazard Mitigation, 6(3), 47-56.

Lee, S. B., Jung, D. S., Cho, E. K., Kim, H. A., Hwang, E. Y., Kang, C. H., 2011, Composition and pollution characteristics of PM10 and PM2.5 particles at Gosan site of Jeju Island in 2008, Analytical Sci. &

Technol., 24(4), 310-318.

Lundgren, D. A., Hlaing, D. N., Rich, T. A., Marple, V.

A., 1996, PM

10

/PM

2.5

/PM

1

Data from a Trichotomous Sampler, Aerosol Sci. and Technol., 25, 353-357.

Park, K. J., Cho, K. S., Choi, B. C., Kim, J. Y., Choi, J.

C., 2001, Characteristics of aerosol number concentration with meteorological factors in Seoul, Atmos., 11(1), 399-401.

Sharma, D. K., Rai, J., Israil, M., Singh, P., 2003, Summer

variations of the atmospheric aerosol number concent- ration over roorkee, india, J. of Atmos. and Solar-Terrestrial Phys., 65, 1007-1019.

Sharma, N. L., Sharma, J. C., Singh, M., Sharma, P., Chand, K., Negi, A. K., Sharma, M., Thakur, H. K., 2011, Atmospheric ultrafine aerosol number concentration and its correlation with vehicular flow at two sites in the western Himalayan region:

Kullu-Manali, India, J. Earth Syst. Sci., 130(2), 281-290.

Song, S. H., Park, D. M., Lee, Y. M., Lee, C. W., Park, J. H., Yu, S. D., 2012, Ambient Fine and Ultrafine Particles Measurements and Their Correlations with Particulate PAHs at an Elementary School Near a Highway, Asian J. of Atmos. Environ., 6(2), 96-103.

Watanabe, K., Honoki, H., 2003, On the Kosa(Asian Dust) Event in November 2002: Aerosol Number Concentrations and Precipitation Chemistry in Toyama, Japan, J. of the Meteor. Soc. of Japan, 81(6), 1489-1495.

Watanabe, K., Kasuga, H., Yamada, Y., Kawakami, T, 2006, Size distribution of aerosol number concentrations and water-soluble constituents in Toyama, Japan: A comparison of the measurements during Asian dust period with non-dust period, Atmos. Res., 82, 719-727.

Yan, F., Hu, H., Yu, T., 2004, Analysis of particulate mass concentration, aerosol number concentration and visibility in Beijing, China Particuology, 2(1), 25-30.

Stanier, C. O., Khlystov, A. Y., Pandis, S. N., 2004,

Ambient aerosol size distributions and number

concentrations measured during the pittsburgh air

quality study (PAQS), Atmos. Environ., 38,

3275-3284.

수치

Fig. 1. Location of the measurement site and surrounding region.
Table 1. Statistic summary of the number concentration of the atmospheric PM2.5 sampled at Gosan in Jeju                               (Unit : particle/c㎥)IC(907 IC pump, 732 IC detector).
Table 2 shows the seasonal averages of the atmos-  pheric PM 2.5  number concentrations
Fig. 2. Size distribution of the entire averaged PM2.5 number concentration during experimental period.
+5

참조

관련 문서