health and amenity features of agriculture. Recently, ag- riculture including rice culture is at a turning point from conventional farming which uses various agricultural pesticides to environmentally friendly farming or organic farming which uses environment friendly substances for plant pest and disease control worldwide including Korea for food security and sustainable agriculture. Agri-envi-
https://doi.org/10.11626/KJEB.2019.37.3.317
IntroductIon
Rice (Oryza sativa L.) is the most important staple crops in East and South Asia, the Middle East, Latin America, and the West Indies. Rice is normally grown as an annual plant with irrigated water. Over the last ten years, there has been an increased awareness of environment, human
Original article
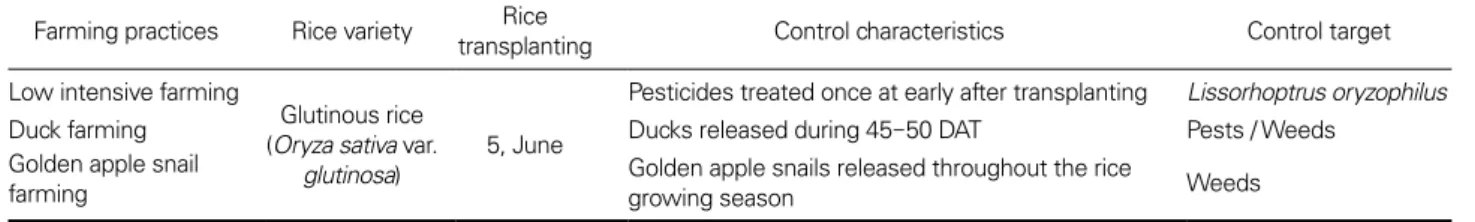
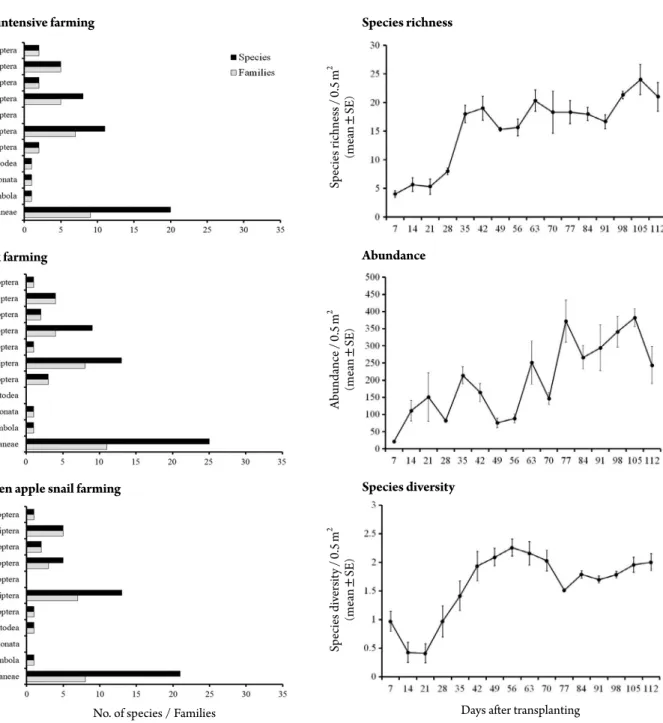
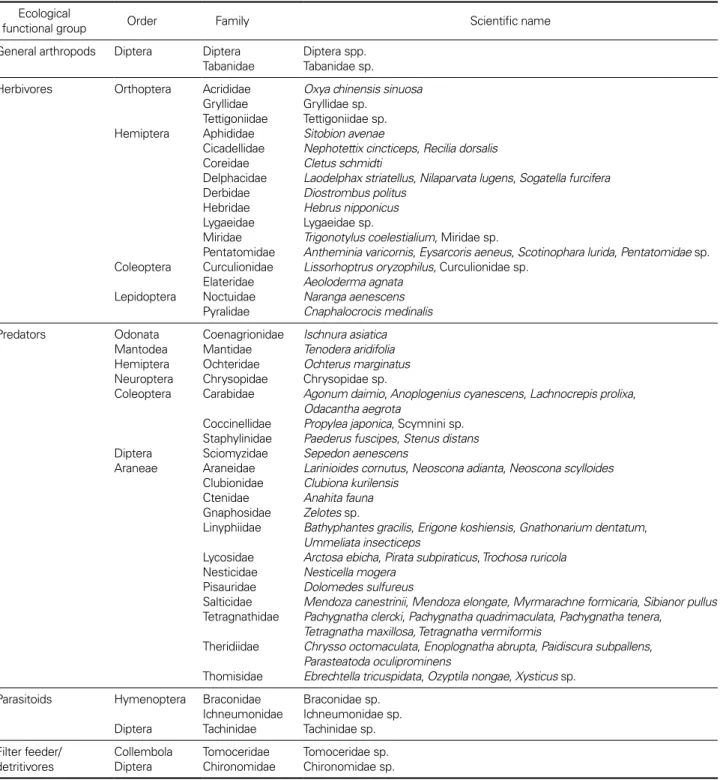
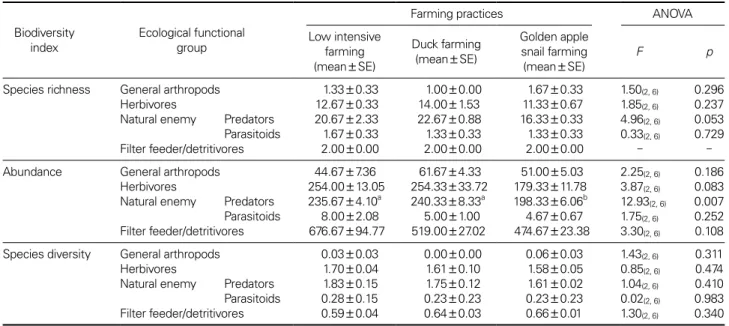
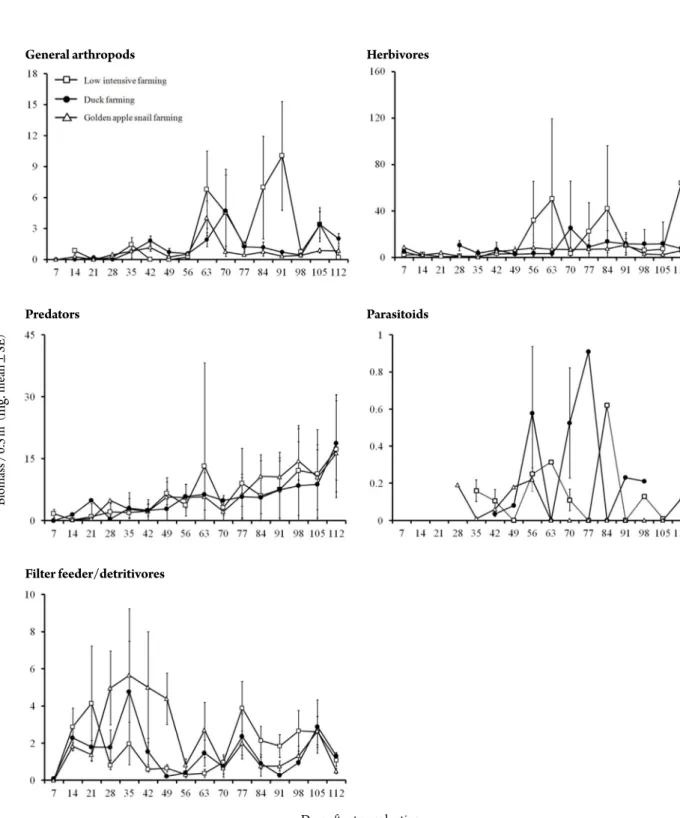
Comparative analysis of terrestrial arthropod community and biomass in differently managed rice fields in Korea
Sue-Yeon Lee, Myung-Hyun Kim 1 , Jinu Eo 1 , Young Ju Song 1 and Seung-Tae Kim 2, *
Division of Microorganism Resources, National Institute of Biological Resources, Incheon 22689, Republic of Korea
1
Climate Change & Agroecology Division, Department of Agricultural Environment, National Institute of Agricultural Sciences, RDA, Wanju 55365, Republic of Korea
2