Vol. 23, No. 3, pp. 279-286, May 31, 2017, ISSN 1229-3431(Print) / ISSN 2287-3341(Online) https://doi.org/10.7837/kosomes.2017.23.3.279
11. Introduction
For marine traffic, anchorage refers to an area with sufficient volume for safe berthing, smooth maneuvering, and cargo working.
Also, anchorage can be designated as an entry obstacle, waiting area, bunking area, or space for the supply of goods according to the circumstances of a given port.
In order to designate which berths play an important role in the operation of a port, size and capacity should be determined according to the relevant design standards.
This study was conducted to analyze the adequacy of anchorage volume both domestically and internationally. Jia (2011) and Xiaoliang et al. (2012) implemented a port transportation system through computer simulation to examine the appropriateness of the port capacity of Dalian Port. In addition, Jun (2013) and Zhang (2013) designed "Arrival - Inbound - Cargo Operation - Departure"
procedures through mathematical methods and presented conclusions regarding the volume of anchorage in Tianjin Port.
In Korea, Lee and Lee (2014) conducted a study on the appropriateness of anchorage according to the volume of a port in Pyeongtaek, and Park (2016) conducted a simulation of a maritime transportation system centering on berthing to examine the appropriateness of Ulsan Port berth size and consider the necessity
jmpark@kmou.ac.kr, 051-410-4206
of expansion.
However, existing research is targeted only at specific ports, which limits the results.
Because it is essential to present a function that can be generally applied in order to easily, objectively, and quantitatively determine volume of anchorage along with increases in port cargo volume and the number of inbound vessels.
In this study, ports are classified into three types according to the types of vessels present. The anchorage volume analysis method in order to review appropriateness and suggest a reasonable model to estimate what volume will be necessary when considering future maritime traffic. The correlation between anchorage volume and port trade volume was also analysed. Finally, this paper proposes and verifies a relevant function using regression analysis.
The results presented in this paper can be used as a safety analysis tool for anchorage, to ensure harbor safety.
2. Classification of ports by ships characteristics
The characteristics of cargo, waiting time in anchorage, and number of ships present vary by port. For example, if the cargo in question is bulk freight, the waiting time of a ship in anchorage will be longer. Also, due to the characteristics of bulk freight, since more time is required for loading and unloading the cargo, the waiting time for other ships will also increases.
A Study on the Establishment of Design Criteria for Anchorage According to Port Characteristics
Jun-Mo Park*
* Sea Training Center of the Korea Maritime and Ocean University, Busan 49112, Korea
Abstract : This study suggests design criteria to evaluate the availability of anchorage in Korea to contribute to ship safety by presenting necessary design criteria for anchorage volume according to port development. Accordingly, the concept of “necessary volume of anchorage” is introduced to evaluate the volume of anchorage available in Korea’s major ports, and classify these ports into three types according to the characteristics of incoming ship. Numerical simulations designed using MATLAB-SIMULINK have been carried out to track the irregularly of arrival and, waiting times along with the environmental conditions that affect anchorage and necessary volume of anchorage have been suggested based on these tests. Finally, in order to complete a function equation analysis, the necessary volume of anchorage with reference to cargo volume is addressed using regression analysis as follows. Group A - , Group B - , Group C - . This study contributes to a review of anchorage volume from the perspective of harbor development.
Key Words : Design Criteria, Necessary Volume of Anchorage, MATLAB-SIMULINK, Port Characteristics, Cargo volume, Regression Analysis
On the other hand, a port that mainly deals with containers (specialized ships) will tend to focus on punctuality due to the characteristics of this cargo, and ships will also try to enter and gain clearance on schedule. For unloading cargo, exclusively prepared piers will allow the process to be completed within a short period of time. Therefore, compared with ports that mainly handle bulk freight, the waiting time in anchorage for ports dealing with containers will be short and the number of ships using such a port will be less.
For this reason, since the capacity of a port differs due to cargo and ship types, the main type of cargo and the entrance and clearance characteristics of ships were used to classify different types of ports.
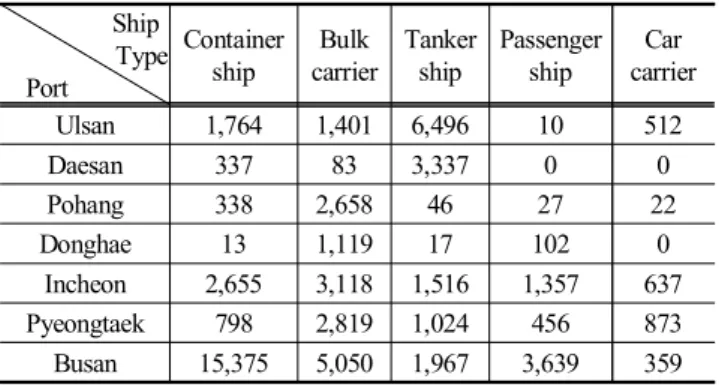
2.1 Number of ships entering major ports in Korea To analyze the major types of ships entering ports, data from 2016 (Ministry of Oceans and Fisheries, 2016) provided by the Shipping and Port Integrated Data Center (SP-IDC) was used to analyze the types of ships in each port. The results are shown in Table 1.
Ship Type Port
Container ship
Bulk carrier
Tanker ship
Passenger ship
Car carrier
Ulsan 1,764 1,401 6,496 10 512
Daesan 337 83 3,337 0 0
Pohang 338 2,658 46 27 22
Donghae 13 1,119 17 102 0
Incheon 2,655 3,118 1,516 1,357 637
Pyeongtaek 798 2,819 1,024 456 873
Busan 15,375 5,050 1,967 3,639 359
Table 1. Analysis of vessel types in ports
(Unit : Number of ships)
2.2 Classification of ports according to characteristics Ports with more than 50% of a particular type of ship as total incoming vessels were classified in the same category. Other cases have been classified as complex ports.
The results of classifying ports according to incoming ship types are as follows: Ulsan Port (64%) and Daesan Port (89%) had mostly ships with refined petroleum products and chemicals;
Pohang Port (86%) and Donghae Port (89%) had general cargo and bulk ships; and Incheon, and Pyeongtaek Port had various ships. Therefore, based on this data, ports were classified into the 3 groups, A, B, and C, as shown in Fig. 1.
Fig. 1. Classification of ports via vessel type.
3. Method for analyzing anchorage volume
To analyze the appropriateness of anchorage volume, considering the psychological influence on a ship’s operator of using anchorage along with the logistic characteristics of a port, it is essential first to establish design criteria for defining the area of anchorage. For this, as an index for analyzing anchorage volume while considering traffic-related environmental characteristics, the concepts of occupied capacity of anchorage and required anchorage volume as suggested by Usui and Inoue (1999) and Park (2016) were used. The following is a description of these concepts.
3.1 Average occupancy volume of anchorage,
Ships using anchorage vary by ton, waiting time, and environmental impact. Therefore, the occupied capacity of anchored ships changes as time passes. In order to evaluate anchorage volume, anchorage volume at a predetermined point of time should be established. Likewise, the occupied volume of anchorage shall be defined as shown in Equation (1).
(1)
Where - Total volume of occupancy(km2) at time (occupancy volume as derived from a
computerized, numerical simulation with reference to the number of incoming ships’ anchorage, waiting time, ship capacity, environmental factors, etc.)
The design standards for anchorage require the radius of anchorage to be calculated according to seabed conditions and
wind scale on the basis of the length over all (LOA) of ships and the depth (D) of anchorage. Accordingly, the turing radius of anchorage was analyzed on the basis of a single anchor, which is generally used in practice when anchoring. The relevant formula is as follows in Table 2.
Objective Bottom Radius
Waiting or cargo operation
Good L(Ship Length)+6D(Depth)
Bad L+6D+30
Table 2. Capacity of anchorage guidelines
3.2 Necessary volume of anchorage,
Occupied anchorage capacity differs according to entrance time, irregularities in waiting time, diversity in ship size, etc.
Considering also psychological aspects and navigational habits of ship operators, the required area for a harbor can be defined, as shown in Equation (2).
× (2)
Where - Average Occupancy Volume of Anchorage - The standard deviation of the distribution of
occupancy volume based on numerical simulation (hereafter referred to as “SD”)
4. Numerical simulation for anchorage volume analysis
4.1 Numerical simulation design
Algorithm design and a simulation model are necessary for anchorage volume analysis. In this study, complex mathematical operations and simulations of various conditions were completed using MATLAB-SIMULINK Ver. 2015 (Korea Maritime and Ocean University).
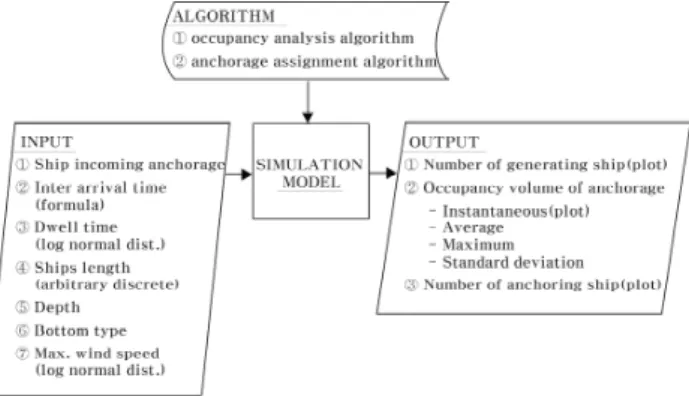
The anchorage volume analysis simulation concept is shown in Fig. 2, including a system for entering variables into the simulation model. This system was used to output analysis data using various algorithms.
Fig. 2. System architecture for anchorage simulations.
1) Simulation model algorithm design
The simulation model algorithm consists of "ship generation and attribute assignments," which define vessels arriving for anchorage and allocate properties; "anchorage assignments," which allocate anchorable positions; and an "occupancy volume calculation" for analyzing anchorage volume.
The algorithm for this simulation model is shown in Fig. 3.
Fig. 3. Simulation model design.
2) MATLAB-SIMULINK Simulation Design
For anchorage volume analysis, a model was developed using MATLAB-SIMULINK, a commonly-used numerical simulation program. This model was designed to be divided into sub-programs according to the simulation sequence, so that the program can be
modified and supplemented easily. The result is shown in Fig. 4.
Fig. 4. Simulation system model architecture using MATLAB-SIMULINK.
4.2 Model verification of numerical simulation
Model verification was performed by simulating output for Ulsan Port, which is the representative liquid cargo handling port in Korea, and the output anchorage volume was analyzed based on this simulation.
Verification for the numerical simulation model consisted of a comparison of the output data from the simulation with the actual number of ships that entered and anchored in 2015. If the simulation results were less than 20% of the actual data, they were used for the simulation model.
E1 Anchorage
E2 Anchorage
E3 Anchorage Simulation results
(number of ships) 5,538 1,990 1,345
Number of incoming and anchoring ship in
2015
5,779 2,084 1,409
Accuracy rate 95.8 % 95.5 % 95.5 %
Table 3. Verification results for the number of incoming ships and relevant anchorage
E1 Anchorage
E2 Anchorage
E3 Anchorage Simulation results
(number of ships) 17.0 6.8 5.4
Number of incoming and anchoring ship
anchoring ship in 2015
16.9 6.6 5.1
Accuracy rate 100.1 % 103.0 % 105.8 %
Table 4. Verification of the number of anchoring ships
As shown in Tables 3 and Table 4, the model was successfully verified because each figure was lower than 20%, which was the validation criterion for the simulation model.
4.3 Execution and results of numerical simulation Using the simulation model for the analysis of anchorage volume, occupied anchorage volumes in major ports in Korea were derived. The results were used to calculate required anchorage volume.
The period of analysis included 3 years, 2005, 2010, and 2014, in order to reveal changes in annual anchorage volume and easily determine regression result for required anchorage volume using multiple regression.
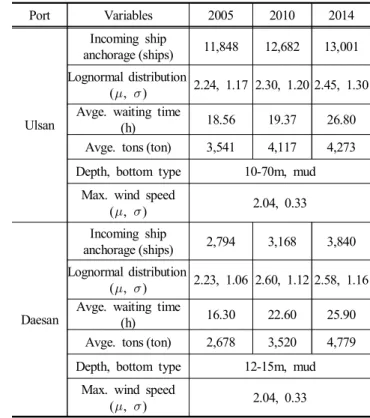
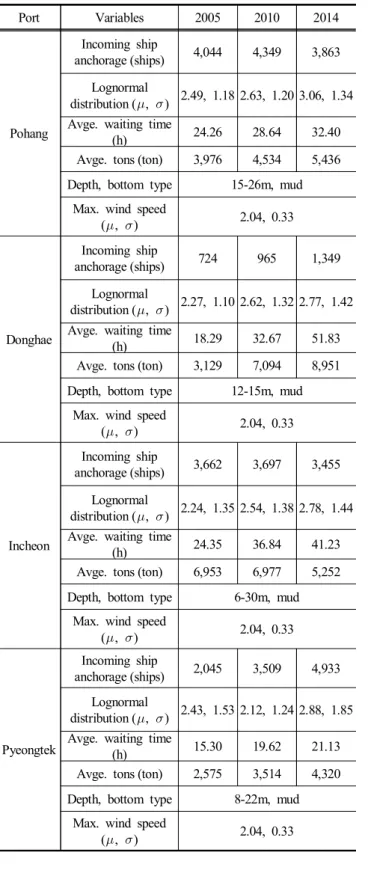
1) Input Variables
For numerical simulation to analyze anchorage, the normalized distribution of entering ship quantity, waiting time in anchorage, average tons of ships entering anchorage, log-normal distribution of maximum wind speed, and depth and type of bottom materials in anchorage were required. This data was analyzed via records for anchorage usage in the years considered, thereby setting the input variables as shown in Table 5.
Port Variables 2005 2010 2014
Ulsan
Incoming ship
anchorage (ships) 11,848 12,682 13,001 Lognormal distribution
(, ) 2.24, 1.17 2.30, 1.20 2.45, 1.30 Avge. waiting time
(h) 18.56 19.37 26.80
Avge. tons (ton) 3,541 4,117 4,273 Depth, bottom type 10-70m, mud
Max. wind speed
(, ) 2.04, 0.33
Daesan
Incoming ship
anchorage (ships) 2,794 3,168 3,840 Lognormal distribution
(, ) 2.23, 1.06 2.60, 1.12 2.58, 1.16 Avge. waiting time
(h) 16.30 22.60 25.90
Avge. tons (ton) 2,678 3,520 4,779 Depth, bottom type 12-15m, mud
Max. wind speed
(, ) 2.04, 0.33
Table 5. Input variables by ports
Port Variables 2005 2010 2014
Pohang
Incoming ship
anchorage (ships) 4,044 4,349 3,863 Lognormal
distribution (, ) 2.49, 1.18 2.63, 1.20 3.06, 1.34 Avge. waiting time
(h) 24.26 28.64 32.40
Avge. tons (ton) 3,976 4,534 5,436 Depth, bottom type 15-26m, mud
Max. wind speed
(, ) 2.04, 0.33
Donghae
Incoming ship
anchorage (ships) 724 965 1,349
Lognormal
distribution (, ) 2.27, 1.10 2.62, 1.32 2.77, 1.42 Avge. waiting time
(h) 18.29 32.67 51.83
Avge. tons (ton) 3,129 7,094 8,951 Depth, bottom type 12-15m, mud
Max. wind speed
(, ) 2.04, 0.33
Incheon
Incoming ship
anchorage (ships) 3,662 3,697 3,455 Lognormal
distribution (, ) 2.24, 1.35 2.54, 1.38 2.78, 1.44 Avge. waiting time
(h) 24.35 36.84 41.23
Avge. tons (ton) 6,953 6,977 5,252 Depth, bottom type 6-30m, mud
Max. wind speed
(, ) 2.04, 0.33
Pyeongtek
Incoming ship
anchorage (ships) 2,045 3,509 4,933 Lognormal
distribution (, ) 2.43, 1.53 2.12, 1.24 2.88, 1.85 Avge. waiting time
(h) 15.30 19.62 21.13
Avge. tons (ton) 2,575 3,514 4,320 Depth, bottom type 8-22m, mud
Max. wind speed
(, ) 2.04, 0.33
2) The result of numerical simulation
The resulting required anchorage volume for each port, as calculated by numerical simulation, is shown in Table 6.
The required anchorage volumes for Ulsan and Daesan Ports are
about 5.1-39.3 km2; for Pohang and Donghae Ports, 1.5-15.5 km2; and for Incheon and Pyeongtaek Ports, 14.6-38.7 km2.
Port Year Analysis
Technical analysis
anchorage volume(km2)
(km2)
Min. SD Max.
Ulsan
2005 Volume 22.8 2.5
27.8 24.0
SD 0.01 0.01
2010 Volume 25.1 4.4
28.9 27.3
SD 0.02 0.01
2014 Volume 35.8 7.0
49.7 39.3
SD 0.03 0.02
Deasan
2005 Volume 4.4 1.5
7.3 5.1
SD 0.01 0.006
2010 Volume 8.1 2.3
12.7 9.3
SD 0.01 0.009
2014 Volume 10.7 2.9
16.4 12.1
SD 0.01 0.01
Pohang
2005 Volume 10.2 2.8
15.7 11.6
SD 0.01 0.001
2010 Volume 11.4 3.4
18.3 13.2
SD 0.01 0.01
2014 Volume 13.0 4.9
22.9 15.5
SD 0.02 0.01
Donghae
2005 Volume 0.8 0.1
1.1 0.9
SD 0.02 0.01
2010 Volume 1.4 0.2
1.7 1.5
SD 0.02 0.02
2014 Volume 3.1 0.3
3.7 3.3
SD 0.02 0.007
Incheon
2005 Volume 19.6 2.8
25.2 21.0
SD 0.01 0.001
2010 Volume 27.4 2.9
33.2 28.8
SD 0.01 0.006
2014 Volume 37.1 3.3
43.5 38.7
SD 0.02 0.01
Pyeongtek
2005 Volume 13.1 3.0
19.1 14.6
SD 0.01 0.01
2010 Volume 18.4 3.8
26.0 20.3
SD 0.02 0.02
2014 Volume 27.5 4.7
36.9 29.8
SD 0.01 0.01
Table 6. Resulting anchorage volume
5. Establishing criteria for designing anchorage volume
Volume of anchorage is determined by the number of ships using anchorage, ship scale, waiting time, and environmental conditions in surrounding waters. The scale of ships is determined by cargo volume, the number of ships entering, berth scale, etc.
Therefore, analyzing the relationship between the current status of ports and the required anchorage volume, to suggest design criteria is feasible by completing a review on the appropriateness of anchorage volume during port development, which is the purpose of this study. Likewise, to suggest criteria for designing anchorage, the functional relationship between independent and dependent variables should be investigated. To estimate variables of interest using a functional-based relationship, regression analysis was used.
5.1 Regression analysis on anchorage volume in each port
Groups A, B, and C were derived from an analysis on the types of ships entering each port, and a regression analysis was conducted accordingly. The regression method used required anchorage volume as a dependent variable and cargo volume as an independent variable to conduct simple regression analysis. In order to estimate required anchorage volume, the future number of ships that will enter a port, cargo volume, and number of berths should be estimated. However, in the Basic Plan for Nationwide Ports, which is a long-term plan for domestic ports, only estimated cargo volumes for 10 and 20 years periods were includes. Therefore, by deriving a regression formula for anchorage and cargo volume, the scale of required anchorage was easily estimated.
Regression analysis on anchorage volume for each port group applied a method of curve estimation by assuming the relationship between the two was non-linear (curved regression). Also, to prove the validity of this analysis method, R2 values for linear and curved regression analysis were compared. Here, R2 (the coefficient of determination) was a statistical measure of how close the data were to a fitted regression line. The result with the highest explanation power (Choung et al., 2012) was adopted.
1) Group A, Simple regression analysis
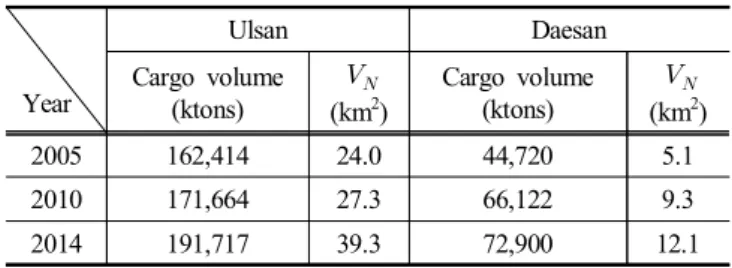
For Ulsan and Daesan Ports, which were classified as Group A, a simple regression analysis on required anchorage and cargo volume was conducted, as shown in Table 7.
Year
Ulsan Daesan
Cargo volume (ktons)
(km2)
Cargo volume (ktons)
(km2)
2005 162,414 24.0 44,720 5.1
2010 171,664 27.3 66,122 9.3
2014 191,717 39.3 72,900 12.1
Table 7. Dependent and independent variables for Ulsan and Daesan Ports
The linear regression analysis model and curved regression model for anchorage volume () and cargo volume() for Group A (Ulsan and Daesan Ports), are shown in Fig. 5.
Fig. 5. Group A regression analysis trend line.
2) Group B, Simple regression analysis
For Pohang and Donghae Ports, which were classified as Group B, a simple regression analysis on required anchorage and cargo volume was conducted as shown in Table 8.
Year
Pohang Donghae
Cargo volume (ktons)
(km2)
Cargo volume (ktons)
(km2)
2005 54,692 11.6 19,923 0.9
2010 63,108 13.2 28,030 1.5
2014 65,241 15.5 32,540 3.3
Table 8. Dependent and independent variables for Pohang and Donghae Ports
The linear and curved regression analysis for anchorage volume () and cargo volumes for Group B (Pohang and Donghae Ports) are shown in Fig. 6.
Fig. 6. Group B regression analysis trend line.
3) Group C, Simple regression analysis
For Incheon and Pyeongtaek Ports, which were classified as Group C, a simple regression analysis on required anchorage and cargo volume was conducted as shown in Table 9.
Year
Incheon Pyeongtaek
Cargo volume (ktons)
(km2)
Cargo volume (ktons)
(km2)
2005 126,453 25.1 42,514 14.6
2010 149,785 28.8 76,681 20.3
2014 150,083 32.4 117,012 29.8
Table 9. Dependent and independent variables for Incheon and Pyeongtaek Ports
The linear and curved regression analysis model for anchorage volume () and cargo volume () for Group C (Incheon and Pyeongtek Ports) are shown in Fig. 7.
Fig. 7. Group C regression analysis trend line.
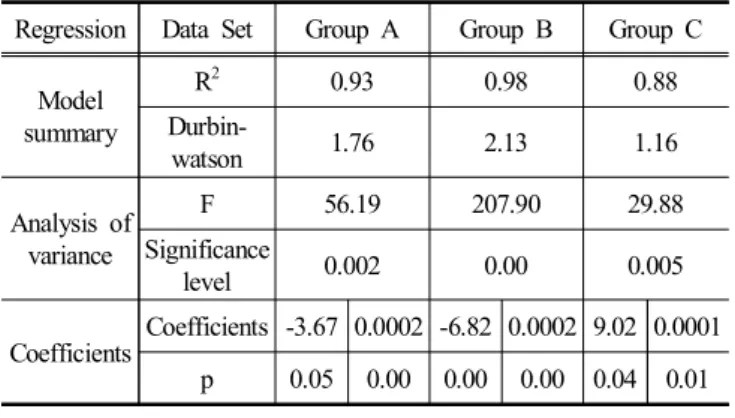
5.2 Verification of anchorage volume regression model Statistical analysis using SPSS was carried out in order to test the significance of these formulas via regression analysis; the
findings are as follows in Table 10.
The result of a suitability analysis of the regression model revealed that the explanatory power of all formulas was over 80%, and the Durbin-watson test gave results within a range of 1-3, confirming the independence of residuals. The result of a significance test for the dispersion model, indicated that the significance probabilities against "F" 0.05, suitable for a regression model. Furthermore, a test for significance on the regression coefficients was conducted and the levels of significance (p) were 0.05, 0.04, and 0.01, as shown in Table 10, statistically accurate at a level of 95 % or more.
Regression Data Set Group A Group B Group C Model
summary
R2 0.93 0.98 0.88
Durbin-
watson 1.76 2.13 1.16
Analysis of variance
F 56.19 207.90 29.88
Significance
level 0.002 0.00 0.005
Coefficients Coefficients -3.67 0.0002 -6.82 0.0002 9.02 0.0001
p 0.05 0.00 0.00 0.00 0.04 0.01
Table 10. Descriptive statistics for regression analysis
6. Conclusions
Considering the entrance and clearance characteristics of ships and cargo types, Korean ports were classified into 3 groups, A, B, and C. Futhermore, required anchorage volume was determined as a dependent variable, and cargo volume was assigned as a independent variable to conduct a simple regression analysis with curve estimation. By comparing R2 values, the result with the highest explanatory power was adopted. As a consequence, statistically significant anchorage volume models to provide design criteria for each port group were suggested, as shown in Table 11.
The models were linear for all groups.
Port Group Design Criteria for Anchorage Volume
Group A
Group B
Group C
Table 11. Summary of anchorage volume design criteria
In this study, a numerical simulation was used to analyze anchorage volume. Required anchorage volume was derived and used as a base to conduct a regression analysis, thereby suggesting design criteria for anchorage volume, which was verified. This model for analyzing anchorage volume using simulation is meaningful since it takes into consideration maritime transportation systems that actually exist. Also, since the present study shed light on the relationship between the anchorage volume and cargo volume of a port, it enabled a review of anchorage volume from the perspective of harbor development.
In the future, additional studies analyzing the correlation between required anchorage area and such traits as cargo volume, berth size, number of ships entering a port, docking time, etc.
should be conducted to quantitatively suggest the area of anchorage that should be designated according to increasing berth and cargo volume. Also, in case of demurrage, some ships do not queue in anchorage space, drifting on the open sea without mooring or temporarily standng by in seas not designated as anchorage, entering port by adjusting navigational speed. Therefore, additional studies should be conducted to consider this behavior via simulation as well, included such drifting ships along with those using anchorage. Moreover, since there are limitations to objectivity when conducting regression analysis, additional data on anchorage should be secured to perform further simulation and regression.
The present study is the first to establish design criteria for determining required anchorage volume. In the future, this model should be applied to ports outside Korea to verify its validity. By applying a range of variables in the simulation algorithms and regression analysis, details could be reconstructed to suggest design criteria for anchorage volume while accurately considering actual anchorage situations.
References
[1] Choung, E. M, M. H. Cho and S. C. Kim(2012), The Study on the Relationship of Customer Contact Factors and Customer Satisfaction Through Curve Liner Analysis, Journal of Tourism Studies, Vol. 24, No. 1, pp. 117-139.
[2] Jia, S. S.(2011), Research on Optimal Number of Anchorage for a Port Based on Queueing Theory, Dalian Maritime University, p. 48.
[3] Jun, H. R.(2013), A Study on the Anchorage Capacity and Planning of Jiujiang port, Wuhan University of Technology,
p. 85.
[4] Lee, C. H. and H. H. Lee(2014), A Study on Expansion of Anchorage According to Increased Trading Volume at Pyeongtaek Port, The Journal of the Korean Society of Marine Environment & Safety, Vol. 20, No. 6, pp. 663-670.
[5] Ministry of Oceans and Fisheries(2016), http://www.spidc.
go.kr.
[6] Park, J. M.(2016), A Study on the Method of Representing Anchorage Using Occupancy Rate(Simulation Based on Ulsan E Anchorage), The Journal of the Korean Society of Marine Environment & Safety, Vol. 22, No. 2, pp. 167-173.
[7] Usui, H. and K. Inoue(1999), A Method to Estimate Available Number of Anchorage. Japan Institute of Navigation, Vol, 101, pp. 151-160.
[8] Xiaoling, M., Y. Xiang and L. Kezhong(2012), Scale of Anchorage Simulation Based on Multi-Leveal Queuing Model, Journal of Wuhan University of Technology, Vol. 36, No. 3, pp. 594-598.
[9] Zhang, F. L.(2013), Research on the Demand of the Number of Anchorage Base on the Traffic Simulation, Dalian Maritime University, p. 43.
Received : 2017. 05. 12.
Revised : 2017. 05. 26.
Accepted : 2017. 05. 29.