A Flow Analysis Framework for Traffic Video
Lu-Shuang Bai * Ying Xia ** Sang-Chul Lee ***
Abstract The fast progress on multimedia data acquisition technologies has enabled collecting vast amount of videos in real time. Although the amount of information gathered from these videos could be high in terms of quantity and quality, the use of the collected data is very limited typically by human-centric monitoring systems. In this paper, we propose a framework for analyzing long traffic video using series of content-based analyses tools. Our framework suggests a method to integrate theses analyses tools to extract highly informative features specific to a traffic video analysis. Our analytical framework provides (1) re-sampling tools for efficient and precise analysis, (2) foreground extraction methods for unbiased traffic flow analysis, (3) frame property analyses tools using variety of frame characteristics including brightness, entropy, Harris corners, and variance of traffic flow, and (4) a visualization tool that summarizes the entire video sequence and automatically highlight a collection of frames based on some metrics defined by semi-automated or fully automated techniques. Based on the proposed framework, we developed an automated traffic flow analysis system, and in our experiments, we show results from two example traffic videos taken from different monitoring angles.
Keywords:Content-based Analysis, Flow Analysis Framework, Traffic Video
This research was supported by a grant(07KLSGC05) from Cutting-edge Urban Development - Korean Land Spatialization Research Project funded by Ministry of Construction & Transportation of Korean Government.
***
MS Student, Sino-Korea GIS Research Center, Chongqing University of Posts and Telecommunications, [email protected]
***
Professor, Sino-Korea GIS Research Center, Chongqing University of Posts and Telecommunications, [email protected]
***
Professor, Department of Computer and Information Engineering, Inha University, [email protected](corresponding author) Manuscript received:2009.05.12 Revised:2009.06.19 Accepted:2009.06.20
1. Introduction
During recent years, rapid advancement of visual material application urgently need a corresponding growth in the need for automatically extracting key information from images and videos, which is the ba- sis of scene analysis, indexing and content‐based retrieval. Video is the image sequence which has strict order in succession and there is strong perti- nence between neighbor frames. Shot, the important element of video, is defined as series of interrelated consecutive frames representing a continuous action in time and space, which is contiguously taken by a single camera[1].
The automatic partitioning of video into shots in- volves the detection of shot transitions. A transition is the boundary between two shots. There are two types of transitions: abrupt and gradual. An abrupt transition is an instantaneous change from one shot to another, with no transitional frames between two shots, which is also known as a cut, which is an
abrupt shot change occurs in a single frame. For gradual transition, fade, dissolve and wipe are three common types of it. Fade is a gradual diminishing or heightening of visual intensity, which always named as fade‐out and fade‐in. Dissolve is a combination of fade‐out and fade‐in with some overlap. Wipe is a transition from one scene to another wherein the new scene is revealed by a moving boundary. The wipe transition can be either horizontal, vertical, di- agonal or some other fancy types[2]. The detection of gradual transition is more difficult than that of abrupt cut, which need distinguish the operation of camera or objects movement.
Different with the ordinary videos, traffic videos have their own marked characteristics. Traffic‐data collection is an important issue for road‐traffic con- trol, which has some requirements for real‐time in- formation and traffic‐parameter estimation, such as road‐traffic intensity, lane occupancy, congestion level, estimation of journey time, etc[3].
Much effort has been made to meet the need of
traffic video analysis, and many traffic surveillance systems have been built for application, some of which have good results[15,16]. In this paper, we propose a framework for analyzing long traffic video using series of content‐based analyses tools. Based on the proposed framework, we also develop an auto- matic traffic flow analysis system and make experi- ments on two example traffic videos taken from dif- ferent monitoring angles.
The rest of our paper is organized as follows.
Section 2 introduces some methods for video shot detection, and presents the related work about traffic video surveillance system. In Section 3, we describe the flow analysis framework for traffic video. In Section 4, the experimental results are detailed.
Finally, the conclusion is presented in Section 5.
2. Related work
Shot detection, which also known as shot boundary detection or transition detection, is fundamental to kinds of video analysis and application, since it is a critical factor for segmenting a video into its basic components: the shots.
The detecting of shot changes depends on the suit- able choice of the decision function between two frames. The functions are mainly based on pixel‐
based methods or histogram‐based methods. In de- tail, some researchers used intensity histogram, edge change ratio (ECR), hue, saturation, or other features as the dissimilarity function. In [1], an adaptive threshold which applied histogram differences of a sliding window is used for abrupt shot change detection. In addition, dividing a selected frame into a fix number of blocks and performing an analysis of block‐wise histogram difference are used to detect gradual shot changes.
As for the video segmentation, the selection of threshold is always critical to the final result. In some video shot detection methods, the detection de- cision is based on a hard threshold of some dissim- ilarity measures, which is determined by many experiments. But in some situation, one fixed thresh- old may be not applicable enough for kinds of videos.
In [4], an adaptive threshold which is applied for his- togram differences of a sliding window is used.
The vehicle detection and tracking system is a very important part of Intelligent Traffic System (ITS), which always consists of three modules: re- gion of interesting (ROI), vehicle detection, and ve- hicle tracking modules. The purpose of ROI ex-
traction is to do rude segmentation on the vehicle in the traffic video, extracting the possible area of ve- hicle from the complex traffic scene for subsequent detection and tracking operation. The methods of this include analysis on the time domain, space domain, and spatio-temporal domain, among which the time domain analysis is the most important, owing to the special characteristics of video images. In other words, the detection of a pixel mainly depends on the pixels at the same location in the video sequence, in- stead of the surrounding pixels of the same frame.
The Frame difference method, background difference method, and unsupervised segmentation method are mainly used for ROI extraction[5].
Furthermore, in [3][6][7], robust techniques for background subtraction of urban traffic video are recounted. Other analysis methods for traffic video, like classification and tracking of vehicles[8][9], on‐
line anomaly detection[10], recognition and online route tracing[11] are also described. Additionally, P.Kumar, et al. had proposed a framework for real‐
time behavior interpretation from traffic video[12].
3. Algorithm description
The generic shot detection method always focuses on distinguishing normal shot frames from cut frames, and aims at finding the abrupt shot change or gradual shot changes. However, the traffic videos gathered by road monitors, are always continuous without obvious transition of shots, therefore, the shot detection methods for ordinary videos may be impractical under certain circumstance. Motivated by this, we propose a novel flow analysis framework for traffic video based on their content. Re‐sampling is first performed for efficient and precise analysis, and employing foreground extraction on the original video for unbiased traffic flow analysis, after that, variety of frame characteristics including brightness, entropy, Harris corners, and variance of traffic flow are calcu- lated for frame property analyses. All of these estab- lish the basis of video segmentation and traffic flow analysis.
3.1. Re-sampling
In signal processing, re‐sampling is the process of
reducing the sampling rate of a signal. This is usu-
ally done to reduce the data rate or the size of the
data. For visual material, resampling is to make a
digital image smaller by removing pixels. Scaling
down always produces a sharper result than scaling
to a larger size. With a high‐quality image or photo editor, re‐sampling produces an excellent image.
Camera and object motions always introduce large variation. Although the histogram difference is in- sensitive to object motion, it remains somewhat sen- sitive to camera motion, such as panning, or zooming.
On the other hand, during the variations of video stream, the noise may cause errors in the detection of gradual transitions, which extends over several adjacent frames. To eliminate this effect, we take the process of interpolation to reduce the influence of noise.
The brightness value for the transformed pixel can be calculated by interpolating between the pixels sur- rounding the calculated address. In our proposed method, we adopt interpolation on the original video frames to get DC image of each frame, by calculating the average value of each 8*8 blocks, which is de- fined as:
7 7
0 0
( , ) 1 (8 ,8 )
x
8
xi j
C m n f m i n j
= =
= ∑∑ + +
where f i j
x( , ) is the original frame, and the compar- ison between original image and DC image is shown in Figure 1.
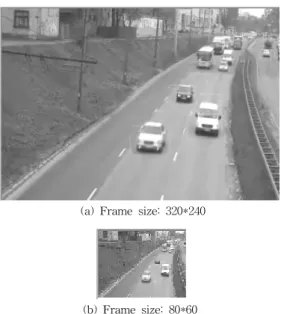
(a) Frame size: 320*240
(b) Frame size: 80*60
Fig. 1. The Original Image (a) of One Frame, compared with the DC image (b), whose size is
the 1/16 of the original image.
3.2. Foreground extraction
For unbiased traffic flow analysis, foreground ex- traction is employed on the original video in order to
get foreground video. First and foremost, the back- ground is extracted by averaging the total frame im- ages of each pixel location.
1 0
( , ) 1
N( , )
x x
x
B i j f i j
N
−
=
= ∑
where N is the total frame number, and f i j
x( , ) is the pixel value at f
xin frame f
x.
In order to reduce the influence of background scene, we take the foreground extraction by subtract- ing the background image from each original frame, as equation (3) defined,
( , ) | ( , ) ( , ) |
x x x
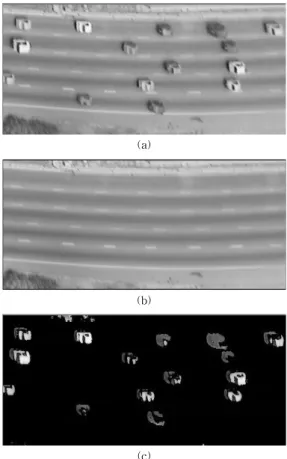
Fg i j = O i j − B i j (3) Actually, although the traffic videos are captured by fixed monitors, the background maybe not un- changing all the way, due to the tiny movement of the monitor, and other influencing factor like the en- vironment or weather, which might cause some minor mistakes on the foreground video, or bring some de- viations on the final result, as shows in the Figure 2(b). For the purpose of removing these deviations on the foreground video, setting a threshold is much necessary. If the difference of pixel values between the original frame and the background image is less than the threshold T, it will be set to 0.
Fg (i,j) < T ( , ) { 0 Fg (i,j) < T x Fg i j x = no change x
After this operation, the foreground video without the background will be obtained, as an example shown in the Figure 2(c).
3.3. Frame property analyses
For the generic video, the most common shot boundary detection techniques always based on the pixel differences, statistical differences, histogram, or motion vectors. As for traffic video analysis, we of- ten pay more attention to the car flow in traffic, so it is necessary to select the features which may reflect the content of video well and truly. In our im- plementation, we employed brightness, entropy, and Harris corners as the features for analysis, and define a dissimilarity function by combining these features, which may reflect the complexity of the content very well.
3.3.1. Brightness analysis
Brightness is the perception elicited by the lumi- nance of a visual target, whose range is from 0 to 255. In the RGB color space, brightness can be thought of as the arithmetic mean of the red, green, and blue color coordinates. As sometimes the three (1)
(2)
(4)
components may make uneven contribution to the brightness value, we defined the brightness by aver- aging all the pixel value in one image and employing normalization to decrease the range to [0,1], as the equation shows below,
0 0
( , )
255* *
height width
i j
f i j B width height
= =
= ∑ ∑
Besides the normalization, the calculation is carried out on each band for improving the precision.
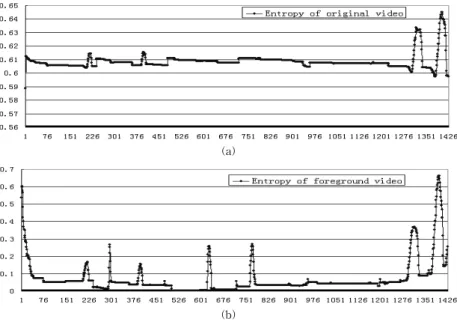
3.3.2. Entropy
Entropy is an important concept measuring the average information in an image, and shows how many bits need to code the image data. The entropy of an N*N image can be calculated by the equation [13]:
1 2 0
log ( )
L
i i
g
Entropy
−P P
=