1. Introduction
A critical factor that has often been reported as affecting the formation of the phonetic systems of bilingual speakers is age of learning (AOL). This refers to the age in which bilinguals were initially exposed to an L2 extensively, or started to reside in an L2 speaking country. Several studies have investigated the phonetic systems of bilingual speakers by classifying individuals according
to AOL as simultaneous bilinguals who were exposed to both languages from birth, as well as early, mid, and late bilinguals depending on the ages they were extensively exposed to a relevant L2 (e.g., Guion, 2003). For example, Guion (2003) explored the relation between the vowel systems of Quichua-Spanish bilinguals and their AOL. The bilinguals who were exposed to Spanish (L2) at a younger age tended to formulate independent vowel categories for both languages, while later bilinguals displayed the tendency of not
*This work was supported in part by the Ministry of Education of the Republic of Korea and the National Research Foundation of Korea (NRF-2016S1A5A2A01026875).
**Ewha Womans University, [email protected]
Received 28 July 2017; Revised 6 September 2017; Accepted 14 September 2017
ISSN 2005-80632017. 9. 30.
Vol.9 No.3 pp. 33-40
말소리와 음성과학
http://dx.doi.org/10.13064/KSSS.2017.9.3.033
Perception and production of Korean and English stops by bilinguals with extensive experience residing in the U.S.: Individual patterns *
Eunjin Oh
**Abstract
This study aimed to examine how Korean-English bilinguals make use of VOT and F0 cues in perception and production of Korean (lenis vs. aspirated) and English (voiced vs. voiceless) stops. It was explored whether bilinguals with extensive experience living in the U.S. exhibit native-like or interactive patterns in the cue use for both languages. Participants produced monosyllabic word-initial stops within a carrier sentence in each language, and performed forced-choice identification tasks with synthesized stimuli varying in 7 VOT steps and 7 F0 steps with base tokens of /tʰan/ for Korean and /tæn/ for English. Listeners were required to select either /tan/ or /tʰan/ for Korean and either /dæn/ or /tæn/ for English.
The results from binary logistic regression analyses for each listener indicated that all bilinguals placed greater weight on F0 than VOT when distinguishing between the Korean lenis and aspirated stops, and greater weight on VOT than F0 in distinguishing between the English voiced and voiceless stops. In terms of production, all participants showed remarkably overlapping ranges in the VOT dimension and separating ranges in the F0 dimension for the stop contrast of Korean, while forming overlapping ranges in the F0 dimension and separating ranges in the VOT dimension for the stop contrast of English. These results indicate that the bilinguals with extensive exposure to L2 manage the stop systems of the two languages independently, both in perception and production, employing the opposite cue use for stops in the two languages.
It was also found that the absolute beta-coefficient values of the perceptual cues for Korean stops were generally smaller than those for English and those reported in a previous study as for later bilinguals, which may have resulted from Korean not being their dominant language.
Keywords: stop, VOT, F0, Korean, English, bilingual, perception, production
producing the vowels of the two languages in distinctive ways, presumably due to the interactions between L1 and L2 in a unified vowel system.
This study aims to explore how earlier bilinguals of Korean and English make use of VOT and F0 cues in perception and production of Korean (lenis and aspirated) and English (voiced and voiceless) stops. VOT refers to the time between the release of stop closure and the beginning of vocal cord vibration, and the F0 is the fundamental frequency of the following vowel. Both Korean and English use the VOT and F0 cues in distinguishing between stops, but the relative importance of the cues is known to differ in the two languages. The English stops are distinguished primarily by VOT and secondarily by F0. The voiceless stops have longer VOTs and higher F0s while voiced counterparts feature shorter VOTs and lower F0s. For example, Shultz et al. (2012) explored how native English participants use VOT and F0 cues in perceiving and producing the English voiced and voiceless stops. All participants used VOT primarily in production. The coefficient values for F0 from both production and perception analyses were found to be small, indicating that the F0 cue was used only minimally in distinguishing between the two stops. According to Schertz et al.
(2014), native English listeners displayed the perceptual pattern in which longer VOTs elicited more voiceless responses, while shorter VOTs induced more voiced responses. F0 was only a weak cue in that higher F0s elicited slightly more voiceless responses (from Schertz et al., 2015).
While several studies have reported that the F0 is called for only when the VOT is ambiguous (e.g., Abramson & Lisker, 1985), Whalen et al. (1993) argued that the F0 cue provides voicing information even with the unambiguous VOT. That is, when F0 was incorrectly matched with the VOT (i.e., long VOT with low F0 or short VOT with high F0), response times were delayed even when the VOT unambiguously contrasts the two stops. This result was interpreted to indicate that F0, which is “a phonologically redundant feature (p. 2158),” also contributes to the perception of the English stops.
On the other hand, the lenis and aspirated stops of Seoul Korean have been reported to be differentiated primarily by F0 and secondarily by VOT both in production and perception due to the sound change in which the VOT values of the two stops are being merged (e.g., Silva, 2006; Kim, 2008; Kang, 2014). That is, it has been demonstrated that native speakers of Seoul Korean have shown the phenomenon of VOT decreasing for the aspirated stops and increasing for the lenis stops, resulting in the gradual reduction of the VOT differences between the two stop categories. Instead of VOT, the F0 of the following vowel has been emerging as a major cue to distinguish between the lenis and aspirated stops. Several studies have investigated the perceptual cues used in distinguishing between the Korean stops (e.g., Kim et al. 2002; Kang, 2010). For example, Kang (2010) explored the perception of Seoul Korean stops as a function of listener age. Both older and younger listeners weighted F0 more than VOT when distinguishing between the lenis and aspirated stops, although younger listeners placed greater weight on F0 compared to their older counterparts.
There are production or perception studies that have investigated the patterns of stop cue use by native Korean learners of English.
Regarding production, Kang & Guion (2006) reported that an early bilingual group (mean AOL=3.8 where AOL refers to the age of starting to reside in the U.S.) did not show statistically significant
differences in either VOT or F0 values of the English stops with a native English speaker group while a late bilingual group (mean AOL=21.4) did demonstrate significant differences with the native English group. The early bilingual group produced native-like VOT and F0 values also for Korean stops, resulting in the formation of 5 distinctive stop categories for the two languages (fortis, lenis, and aspirated stops for Korean, and voiced and voiceless stops for English).
Concerning perception, Kim (2012) demonstrated that native Korean learners of English made more robust use of F0 in producing the voiced and voiceless stops in English compared to native English speakers. It was interpreted that the primary use of F0 in their L1 (Korean) was transferred to their L2 (English) production. Kong & Yoon (2013) explored how native Koreans employ VOT and F0 cues of the English alveolar stops in perception and production as a function of English proficiency. The synthesized syllables with 6 levels of VOTs and 5 levels of F0s were used in the perception tasks. Participants with relatively lower English proficiency relied more on the F0 cue in distinguishing between the English voiced and voiceless stops compared to participants with higher proficiency. It was interpreted that the more proficient listeners have the ability to suppress the less important cue for the L2 stop contrast. In terms of production, the more proficient participants showed a greater reliance on VOT in contrasting the English stops (see section 4 for more discussion).
The participants in Kim (2012) started learning English in middle school and had no experience residing in an English-speaking country, and those of Kong & Yoon (2013) were students of two high schools located in Seoul or the suburbs of Seoul whose English proficiency was classified as either low or high. Participants of these studies can be classified as later bilinguals without extensive experience living in an English-speaking country on the basis of AOL outlined above. This study recruited earlier bilinguals of Korean and English with extensive experience living in the U.S. to determine whether they would show native-like patterns of cue use for the stop contrasts of the two languages, or whether any indications of interactions between Korean and English are present.
More specifically, since English was the dominant language of participants born and raised in the U.S., or were being educated at a university in the U.S., it was questioned whether the cue use of English stops affect that of Korean, demonstrating similar cue weighting patterns for the two languages. According to the results of Kang & Guion (2006) on the early bilinguals discussed above, participants in this study are expected to display independent cue use patterns for Korean and English in production, and this study will further investigate the perceptual patterns for the stop cue use in the two languages.
There are studies which reported that some interactive patterns
were found between two languages of bilinguals. For example,
Fowler et al. (2008) reported that even simultaneous bilinguals
demonstrated interactions between two languages in the VOT
systems. Simultaneous English-French bilinguals residing in
Montreal, Canada, demonstrated evidence of operating independent
VOT systems in producing significantly longer VOTs for English
than French. In addition, there was an indication of interactive
patterns between the two languages, producing significantly longer
VOTs for French than monolingual French speakers and
significantly shorter VOTs for English than monolingual English
speakers.
The following section reports the results of the perception experiment and examines whether the bilingual listeners of Korean and English use the VOT and F0 cues in native-like relative weighting when distinguishing between the stop contrasts of the two languages or whether participants show similar cue weighting patterns for the two languages due to the cross-language interactions.
2. Perception experiment
2.1. Methods 2.1.1. Participants
Eight bilingual listeners of Korean and English participated in the experiments. Four were male (M1~M4) and four female (F1~F4).
They were all undergraduate or graduate students at a university in California, U.S. The native language of all parents of the participants was Korean, and the languages they used on a daily basis were English and Korean. <Table 1> lists the participants’
gender, age, places where they were born and raised, age they began residing in the U.S., and the percentage of using English and Korean in their daily life. Except M3 and F2, who self-reported that the amount of Korean and English use were similar, participants predominantly used English in their daily life. Participants would not communicate in any other foreign language at more than an intermediate level. They were paid for participation in the experiments.
Participant (age)
Place where they were born
Place(s) where they were raised
Age at which they started to reside in the U.S.
Percentage of using English vs.
Korean (%)
M1 (30) Californi a
California (resided in S.
Korea for 1.5 years)
0 80 vs. 20
M2 (21) Seoul Seoul; New
Jersey 4 95 vs. 5
M3 (22) Seoul Seoul; Maryland 14 40 vs. 60
M4 (24) Seoul
Seoul;
California (resided in India for 1 year)
19 90 vs. 10
F1 (19) Californi
a California 0 80 vs. 20
F2 (21) Daejeon Daejeon;
Washington 10 50 vs. 50
F3 (21) Seoul Seoul; Florida;
Virginia
14 (resided in the U.S. from 6 years old for 2 years)
80 vs. 20
F4 (21) Seoul Seoul;
California
18 (resided in the U.S. from 11 years old for 1.5 years)
90 vs. 10 Table 1. Participants’ information.
2.1.2. Stimuli manipulation
Perception stimuli were manipulated using a natural token of English /tæn/ (‘tan’; VOT 78 ms; F0 96 Hz) produced by a male native speaker of General American English and that of Korean /tʰ an/ (‘scorched’; VOT 91 ms; F0 172 Hz) produced by a male native speaker of Seoul Korean. The stimuli were generated as a series of syllables in 7 VOT steps and 7 F0 steps for each language. For stimuli in English, the VOTs were manipulated as 10 ms, 14 ms, 20
ms, 28 ms, 40 ms, 56 ms, and 80 ms in logarithmic steps (Kong &
Yoon, 2013), and the F0s as 70 Hz, 80 Hz, 90 Hz, 100 Hz, 110 Hz, 120 Hz, and 130 Hz in linear steps. Regarding the Korean stimuli, the VOTs were manipulated as 30 ms, 40 ms, 50 ms, 60 ms, 70 ms, 80 ms, and 90 ms, and the F0s as 85 Hz, 100 Hz, 115 Hz, 130 Hz, 145 Hz, 160 Hz, and 175 Hz, in linear steps.
The stimuli were created using the PSOLA function of Praat (Boersma & Weenink, 2016). The VOT was manipulated by reducing or stretching the original VOT duration using the relative duration function. The F0 was manipulated by lowering or raising the whole contour of the vowel and the following nasal on the basis of the vowel midpoint. A total of 98 unique stimuli (7 VOT steps*7 F0 steps*2 languages) were created.
2.1.3. Procedure and data analyses
The perception experiment was conducted using the MFC function of Praat (Boersma & Weenink, 2016). English production and perception sessions were completed first followed by Korean production and perception sessions. Participants took a short break after each session. A total of 490 trials with 5 repetitions of the manipulated stimuli (98 stimuli*5 repetitions) were presented. A randomization method was used to prevent any two identical trials being assigned consecutively. Participants listened to the stimuli through an Audio-Technica ATH-M40X headphone. Response categories were presented on a computer screen for identification as /dæn/ (‘Dan’) vs. /tæn/ (‘tan’) for English and /tan/ (‘sweet’) vs. /tʰ an/ (‘scorched’) for Korean in the orthography of each language. A practice session consisting of 8 randomly chosen stimuli was performed prior to the session of each language. The experiments took place in a soundproof phonetics laboratory located at the university where the participants were attending.
Regarding data analyses, binary logistic regression models of data from individual listeners were used to calculate the relative cue weighting of VOT and F0 in perceiving the stop contrasts of the two languages for each listener. The predictors (7 VOT and 7 F0 steps) were transformed to vary from –3 to 3. Response was a dependent variable, and VOT and F0 steps were covariates. Beta-coefficient values were obtained to indicate how much each listener weighs a given cue in categorizing the two stops of each language. A larger absolute coefficient value indicates a more reliable categorization of the stop contrast with a given cue.
2.2. Results
<Figure 1> presents the percentages of the aspirated responses for Korean (left) and the voiceless responses for English (right) for the 7 VOT (circles with solid lines) and 7 F0 (triangles with dashed lines) steps. For example, the percentage of the 1st VOT step (30 ms) of M1’s Korean was 57.1%, which represents the percentage of the total aspirated responses for the stimuli with 30 ms VOT for all 7-step F0s. Steeper slopes of a cue indicate its larger role in the stop categorization according to the changes in the cue values, while more gentle slopes of a cue indicate that the cue plays a relatively smaller role in the categorization of the given stops.
All bilingual listeners who participated in this experiment
demonstrated steeper slopes for F0 and more gentle slopes for VOT
when using Korean, while showing steeper slopes for VOT and
more gentle slopes for F0 when using English. These phenomena
are further evident in the differences between the largest and the
smallest percentages of the given cue for each language. For all
individual listeners, the differences were larger for F0 than VOT in the case of Korean (VOT 14.3 vs. F0 100 for M1; VOT 20 vs. F0 85.7 for M2; VOT 17.2 vs. F0 97.1 for M3; VOT 20 vs. F0 100 for M4; VOT 40 vs. F0 80 for F1; VOT 34.2 vs. F0 94.3 for F2; VOT 11.4 vs. F0 97.1 for F3; VOT 22.9 vs. F0 100 for F4) and larger for VOT than F0 for English (VOT 100 vs. F0 17.2 for M1; VOT 82.9 vs. F0 22.9 for M2; VOT 100 vs. F0 22.8 for M3; VOT 100 vs. F0 14.3 for M4; VOT 97.1 vs. F0 20 for F1; VOT 88.6 vs. F0 34.3 for F2; VOT 77.1 vs. F0 51.4 for F3; VOT 100 vs. F0 5.7 for F4). These results indicate that listeners relied more on F0 in distinguishing between the Korean lenis and aspirated stops and more on VOT in distinguishing between the English voiced and voiceless stops.
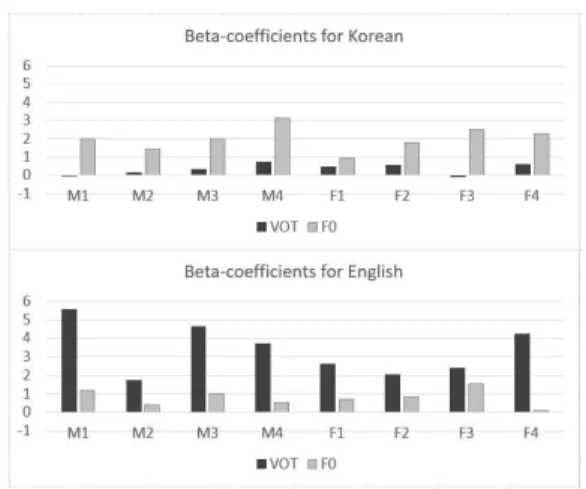
Two notable characteristics were found that (1) the VOT of listener F1 affected the categorization of the Korean stops more than the other listeners, whose difference between the largest and smallest percentages was 40, and (2) the F0 of listener F3 affected the categorization of the English stops more than the other listeners, whose difference between the largest and smallest percentages was 51.4. Listener F1 made crucial use of VOT especially at the lower VOT steps (i.e., 1, 2, 3, and 4 steps in <Figure 1>). Listener F3 appeared to use F0 information in categorizing the stops in perception (see also <Figure 2> for the relatively larger beta-coefficient value for the F0 cue (1.551) used in contrasting the English stops), but showed a complete overlap between the English stops in the F0 dimension in production as shown in <Figures 3 and 4> below, demonstrating a perception-production mismatch.
<Figure 2> presents the beta-coefficient values from the binary logistic regression analyses for each listener for the VOT and F0 cues in categorizing the Korean (above) and English (below) stops.
The discussion regarding <Figure 1> was confirmed in that the beta-coefficient values were consistently larger for F0 than VOT in Korean and larger for VOT than F0 in English, indicating that the bilingual listeners relied more on F0 in identifying the Korean stops and more on VOT in identifying the English stops. A notable phenomenon is that the beta-coefficient value for the Korean F0, which is the more important cue for Korean, was in general smaller than that for the English VOT, which is the more important cue for English (see discussion in section 4).
In summary, the earlier bilingual listeners who participated in this experiment relied more on F0 when distinguishing between the Korean lenis and aspirated stops, and relied more on VOT when categorizing the English voiced and voiceless stops, demonstrating independent perceptual patterns for the two languages. The listeners consistently showed larger beta-coefficient values for F0 than VOT in Korean and larger beta-coefficient values for VOT than F0 in English. It was also observed that the coefficient value of the Korean F0 was generally smaller than that of the English VOT for each listener, indicating less robust use of the cue in categorizing the Korean stops (section 4).
Figure 1. Percentages of aspirated responses for
Korean (left) and voiceless responses for English
(right) by 7 VOT and 7 F0 steps: Individual listeners.
Figure 2. Beta-coefficient values of VOT and F0 cues in
perceiving the Korean (above) and English (below) stop contrasts from binary logistic regression analyses for each
listener.
3. Production experiment
3.1. Methods
The same subjects participated in both the perception experiment and the production experiment (<Table 1>). The test materials were monosyllabic words in which the target stops with different places of articulation and vowel contexts were in word-initial positions (i.e., /pin/ (‘empty’), /pʰin/ (‘bloom’), /pan/ (‘half’), /pʰan/ (‘board’), /tin/ (nonsense), /tʰin/ (nonsense word), /tan/ (‘sweet’), /tʰan/
(‘scorched’), /kin/ (‘long’), /kʰin/ (nonsense word), /kan/
(‘saltiness’), and /kʰan/ (‘partition’) for Korean; /bɪn/ (‘bin’), /pɪn/
(‘pin’), /bæn/ (‘ban’), /pæn/ (‘pan’), /dɪn/ (‘din’), /tɪn/ (‘tin’), /dæn/
(‘Dan’), /tæn/ (‘tan’), /gɪn/ (‘ghin’), /kɪn/ (‘kin’), /gæn/ (‘gan’), and /kæn/ (‘can’) for English). The words were read within a carrier sentence for each language in a randomized order (Say “CVn” to me for English and tasi “CVn” tuseyo (put “CVn” again) for Korean in orthography of each language). The test sentences were presented on a computer screen at intervals of 2 seconds in order to control the speaking rate effect on VOT as far as possible (e.g., Millet et al., 1986). Participants read the materials once for practice and three times for recording. Recordings were made using a Marantz PMD661 recorder and an Audio-Technica ATM75 cardioid condenser headworn microphone with a 44.1 kHz sampling rate.
The three repetitions of VOTs and F0s were measured using Praat (Boersma & Weenink, 2016). VOTs were measured from the beginning of the release burst to the first periodic cycle in the speech waveform, and measurements were confirmed aurally and by spectrograms. F0s were measured both at 5 ms after the voice onset and at the midpoint of vowel duration. The F0 values in Hz of the raw data were converted to semitone (st) using the semitone conversion equation ‘12[ln(Hz/100)/ln2].’ Several studies have found that the F0 contours of the voiceless stops in general show falling shapes while those of the voiced stops show rising or flat shapes (e.g., Whalen et al., 1993; Shultz et al., 2012). However, there are also studies reporting that the rising or falling shapes of the F0 contours do not consistently differentiate the voiced and voiceless stops in English (e.g., Ohde, 1984). By measuring the F0s
at the two measurement points (i.e., 5 ms after the voice onset and the vowel midpoint), it was examined whether the general F0 contours produced by the simultaneous and early bilinguals show consistent rising or falling patterns according to the stops of the two languages.
3.2. Results
<Figure 3> presents the participants’ mean VOT (left) and F0 values with their standard deviations of the Korean lenis vs.
aspirated stops as well as the English voiced vs. voiceless stops.
Both the F0 values at 5 ms following the vowel onset (middle) and at the midpoint of vowel duration (right) were reported in st. The VOT differences between the two stops were larger for English than Korean for all speakers. Regarding F0, no notable differences were found for the stop distinction patterns between the values measured at the vowel onset and the values measured at the vowel midpoint.
For example, the F0 differences between the two stops were larger for Korean than English both at 5 ms and at the midpoint for each speaker. The only one exception was the case of speaker M4, who showed a larger F0 difference between the English stops than between the Korean stops at 5 ms (3.70 vs. 3.49), but showed a larger F0 difference between the Korean stops than between the English stops at the midpoint (3.67 vs. 2.67). In addition, the F0 differences between the stops were larger at the 5 ms than at the midpoint in 11 cases, and vice versa in 5 cases (i.e., M4, F1, F3, and F4’s Korean; M3’s English). M3 and M4 demonstrated larger F0 distinctions between the voiced and voiceless stops of English compared to the other speakers.
In order to examine the patterns of the F0 contour shapes of the following vowels, the differences between the mean F0s at 5 ms and the mean F0s at the midpoint were calculated. In most cases, they were positive values (i.e., the falling F0 contour shapes; 29 cases), while only 3 cases (i.e., the Korean lenis and the English voiced stops of M2; the English aspirated stops of F3) featured negative values (i.e., the rising F0 contour shapes). That is, the F0 contour shapes were mostly dropping, indicating that the F0 changing patterns of the Korean lenis and the English voiced stops showing upward F0 movements, and the Korean aspirated and the English voiceless stops downward F0 contours, did not appear consistently in the production of the bilingual speakers in this study (section 3.1). To summarize, the F0 distinction patterns in the following vowels did not show crucial differences between the 5 ms after the onset and the vowel midpoint, and any consistent patterns regarding the upward or downward F0 movements were not found, for the stop contrasts of each language.
<Figure 4> presents scatterplots of VOTs (ms) and F0s (st) for
the Korean and English stops by individual speakers. It can be noted
that most bilinguals distinguished between the Korean lenis (filled
circles) and aspirated (empty circles) stops by means of F0. They
showed remarkably overlapping ranges in the VOT dimension, but
separating ranges in the F0 dimension. Only F4 showed some
overlap in F0. In contrast, participants distinguished between the
English voiced (filled diamonds) and voiceless (empty diamonds)
stops predominantly by means of VOT. They showed more
overlapping ranges in the F0 dimension, but separating ranges in the
VOT dimension. M2, M3, and M4 distinguished between the
English stops in the F0 dimension to some extent. In particular, M3
showed relatively more distinctive ranges in the VOT dimension for
the Korean stops compared to the other speakers.
Figure 3. Mean VOTs (left; ms), F0s at 5 ms after the voice onset (middle; st),
and F0s at the midpoint of vowel duration (right; st), and their standard
deviations, of the Korean (lenis vs. aspirated) and English (voiced vs.
voiceless) stops: Individual speaker values.
Figure 4. Distributions of VOTs (ms) and F0s (st) for Korean and
English stops produced by individual speakers. Filled circles represent
Korean lenis stops, empty circles Korean aspirated stops, filled diamonds English voiced stops, and empty diamonds English voiceless
stops.
Figure 5. Mean beta-coefficients (absolute values) of