• 검색 결과가 없습니다.

Hazardous Factors and Accident Severity of Cabling Work in Telecommunications Industry

N/A
N/A
Protected

Academic year: 2021

Share "Hazardous Factors and Accident Severity of Cabling Work in Telecommunications Industry"

Copied!
9
0
0

로드 중.... (전체 텍스트 보기)

전체 글

(1)

JESK http://jesk.or.kr eISSN:2093-8462

Hazardous Factors and Accident Severity of Cabling Work in Telecommunications Industry

Yang Rae Kim

1

, Myoung Hwan Park

2

, Byung Yong Jeong

2

1

Department of Information and Security, Kyungdong University, Gosung, 24764

2

Department of Industrial and Management Engineering, Hansung University, Seoul, 02876

Corresponding Author Byung Yong Jeong

Department of Industrial and Management Engineering, Hansung University, Seoul, 02876

Phone : +82-2-760-4122 Email : [email protected]

Received : March 03, 2016 Revised : March 27, 2016 Accepted : May 26, 2016

Objective: This study aims to draw the characteristics of occupational accidents occurred in cabling work, and assess accident severity based on occupational injury data.

Background: Accident factors and accident risk are different by the place of work in cabling work. Field managers require information on accident prevention that can be easily understood by workers. However, there has been a lack of studies that focus on cabling work in Korea.

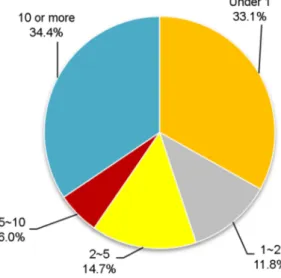
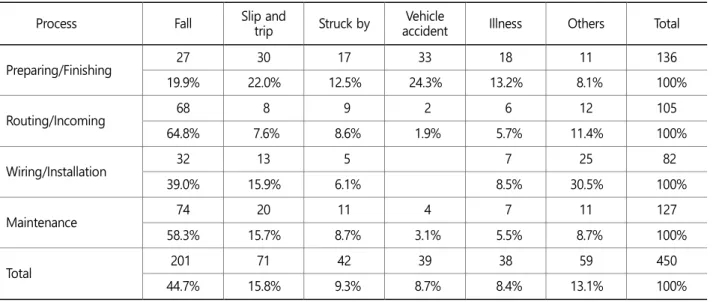
Method: This study classifies 450 injured persons caused in cabling work by process, and analyzes the characteristics of occupational injuries from the aspects of age, work experience and accident type. This study also analyzes accident frequency and severity of injury.

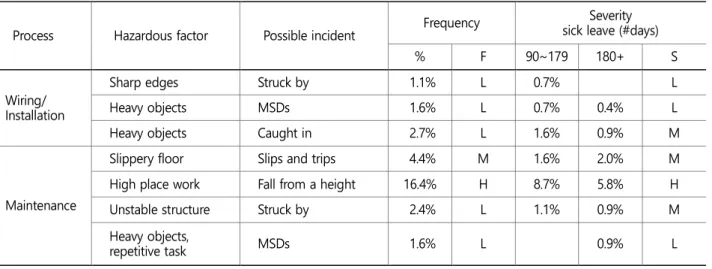
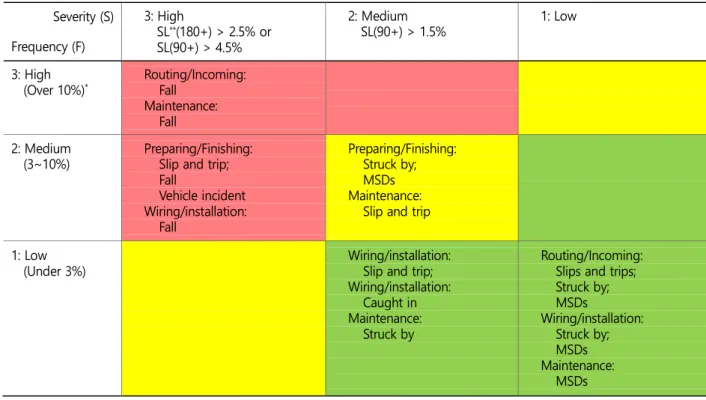
Results: Results show that preparing/finishing (33.3%) was the most common type of cabling process in injuries, followed by maintenance (28.4%), routing/income (23.1%) and wiring/installation (15.1%) process. The critical incidents in the level of risk management were falls from height in the routing/incoming process, and falls from height in the maintenance process. And, incidents ranked as 'High' level of risk management were slips and trips, fall from height and vehicle incident in the preparing /finishing process, and fall from height in the wiring/installation process.

Conclusion and Application: The relative frequency of accident and its severity by working process serve as important information for accident prevention, and are critical for determining priorities in preventive measures.

Keywords: Cabling work, Occupational injury, Risk assessment, Telecommunications industry

Copyright@2016 by Ergonomics Society of Korea. All right reserved.

ccThis is an open-access article distributed under the terms of the Creative Commons Attribution Non-Commercial License (http://

creativecommons.org/licenses/by-nc/3.0/), which permits unrestricted non-commercial use, distribution, and reproduction in any medium, provided the original work is properly cited.

1. Introduction

The cable fitter and repairers engaged in cabling work carry out the installation and repair of cable lines and relevant devices in the telecommunications, broadcasting and Internet fields (Kim and Jeong, 2015). Because, cabling work is conducted indoors or outdoors, accident factors and accident risk are different by the place of work.

Outdoor work is mainly carried out at the top of utility poles, in the manholes

underground or on the road, and indoor work is conducted in the basement, corridor,

indoors and at the rooftop (Shiina, 2013; Leigh et al., 1990). Various accident risks

including slips and trips, fall from height, stuck by something, backache and traffic

(2)

accident outside workplace exist in cabling work (Davis and Sheppard, 1980; Mital and Ghahramani, 1994; Nicholson, 1985; Shiina, 2013; Kim and Jeong, 2015).

Accident analysis includes the process of collection, arrangement and summarization of data on various accidents occurring at industrial sites, and the data analyzing and evaluating process to establish accident preventive measures. The accident prevention strategies should be properly linked with the significant variables of occupational accidents (Jeong, 1998). Field managers require information on accident prevention that can be easily understood by workers. However, there has been a lack of studies that focus on cabling work in Korea (Kim and Jeong, 2015).

Therefore, this study investigates accident data occurring in telecommunications industry, and analyzes accident characteristics of cabling workers. Furthermore, this study identifies workplace hazardous factors and accidents in each cabling work process, and injury frequency and its sick leaves were assessed to evaluate the level of risk management for each moving process and possible incidents.

2. Methods

2.1 Classification of cabling process

Cable fitters and repairers mainly perform installing and repairing cable lines in the telecommunications, broadcasting and Internet fields. Cabling work generally means cable line work, and this study classified the work into four processes: preparing/finishing, routing/incoming, wiring/installation and maintenance. Preparing/finishing process means preparation before cable line work and finishing work after the cable line work, and this process includes movement to workplace and returning. In the routing/incoming process, cable routing and incoming work is conducted. In the wiring/installation process, premises wiring and equipment and device installation are carried out. In the maintenance process, inspection and maintenance work on cable, relevant devices and facilities is performed.

2.2 Data collection and analysis

From the national compensation injury data, 450 cabling workers were verified by an evaluator and classified as injured persons for five years from 2008 to 2012. Among 450 injured persons, accidental injuries were 91.6%, and work-related illness took up 8.4%. Accident data for injured persons were categorized by cabling processes, and were verified in terms of their age and length of employment, accident type, and agency of accident. Through accident characteristics analysis by cabling process, this study draws hazardous factors by process, and estimates accident frequency and severity occurring by the hazardous factors.

3. Results

3.1 Characteristics of the injured persons

3.1.1 Distribution of occupational accidents by cabling processes

Table 1 shows the distribution of 450 injured persons according to cabling process and injury severity. Concerning the ratio of injured persons by process, the preparing/finishing process showed 33.3%, the highest, followed by maintenance (28.4%), routing/

incoming (23.1%) and wiring/installation (15.1%) in the order.

(3)

3.1.2 Analysis by age and work experience of injured persons

Figure 1 shows the distribution of the injured persons by age, and those in 30s took up the most at 34.9%, those in 40s took up 32.7% and those in 50s accounted for 20.0%. The result shows similar result of the distribution of the injured persons by age in the British telecommunications industry (Davis and Sheppard, 1980).

Figure 2 reveals the distribution of the injured persons by work experience. Work experience of over ten years was the highest at 34.4%, and under one month took up 33.1%. The distribution of the cable fitters and repairers by work experience was not known, and therefore there was a limitation in interpretation. However, that the ratio of novices with under one year of work experience and the ratio of skilled workers with over ten years of work experience were high is meaningful. The reason seems that working Table 1. Distributions of injured persons by cabling work process

Process Death Injuries Illness Total Ratio

Preparing/Finishing 3 129 18 150

33.3%

2.0% 86.0% 12.0% 100.0%

Routing/Incoming 4 94 6 104

23.1%

3.8% 90.4% 5.8% 100.0%

Wiring/Installation 0 61 7 68

15.1%

0.0% 89.7% 10.3% 100.0%

Maintenance 5 116 7 128

28.5%

3.9% 90.6% 5.5% 100.0%

Total 12 400 38 450

100.0%

2.7% 88.9% 8.4% 100.0%

(4)

sites are not fixed ranging from confined space like underground to utility poles, and thus risks exist. In this regard, the cabling fitter and repairs with under one year of work experience are likely to be exposed to risks, because they are not skilled, despite young, in view of job characteristics that workers need to concentrate mentally and physically. Actually, the cabling fitters and repairs with over ten years of work experience are highly skilled, but their physical function is low.

3.2 Risk assessment of cabling works

3.2.1 Identification of hazardous factors by cabling work process

Table 2 shows the distribution of the injured persons by types of accident in terms of cabling process. Overall, the accident types were in the following order: fall from height (44.7%), slips and trips (15.8%), struck by something (9.3%), vehicle collision (8.7%) and work-related illness (8.4%).

Looking at the distribution of the inured by cabling process, it was revealed in the order of vehicle collision (24.3%), slips and trips (15.8%) and fall from height (19.9%) in the preparing/finishing process. Meanwhile, most accidents were caused by fall from height (64.8%) in the routing/incoming process. The most accidents occurred by fall from height in the wiring/installation and maintenance processes, respectively (39.0% vs 58.3%).

Davis and Sheppard (1980) pointed out manual material handling and fall from height as main types of accident in the telecommunications industry. The reason is that workers handle weights including component materials, tools, apparatuses and equipment, or they work at risky locations such as high place, guardrails and stairs. All these imply that there is a need to establish accident prevention measures, after hazardous factors are discerned by identifying hazardous equipment and facility by cabling process, and hazards are assessed.

This study conducts risk assessment based on the drawn accident types by cabling process. Namely, this study carries out risk level

assessment using the number of accident cases as accident frequency, and the days of sick leave as accident severity in regards

(5)

with hazardous factors on accident types by cabling process.

Table 3 shows the distribution of accident ratio and the days of sick leave by hazardous factor on the types of accident by cabling process. For example, the accident probability of slips and trips, 6.7%, in the preparing/finishing process is the value that divided the number of accident cases concerned, 35, by total number of accident cases, Accident severity classifies accident severity grade, based on the distribution of days of sick leave by cabling process, and risk score is demonstrated by multiplication of the grade value.

Table 2. Distributions of occupational accidents by type of accident

Process Fall Slip and

trip Struck by Vehicle

accident Illness Others Total

Preparing/Finishing 27 30 17 33 18 11 136

19.9% 22.0% 12.5% 24.3% 13.2% 8.1% 100%

Routing/Incoming 68 8 9 2 6 12 105

64.8% 7.6% 8.6% 1.9% 5.7% 11.4% 100%

Wiring/Installation 32 13 5 7 25 82

39.0% 15.9% 6.1% 8.5% 30.5% 100%

Maintenance 74 20 11 4 7 11 127

58.3% 15.7% 8.7% 3.1% 5.5% 8.7% 100%

Total 201 71 42 39 38 59 450

44.7% 15.8% 9.3% 8.7% 8.4% 13.1% 100%

Table 3. Hazard identification and risk assessment by cabling process

Process Hazardous factor Possible incident Frequency Severity

sick leave (#days)

% F 90~179 180+ S

Preparing/

Finishing

Slippery floor Slips and trips 6.7% M 3.1% 2.0% H

High place work Fall from a height 6.0% M 2.9% 1.8% H

Unstable objects Struck by 3.8% M 1.8% 0.2% M

Vehicle Vehicle incident 7.3% M 2.2% 2.4% H

Heavy objects MSDs 4.0% M 1.1% 2.2% M

Routing/

Incoming

Slippery floor Slips and trips 1.8% L 0.9% 0.4% L

High place work Fall from a height 15.1% H 7.6% 4.2% H

Unstable structure Struck by 2.0% L 0.7% L

Heavy objects MSDs 1.3% L 0.7% 0.4% L

Wiring/

Installation

Slippery floor Slips and trips 2.9% L 1.1% 0.7% M

High place work Fall from a height 7.1% M 3.3% 2.0% H

(6)

3.2.2 Risk management of cabling works

Table 4 shows the criteria to assess accident frequency grade (F), accident severity grade (S) and risk grade. Accident frequency grade (F) was classified as grade 1 (under 3%), grade 2 (3%~under 10%) and grade 3 (10% and more). Accident severity grade (S) was set based on the distribution of the injured persons by the number of sick leave by cabling process. The risk score (C) was calculated by the multiplication of accident frequency level and accident severity level (C=F*S), and the level of risk was set according to risk score. The choice of levels and values for injury frequency (F), severity (S), and risk management criteria in Table 4 were determined by prior consultation with some cabling work managers.

Risk management grade shows the priority of risk management. Table 5 shows risk matrix based on risk assessment. The level of risk in Table 5 was indicated as three grades, namely, high risk (red zone), medium risk (yellow zone) and low risk (green zone) by the criteria in Table 4.

Table 3. Hazard identification and risk assessment by cabling process (Continued)

Process Hazardous factor Possible incident Frequency Severity

sick leave (#days)

% F 90~179 180+ S

Wiring/

Installation

Sharp edges Struck by 1.1% L 0.7% L

Heavy objects MSDs 1.6% L 0.7% 0.4% L

Heavy objects Caught in 2.7% L 1.6% 0.9% M

Maintenance

Slippery floor Slips and trips 4.4% M 1.6% 2.0% M

High place work Fall from a height 16.4% H 8.7% 5.8% H

Unstable structure Struck by 2.4% L 1.1% 0.9% M

Heavy objects,

repetitive task MSDs 1.6% L 0.9% L

F: level of accident frequency (1: Low, 2: Medium, 3: High);

S: level of accident severity (1: Low, 2: Medium, 3: High)

Table 4. Definition and classification of accident frequency, accident severity and risk level

Level Frequency (F) Severity (S) Risk

F Ratio (%) S Sick leave C = F x S Level Description

High 3 Over 10%

*

3 SL(180+)

**

> 2.5% or SL(90+) > 4.5% Over 5 3 Red zone

Medium 2 3~10% 2 SL(90+) > 1.5% 3~5 2 Yellow zone

Low 1 Under 3% 1 Otherwise Under 3 1 Green zone

Note that all the ratio of one percent or less was not considered.

*Ratio of the injured with specific type of accident in a process.

**SL(90+) denotes the ratio of the injured with a sick leave of 90 days or more, and SL(180+) with a leave of 180 days or more.

(7)

In Table 5, the accidents of red zone management grade causing injured persons with the most accident frequency and high accident severity in cabling work were fall from height in the routing/incoming process, and fall from height in the maintenance process. Other red zone management grade accidents were slips and trips, fall from height and vehicle incident in the preparing/

finishing process, and fall from height in the wiring/installation process. The accidents of yellow zone management risk grade were struck by something and MSDs in the preparing/finishing process, and slips and trips in the maintenance process.

4. Discussion and Conclusion

This study analyzed accident characteristics of cabling work by cabling process, and presented the level of risk by cabling process through risk assessment. According to the study results, there was a difference in the accident types by cabling process, and vehicle incident, slips and trips and fall from height occurred in the order in the preparing/finishing process. In the routing/

incoming process, however, most accidents occurred due to fall from height. In the wiring/installation process and maintenance process, the most accidents were caused by fall from height and slips and trips, respectively. In the risk assessment, the accidents to be prevented in priority in cabling work were fall from height and slips and trips in all processes.

In cabling work, work location is designated according to work instructions, and the work location is not regular, and actual work is carried out underground (manhole), at the top of utility poles, in a building or outdoors (ILO, 2011). Because work is conducted in various work locations, systematic training needs to be undertaken for novices. Especially, most workers work at the workplaces of subcontractors or service contractors. In addition, core actions including proper education, training and supervision should be preceded so that workers can recognize risks in line with each process characteristics, and safe work can be carried out.

Table 5. Risk matrix for accident probability

Severity (S) Frequency (F)

3: High

SL

**

(180+) > 2.5% or SL(90+) > 4.5%

2: Medium SL(90+) > 1.5%

1: Low

3: High (Over 10%)

*

Routing/Incoming:

Fall Maintenance:

Fall 2: Medium

(3~10%)

Preparing/Finishing:

Slip and trip;

Fall

Vehicle incident Wiring/installation:

Fall

Preparing/Finishing:

Struck by;

MSDs Maintenance:

Slip and trip

1: Low (Under 3%)

Wiring/installation:

Slip and trip;

Wiring/installation:

Caught in Maintenance:

Struck by

Routing/Incoming:

Slips and trips;

Struck by;

MSDs

Wiring/installation:

Struck by;

MSDs Maintenance:

MSDs

(8)

Since there are many cases in which work is conducted at the top of a ladder or top of a utility pole in cabling work, the accident risk of fall from height is high. In this study, 30.6% of total accidents occurred at the mobile ladder or utility pole, which implies that safe work measures at high place is needed. In particular, many accidents occur, when workers climb or come down a ladder and stairs, and five-fold more accidents occur, when workers go down from the guardrail or ladder, compared to climbing up the ladder. When workers climb up or come down stairs or a ladder, they need to secure their field of vision, and they should be careful, when they come down carrying work tools or things. Work equipment, safety protection gear and working tools need to be regularly inspected in advance, and regular safety inspection is required so that worn-out equipment can be replaced beforehand.

Work at high place or confined space such as manhole exists in cabling work. Such a work may cause many accidents, and if many accidents occur, the use of sick leave becomes very high. Therefore, it is desirable for an allowed person to wear protective gear and use proper work facility in the event that the job concerned is required. If cabling work is conducted by a subcontractor, a worker may be inputted to work without wearing proper protective gear or without taking safety action, due to fierce competition.

For this reason, a protective action system is needed to be reviewed so that general novice workers can actively avoid the work concerned, which is in the high risk work group.

This study is a descriptive retrospective examination of injury records. therefore there can be a limitation in using the results of this study. However, this study offers the outline of the characteristics of accidents occurred in cabling work, and the results of this study can be utilized for workers engaged in this field to recognize risk by cabling process, and to develop effective accident prevention programs.

Acknowledgements

This research was financially supported by Hansung University.

References

Davis, P.R. and Sheppard, N.J., Pattern of accident distribution in the telecommunications industry, British Journal of Industrial Medicine , 37, 175-179, 1980.

ILO, 2011. Telecommunications – ILO Encyclopedia of Occupational Health and Safety. <http://www.iloencyclopaedia.org/part- xvii-65263/public-and-government-services/170-101-public-and-government-services/telecommunications>

Jeong, B.Y., Occupational deaths and injuries in the construction industry, Applied Ergonomics , 29(5), 355-360, 1998.

Kim, Y.R. and Jeong, B.Y., A Comparative Analysis of Occupational Accidents between Indoor and Outdoor Workers in Telecommunications Industry, Journal of the Ergonomics Society of Korea , 34(5), 519-529, 2015.

Leigh, J., Mulder, H., Want, G., Farnsworth, N. and Morgan, G., Personal and environmental factors in coal mining accidents, Journal of Occupational Accidents, 13, 233-250, 1990.

Mital, A. and Ghahramani, B., The injury profile of a large telecommunication company: a statistical summary, Ergonomics , 37(10), 1591-1601, 1994.

Nicholson, A.S., Accident information from four British industries, Ergonomics , 28(1), 31-43, 1985.

(9)

Shiina, K.A., Comparative Analysis of Near-Miss Falling and Slipping Incidents at Indoor and Outdoor Telecommunication Construction Sites, International Conference on Fall Prevention and Protection , 211-216, 2013.

Author listings

Yang Rae Kim: [email protected]

Highest degree: PhD, Department of Industrial and Management Engineering, Hansung University Position Title: Professor, Department of Information and Security, Kyungdong University

Areas of Interest: Ergonomics, System Simulation

Myoung Hwan Park: [email protected]

Highest degree: PhD, Department of Industrial Engineering, KAIST

Position title: Professor, Department of Industrial and Management Engineering, Hansung University Areas of interest: Management Science, Innovation Engineering

Byung Yong Jeong: [email protected]

Highest degree: PhD, Department of Industrial Engineering, KAIST

Position Title: Professor, Department of Industrial and Management Engineering, Hansung University

Areas of interest: Ergonomics, Safety and Health Management

수치

Figure 1 shows the distribution of the injured persons by age, and those in 30s took up the most at 34.9%, those in 40s took up  32.7% and those in 50s accounted for 20.0%
Table 2 shows the distribution of the injured persons by types of accident in terms of cabling process
Table 3 shows the distribution of accident ratio and the days of sick leave by hazardous factor on the types of accident by cabling  process
Table 4 shows the criteria to assess accident frequency grade (F), accident severity grade (S) and risk grade
+2

참조

관련 문서