• 검색 결과가 없습니다.

A Quantity Prediction Model for Reinforced Concrete and Bricks in Education Facilities Using Regression Analysis

N/A
N/A
Protected

Academic year: 2021

Share "A Quantity Prediction Model for Reinforced Concrete and Bricks in Education Facilities Using Regression Analysis"

Copied!
7
0
0

로드 중.... (전체 텍스트 보기)

전체 글

(1)

pISSN 1598-2033 eISSN 2233-5706

Journal of the Korea Institute of Building Construction, Vol. 13, No. 5

http://dx.doi.org/10.5345/JKIBC.2013.13.5.506 www.jkibc.org

A Quantity Prediction Model for Reinforced Concrete and Bricks in Education Facilities Using Regression Analysis

Lee, Jong-Kyun

1

Kim, Boo-Young

2

Kim Jang-Young

3

Kim, Tae-Hui

4

Son, Kiyoung

2*1)

Department of Architectural Plant, Youngsan University, Junam-Dong, Yang-San, 626-300, Korea

1

School of Architecture, University of Ulsan, Nam-Gu, Ulsan, 680-749, Korea

2

Department of Education Facility, Anyanggwacheon Office of Education, Dongan-Gu, Anyang, 431-060, Korea

3

Department of Architectural Engineering, Mokpo National University, Muan-gun, Jeonnam, 534-729, Korea

4

Abstract

Since the amendment of the law on the private sector investment in social infrastructure in January of 2005, the government has been actively promoting Build-Transfer-Lease (BTL) projects. Notably, most new educational facilities have been built as BTL projects. For these facilities, the unit cost per unit area has been applied to predict construction costs. However, since construction costs are mostly managed after the detailed design phase, the costs can be estimated incorrectly. For this reason, cost management is needed in the planning phase, with a sound approximate estimate to prevent the wasteful use of funds. To address this shortcoming, this study aims to develop a quantity prediction model for education facilities using regression analysis in the planning phase. The developed model is focused on the required quantities of reinforced concrete and bricks. In order to achieve the objective, the data of 44 educational facility projects collected from Gyeonggi-do was used in the regression model. This study can be utilized by major stakeholders to accurately predict construction costs by estimating the appropriate quantities of reinforced concrete and bricks in the planning design phase.

Keywords : build-transfer-lease, educational facilities, quantity takeoff, regression analysis

1. Introduction

Following the amendments to the law on private sector investment in social infrastructure made in January of 2005, the government has been actively promoting Build-Transfer- Lease (BTL) projects.

By the end of 2011, 396 BTL projects had been conducted, with contracts amounting to 23.6 trillion won. Of the projects, education facilities and drain- age facilities represent 30.1% and 26.3% of the to-

Received : July 2, 2013

Revision received : August 31, 2013 Accepted : September 3, 2013

* Corresponding author : Son, Kiyoung

[Tel: 82-52-259-2788, E-mail: [email protected]]

©2013 The Korea Institute of Building Construction, All rights reserved.

tal number of projects, respectively[1].

Notably, as a part of an initiative to improve the education environment, BTL projects involving edu- cational facilities have been promoted since the law on the construction of educational facilities was es- tablished in 2005 by the Ministry of Education &

Human Resources Development. For the facilities, the unit cost per unit area has been applied to pre- dict construction costs[2].

However, since the management of construction costs is focused on after the detailed design phase, management based on approximate estimates in the planning phase are very vulnerable to error.

Therefore, it is necessary to develop a model that

enables precise prediction of construction cost in the

planning phase[3].

(2)

Thus, the purpose of this study is to develop a quantity prediction model for education facilities in the planning phase using regression analysis. The developed model is focused on predicting the re- quired quantities of reinforced concrete and bricks, since the costs of these items is the main compo- nent of total construction costs. The costs of re- inforced concrete and bricks occupy 30-35% and 6-8% of total costs, respectively[4]. This study can be utilized by major stakeholders to accurately predict construction costs by estimating appropriate quantities of reinforced concrete and bricks in the planning phase.

2. Research methodology

In this study, the quantity of reinforced concrete and bricks is analyzed based on the bill of quantity for 44 education facilities, such as elementary, middle, and high schools built for the Gyeonggi Provincial Office of Education from 2006 to 2009.

In order to achieve the objective of this study, the previous studies related to BTL and quantity esti- mation were first analyzed. Second, the bills of quantity for the 44 education facilities built for Gyeonggi Provincial Office of Education from 2006 to 2009 were collected. Third, based on the col- lected data, the quantity of reinforced concrete and cement block and red brick in each facility are identified. Fourth, the regression model is developed. In the model, the quantity of reinforced concrete and bricks is defined as the dependent variable, and the total floor area, number of classes, and number of floors were defined as the in- dependent variables. Fifth, the correlation analysis is utilized between variables to identify their relationship. In addition, the developed model is verified through the check for normality method.

3. Literature review

Many researchers have attempted to conduct studies related to quantity take-off at the planning phase of a construction project, as this can de- termine the success of the project.

In the area of apartment projects, many studies related to the prediction of construction costs and methods for improving the reliability and accuracy of predictions have been conducted. Park et al.[5]

suggested a 3D BIM approximate estimating model using detailed as-built information of previous similar projects. Seong and Kim[6] developed the BIM guideline for apartment projects analyzing the BIM environment in order to promote BIM technology. Lee and Chin[7] have conducted a study regarding the BIM-based quantity take-off of an apartment interior for accuracy and reliability.

In the area of education facilities, while many studies have been conducted related to the de- sign-bid-build delivery method, few studies have been conducted related to the quantity take-off of BTL projects. Kwon et al.[8] suggested a BIM-based estimating method for education facili- ties to obtain greater accuracy and efficiency by having more information at the planning phase.

This study also suggested a reasonable work

breakdown structure for bill of quantity. Jeon de-

veloped the regression model to predict the quantity

of main materials and total construction costs by

using the total floor area of design-bid-build proj-

ects[4]. In addition, Kim et al.[9] suggested the

cost estimating model of structural building ele-

ments with an approximate quantity survey

method. The model could predict the amount of

materials and the cost of construction based on

historical similar cases. Based on 145 schools from

2001 to 2005 that were constructed through the

design-bid-build delivery method, an artificial

(3)

A Quantity Prediction Model for Reinforced Concrete and Bricks in Education Facilities Using Regression Analysis

neural network model for the construction estimate of an education facility at the planning phase was suggested in Kim’s study[2].

In terms of BTL projects, Lee et al.[10] developed a system for estimating the government’s payment in a BTL project using Visual Basic. The result of the developed system shows a decreased analysis time. In addition, it is possible to analyze the fea- sibility of a BTL project. Seo explained how to or- ganize the BTL project of an education facility and how to deal with the decision-making for finance cost. Based on the results of the study, Seo em- phasized the importance of financial and operation and maintenance cost[11]. In Lee’s study, to identify the difficulties when a BTL project is being planned, a survey of major stakeholders was conducted. The result of the study showed that the priority was to develop the economic analysis sys- tem[12]. Kim et al.[13] developed the regression model to predict total construction cost according to the spatial plan of educational facilities by inves- tigating 14 BTL projects from 2008 to 2010.

Therefore, although previous studies have been conducted related to the quantity take-off of apartment and education facility projects built through the design-bid-build delivery method, few studies have been conducted on the BTL projects.

This study suggests an accurate and reliable quan- tity take-off method for BTL projects that uses the regression model.

4. Data analysis

4.1 Descriptive analysis

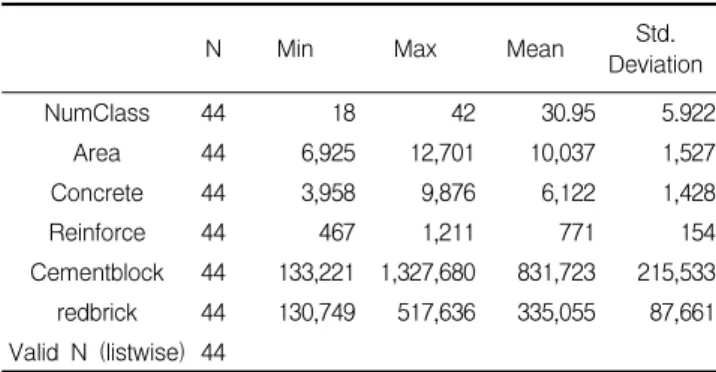
This study is conducted based on the bill of quantity for 44 education facilities built from 2006 to 2009 for the Gyeonggi Provincial Office of Education. The quantity of reinforced concrete, ce- ment block, and red brick is collected in each

facility. Table 1 provides a descriptive analysis of the collected data.

Table 1. Descriptive analysis

N Min Max Mean Std.

Deviation

NumClass 44 18 42 30.95 5.922

Area 44 6,925 12,701 10,037 1,527

Concrete 44 3,958 9,876 6,122 1,428

Reinforce 44 467 1,211 771 154

Cementblock 44 133,221 1,327,680 831,723 215,533 redbrick 44 130,749 517,636 335,055 87,661 Valid N (listwise) 44

In this study, to predict the quantity of reinforced concrete and bricks, the category variable is first set according to whether the project is for an ele- mentary school, a middle school, or a high school.

Second, according to the educational facility master plan, the number of classes, the number of floors, and the total floor area are set as the independent variables[2]. Third, as the dependent variables, the reinforcing bar, concrete, cement block and red brick are set. As shown in Table 1, the number of classes ranged from 18 to 42. The total floor area ranged from 6.925m

2

to 12,701m

2

.

4.2 Correlation analysis

Table 2 represents the correlation results between

variables such as the number of classes, the total

floor area, the quantity of concrete, reinforcing bar,

cement block and red brick. As shown in Table 2,

first, since the p-value is less than 0.05, the num-

ber of classes is significantly related to all

variables. In other words, as the number of classes

is increased, the total floor area and the quantity of

concrete, reinforcing bars, cement blocks and red

bricks are also increased. Second, the total floor

area is positively related to the number of classes,

the quantity of concrete, reinforcing bars and ce-

ment blocks. However, since p-value is higher than

(4)

NumClass Area Concrete Reinforce Cementblock redbrick

NumClass Correlation 1 .833(**) .624(**) .632(**) .423(**) .332(*)

Sig. (2-tailed) .000 .000 .000 .004 .028

N 44 44 44 44 44 44

Area Correlation .833(**) 1 .715(**) .795(**) .306(*) .200

Area Sig. (2-tailed) .000 .000 .000 .043 .193

Area N 44 44 44 44 44 44

Concrete Correlation .624(**) .715(**) 1 .816(**) .042 .313(*)

Concrete Sig. (2-tailed) .000 .000 .000 .789 .059

Concrete N 44 44 44 44 44 44

Reinforce Correlation .632(**) .795(**) .816(**) 1 .127 .229

Reinforce Sig. (2-tailed) .000 .000 .000 .411 .135

Reinforce N 44 44 44 44 44 44

Cementblock Correlation .423(**) .306(*) .042 .127 1 .232

Cementblock Sig. (2-tailed) .004 .043 .789 .411 .129

Cementblock N 44 44 44 44 44 44

redbrick Correlation .332(*) .200 .313(*) .229 .232 1

Sig. (2-tailed) .028 .193 .059 .135 .129

N 44 44 44 44 44 44

** Correlation is significant at the 0.01 level (2-tailed).

* Correlation is significant at the 0.05 level (2-tailed).

0.05, there is no relationship between the total floor area and the number of red bricks. Third, although there is a significant relationship between the quan- tity of concrete and the number of classes, the total floor area, and reinforcing bars, there is no rela- tionship with the other variables. Fourth, the number of cement blocks is only related to the number of classes, and the number of red bricks is correlated to the number of classes. As a result, the number of classes and the total area, representing the proj- ect size, has a significant relationship with the quantity of all materials.

4.3 Regression analysis

4.3.1 Hypothesis and model development

In this study, in order to predict the quantity of reinforced concrete and brick, the following hypoth- eses are established and the regression model is developed. After that, the established hypotheses are verified through the check for normality.

1) The quantity of reinforced concrete used in an education facility can be predicted by the re- gression model according to the independent variable, the total floor area, the number of

floors and the number of classes.

2) The quantity of cement blocks and red bricks can be predicted by the regression model ac- cording to the independent variable, the total floor area, the number of floors and the num- ber of classes.

In detail, a regression model with one-way ANOVA analysis is developed in this study. The following Equations (1), (2), (3) and (4) are es- tablished to estimate the quantity of reinforced concrete, cement blocks and red bricks, respectively.

  

 

×   

×  

×  

× 

×  - (1)

  

 

×   

×  

×  

× 

×  - (2)

  

 

×  

×   

×  

× 

×  - (3)

  

 

×  

×   

×  

× 

×  - (4)

Where,

C : the quantity of concrete (m

2

), R : reinforcing bar (ton)

CB : cement block (ea), RB: red brick (ea) NC : the number of class, A: the total floor area, GL : the number of floor on the ground

BGL : the number of floor below the ground

(5)

A Quantity Prediction Model for Reinforced Concrete and Bricks in Education Facilities Using Regression Analysis

CL : the classification (0:elementary, 1:middle, 2:

high) developed model

Table 3. Coefficient Results

Variable B Std.

Error t value p

value VIF

Concrete

(Constant) 241.2 1347.5 .179 .009 Class 4.0 258.0 .016 .008 1.8 NumClass 30.6 60.8 .504 .017 5.0

Area 0.6 0.2 2.472 .018 6.2

GL -363.8 325.3 -1.118 .271 1.4 BGL 282.6 345.3 .818 .118 1.0

Reinforcing bar

(Constant) 2.7 122.2 -.023 .022 Class 42.4 23.4 1.812 .018 1.8

NumClass 4.1 5.5 .744 .032 5.0

Area .06 .02 2.560 .015 6.2

GL -12.3 29.5 -.418 .078 1.4 BGL 24.1 31.3 .772 .445 1.0

Cement Block

(Constant) 336,809 265,624 1.268 .013 Class 3,624 50,861 -.713 .031 1.8 NumClass 13,127 11,994 1.095 .041 5.0

Area 2.1 51.7 .042 .012 6.2

GL 34,725 64,127 .542 .091 1.4 BGL -58,738 68,073 -.863 .394 1.0

Red Brick

(Constant) 252,114 103,530 2.435 .020 Class 14,625 19,823 -2.596 .013 1.8 NumClass 1,321 4,674 .283 .029 5.0 Area 21.6 20.1 1.073 .001 6.2 GL -17,1 24,9 -.685 .497 1.4 BGL 22,784 26,532 .859 .396 1.0

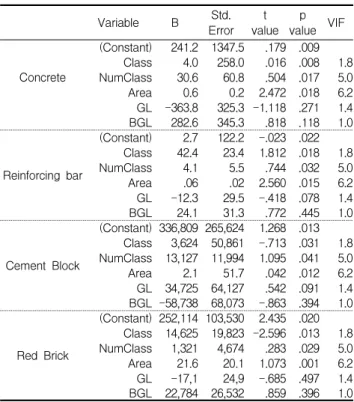
Table 3 represents the coefficient of the re- gression models. The Class variable shows the cat- egoriy variable. In the variable, 0, 1 and 2 represent the elementary, middle and high schools, respectively.

     ×  ×   × ---- (5)

     ×  ×   × --- (6)

     ×  ×    × -- (7)

     ×   ×    × -- (8) Table 4 shows the R

2

of each regression model.

As the coefficient of determination, the R

2

indicates how well data points fit a line or curve. In other words, the R

2

provides a measure of how well ob- served outcomes are replicated by the model.

Table 4. R Square Results

Model R R2 Adjusted R

Square Std. Error of the Estimate

Concrete 0.737 0.542 0.481 1041.191

Reinforcing

bar 0.821 0.675 0.631 94.455

Cement block 0.634 0.527 0.423 236.111

Red brick 0.530 0.481 0.462 993.491

** Predictors:(Constant), NC, A, GL, BGL, CL.

* Dependent Variable: C, R, CB, RB.

With the adjusted R

2

developed in this study, the quantities of concrete, reinforcing bars, cement blocks, and red bricks are shown as 0.481, 0.631, 0.423 and 0.462, respectively. Therefore, using the regression model, the quantities of concrete and re- inforcing bar can be predictable as 48.1% and 63.1%, respectively. In addition, cement block and red brick can be estimated as 42.3% and 46.2%.

Furthermore, the rest of each regression model can be explained by the unknown variables.

4.3.3 Check for validity

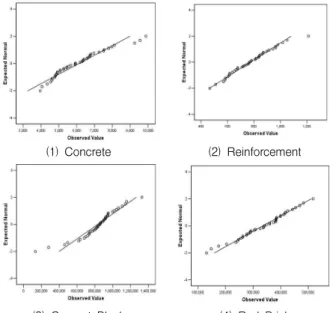
Before proceeding to the interpretation, it is es- sential to confirm that the residuals are normally distributed. As the method to check for normality, Table 5 shows whether or not the residuals are normally distributed numerically.

Table 5. Check for Normality

Kolmogorov-Smirnov Shapiro-Wilk Statistic df Sig. Statistic df Sig.

Reinforce .072 44 .200 .984 44 .805

Cementblock .121 44 .103 .935 44 .056

redbrick .089 44 .200 .986 44 .852

Generally, when the sample size is higher than 50, the Kolmogoro-Smirnov test is used. In this study, both tests are used to check for normality.

As shown in Table 5, p-value is higher than 0.05,

which proves that the residuals are normally

distributed.

(6)

(1) Concrete (2) Reinforcement

(3) Cement Block (4) Red Brick

standardized residuals confirms that the models are normally distributed. Therefore, the check for nor- mality proves that the developed models are sig- nificant and can be used to predict the quantity of materials.

Figure 1. Q-Q plot of standardized residuals for each model

5. Conclusion

This study suggests a quantity prediction model for reinforced concrete and bricks in education fa- cilities in the planning phase using regression analysis. The data of the 44 education facilities projects collected from Gyeonggi-do was used in the regression model. The quantity of reinforced concrete and bricks was used as the dependent variable, and as the independent variable, the total floor area, number of classes, and number of floors were collected.

The result of the correlation showed that there is a significant relationship between the number of classes, the total floor area, and the quantity of materials, regardless of the number of floors. In particular, since the R

2

of each developed model is

crete, reinforcing bars, cement blocks, and red bricks can be explained 48.1%, 63.1%, 42.3%, and 46.2%, respectively, based on the developed model.

In other words, it indicates that there are unknown variables to predict the quantities. Therefore, in the future, a study should be conducted that considers unknown variables such as the size of each class or other influencing factors. In addition, the validity of the model to quantify the materials was confirmed since there is no heteroscedasticity problem found through the check for normality.

This study can be utilized for major stakeholders to correctly predict construction costs by estimating the appropriate quantities of reinforced concrete and bricks in the planning design phase. However, since the data were collected from 2006 to 2009 and only involve facilities built for the Gyeonggi Provincial Office of Education, the scope of this study is limited. Therefore, in the future, additional research should be performed after collecting data on educa- tion

Acknowledgements

This work was supported by the 2013 Research Fund of Youngsan University.

References

1. Ministry of Strategy and Finance. Social overhead capital status and improvement [Internet]. Sejong: Ministry of Strategy and Finance; 2013 May 31[cited 2013 June 16]. 166 p. Available from: http://www.mosf.go.kr/policy/poli- cy01.jsp.htm

2. Kim CY, Son JH. A study on the model of artificial neural network for construction cost estimation of educational fa- cilities at conceptual stage. Journal of the Architectural Institute of Korea. 2006 Jun;7(4):91-9.

3. Kim SM, Cho JH, Lee JS, Chun JY. Cost estimating model of

structural elements using approximate quantity survey in

(7)

A Quantity Prediction Model for Reinforced Concrete and Bricks in Education Facilities Using Regression Analysis

preliminary building design phase. Journal of the Architectural Institute of Korea. 2009 Dec;25(12):155-64.

4. Jeon YI. A study on the analysis and the prediction of the cost for the school construction [master's thesis]. [Daejeon (Korea)]: Mokwon University; 2004. 133 p.

5. Park YJ, Won SK, Han CH, Lee JB. A study on 3D BIM col- laborative approximate estimating model of structural work for apartment projects. Journal of the Architectural Institute of Korea. 2011 Jun;27(6):123-30.

6. Seong JH, Kim GH. A study on the development of BIM guideline for apartment house. BIM conference. 2012 May;2(1):5-6.

7. Lee MK, Chin SY. A study on the accuracy of BIM-based quantity take-off of apartment interior. Journal of the Korea Institute of Construction Engineering and Management. 2013 Jan;14(1):12-22.

8. Kwon OB, Son JH, Lee SH. Study on the application of 3D-base BIM for school facilities to increase cost manage- ment efficiency. Journal of the Korea Institute of Building Construction. 2010 Dec;10(6):49-60.

9. Kim JH, Lee MH, Lee HK. The estimation of construction cost by using the actual information in the educational building projects. Journal of the Regional Association of Architectural Institute of Korea. 2005 Nov;7(4):89-96.

10. Lee CK, Cho BH, Park TK. A survey on the persons in charge for economic estimation analysis and improvement of BTL projects. Journal of Korea Institute of Construction Engineering and Management. 2007 Aug;8(2):73-80.

11. Seo CS. Financing of educational lnfrastructure in private investment(Build-Transfer-Lease). Journal of the Architectural Institute of Korea. 2006 Feb;50(2):89-91.

12. Lee CK, Cho BH, Jung YH, Park TK. A study on developing the calculation system of disbursement for government on the BTL projects. Journal of Korea institute of Construction Engineering and Management. 2009 Mar;10(2):93-101.

13. Kim JW, Lee BR, Kim JH, Kim JJ. A study on construction

cost estimation model according to the spatial planning of

educational facilities using regression analysis. Journal of

Architectural Institute of Korea. 2011 Aug;27(10):103-10.

수치

Table 1. Descriptive analysis
Table  3  represents  the  coefficient  of  the  re- re-gression models. The Class variable shows the  cat-egoriy variable
Figure 1. Q-Q plot of standardized residuals for each model

참조

관련 문서

Using 1987 data, had 46,400 traffic fatalities in 1924 billion miles or 24 fatalities/billion vehicle miles.. 37% drivers, 18% passengers, 14% pedestrians, 9%

According to Park Chung-bin and Viroli, respecting contributors of liberty properly and using their lives as a model for education positively affects

For the association study, I analyzed the correlation of each SNP for Alzheimer's disease by logistic regression models using Additive genetic model after adjustment of

This work builds inversely a base performance model of a turboprop engine to be used for a high altitude operation UAV using measured performance data,

Global structural analysis model of the 300K VLCC by using the developed method. (Shell element, 1-D

P01C16 Estimation of Siphon Break in a Research Reactor using CFD Analysis Hong Beom Park, Kyoungwoo Seo, Seong Hoon Kim, and Dae Young Chi(KAERI).. P01C17 Development of

In this thesis, a methodology using the VISSIM simulation model and surrogate safety assessment model (SSAM) was utilized to quantify the impacts of the leading

Third, this study developed a music education program using block coding that can be used in music class, explained its content and functions and