Efficiency evaluation of nursing homes in China's eastern areas Based on DEA-Malmquist Model
Ting Chu
1, Jae-yeon Sim
2*1
Associate Professor, The School of Nursing, Zhejiang Chinese Medical University
2
Professor, Dept. of Business Management, Sehan University
DEA-Malmquist를 활용한 중국 동부지역 요양원의 효율성 평가에 관한 연구
초정
1, 심재연
2*1
절강중의약대학교 간호학과 부교수,
2세한대학교 경영학과 교수
Abstract Nursing home plays a role in providing elderly care in the context of China's rapid population aging, but little understanding of the efficiency of the nursing homes. In this paper, we investigated the efficiency in nursing homes using Data Envelopment Analysis (DEA) and Malmquist index (MPI) for the modeling of the number of nursing home beds, fixed assets, and medical personnel as input variables, and the number of elderly people of self-care, the number of elderly people of partial self-care, the number of bed-ridden elderly people and the income of nursing homes as output variables.
Stratification analysis showed that the top two provinces in the DEA-CCR yield were Beijing and Shanghai in the five-year survey period. Four provinces (Beijing, Jiangsu, Shandong, and Shanghai) scored 1.00 in terms of DEA-BCC yield. The MPI analysis showed that Hainan ranked the highest five-year average in the included provinces. In terms of resource utilization, internal management, operation scale, and other aspects, the nursing homes in the provinces with high-efficiency evaluation results show high efficiency and technological progress, whereas the areas with low-efficiency evaluation showed a feature of the improving technical efficiency.
Key Words : Efficiency, Data envelopment analysis, Malmquist index, Nursing homes, China's eastern areas
요 약 중국의 급속한 인구 고령화 상황에서 요양원은 노인요양을 제공하는 역할을 하고 있지만 요양원의 효율성에 대한 이해는 거의 없었다. 본 논문은 요양원의 효율성 향상전략을 제안할 목적으로 DEA 및 Malmquist 지수 분석을 활용하여 평가하였다. 효율성 평가지표는 병상의 수, 고정자산, 의료인원의 수를 투입변수로 하고, 자가간호 가능노인 의 수, 부분간호 가능노인의 수, 와상노인의 수, 요양원의 수입을 산출변수로 하여, 계층화 분석결과 DEA-CCR에서는 베이징과 상하이가 조사기간 5개년동안 1.00의 결과를 나타냈고, DEA-BCC에서는 4개 지역(베이징, 장쑤, 산둥, 상하 이)이 가장 높은 결과를 나타났다. Malmquist 지수(MPI)에서는 하이난이 가장 높은 것으로 나타났다. 효율성 평가 결과가 높은 성(省)의 요양원은 자원활용, 내부관리, 경영규모 등에서 효율적이고 기술 진보적인 반면, 효율성 평가가 낮은 지역의 요양원은 기술효율이 높아지는 특징을 보였다.
주제어 : 효율성, DEA 분석, Malmquist 지수, 요양원, 중국 동부지역
*This Paper was supported by the Sehan University Fund in 2021.
*Corresponding Author : Jae-yeon Sim([email protected]) Received April 30, 2021
Accepted July 20, 2021 Revised June 30, 2021
Published July 28, 2021
1. Introduction
China has rapidly entered the age of aging.
Building an efficient elderly care system to meet society's demand for elderly care has become a serious social issue. Nursing homes are an essential part of the elderly care system. The efficiency and quality of nursing homes play an essential role in the sustainable development of the elderly care system [1]. At the end of 2019, China has 253.88 million people equal or greater than 60 years old, and 176.03 million people are equal or greater than 65 years old, accounting for 18.1% and 12.6% of the total population respectively [2]. The World Bank predicts that the proportion of China's population over the age of 65 will increase to 26% by 2050, and one out of five Chinese will be older than 65 years [3]. In the meantime, there are regional and urban-rural differences in China's aging population; and the aging process in developed areas along the east coast is significantly faster than that in underdeveloped regions in the west [4]. Shanghai enters an aging society as early as 1979, and developed provinces such as Zhejiang also enter an aging society around 1990. Currently, the proportion of the elderly in the total population in developed areas is more than 20% [5].
The aging population brings severe challenges on elderly care and has a profound impact on economic growth and social development [6].
According to the "Statistical Bulletin on the Development of Civil Affairs in 2019", at the end of 2019, there are 204,000 nursing homes in China, with a total of 7.75 million elderly care beds (an increase of 6.6% than 2018). The number of beds per 1,000 older adults is 30.5[2].
However, to ensure the long-term development of the elderly care system, the number of nursing homes and beds must be increased. By the way, it is more important to improve the efficiency and quality of nursing homes. Strengthening funds investment, talent cultivation and
improving efficiency is a feasible solution to meet society's demand for elderly care [3].
According to data from China Civil Affairs Statistical Yearbook, 2019, there are 1020 nursing homes in China with 500 beds or more.
Among them, there are 610 in the eastern area (accounting for 59.8%), 231 in the central area (accounting for 23.8%) and 167 in the western area(accounting for 16.4%). Therefore, it is representative and feasible to study the efficiency of nursing homes in China's eastern areas[7].
2. Literature review
The general definition of efficiency refers to the ratio of resource input to production output.
For nursing home, the efficiency refers to the most effective use of social resources to meet needs of the elderly[8]. Nursing homes have some social welfare characteristics, and their efficiency cannot simply be evaluated by profitability. In the meantime, it is not easy to assess the efficiency and quality of nursing homes in China because of the diversities of nature, funding sources, and operating modes of nursing homes [9]. Data envelopment analysis (DEA) is used to assess the efficiency of nursing homes. It is a nonparametric method proposed by three operations researchers to evaluate the efficiency of non-profit organizations [10]. DEA belongs to the intersection of mathematics, operations research, mathematical economics and management science. It can be used to deal with the efficient evaluation of decision-making in the complex situation of multiple inputs/outputs and provide decision-making information for managers [11].
Sexton et al. use DEA for the first time in 1989 to
conduct a performance evaluation of nursing
homes [12]. Since then, DEA has been widely used
to evaluate nursing homes' technical efficiency
[13,14]. Nyman and Bricker used DEA to study the
efficiency differences among 184 nursing homes in Wisconsin United States of America and found that nursing homes with high occupancy rates/profit-making are more efficient [15]. Fizel and Nummikhoven's survey of 163 nursing homes in Michigan further verified that for-profit nursing homes are more efficient [16]. Kooreman evaluates the efficiency of 292 nursing homes in the Netherlands, and uses Tobit regression to explore the influencing factors of nursing homes' efficiency [17]. Rosko and Aaronson use the DEA to assess the efficiency of 461 nursing homes in Pennsylvania, United States of America. They also found that profit-making nursing homes are more efficient, and the main factors affecting efficiency including occupancy rate of beds, size of nursing homes, and per capita income [18]. Garavaglia uses DEA to assess the efficiency of 40 nursing homes in Lombard of Italy. It finds that nursing homes' nature significantly affects the efficiency of care and that private nursing homes' efficiency is higher than that of public ones [19]. Dulal uses a two-stage data DEA to assess the efficiency of 338 nursing homes in the United States. His results show that there are different correlations between quality dimensions and technical efficiency. Therefore, he recommends that multiple dimensions of quality be considered in the efficiency evaluation of nursing homes.
Patient care can be improved by improving the quality of nursing services rather than simply increasing the number of staff per resident [20].
Björkgren uses DEA to measure the efficiency of 64 nursing homes in Finland; the efficiency evaluation index including cost, technology, configuration, and scale efficiency. The results show that each nursing home's efficiency is very different; however, better management/resource allocation and an increase in the number of registered nurses play an essential role in improving the efficiency of nursing homes [21].
In China, Zhou and Chai use DEA to assess the technical efficiency, pure technical efficiency,
and scale efficiency of 75 nursing homes in Ningbo, and find that improving the utilization rate of fixed assets/business income and optimizing resource allocation are conducive to improving the efficiency of nursing homes [22].
Ren analyzes the comprehensive efficiency and scale efficiency of nursing homes with different natures and bed sizes in Xiamen and finds that both average efficiency and proportion of DEA effective units are better in public nursing homes than in private ones [23]. Huang uses DEA to explore nursing homes' operating efficiency in Ningbo; he finds that private nursing home is the most efficient one, and significant nursing homes are more efficient than small ones [24]. Tian investigates 45 nursing homes in Shandong province, and he found that the operational efficiency of more than half of nursing homes needs to be further improved. Each nursing home's operating efficiency is significantly affected by the public or private, establishment time, investment amount, number of elderly residents, charging standards, government construction, and operating subsidy [25]. Zeng uses the BCC model in DEA to quantitatively assess the efficiency of nursing homes; he also uses the DEA-SBM model to measure/rank the technical efficiency of nursing homes and conducts Tobit regression to analyze the affecting factors of efficiency. A total of 32 nursing homes are investigated. He finds that private nursing homes' efficiency is higher than that of public ones, and the efficiency of urban nursing homes is higher than that in rural areas. The longer the staff's working experience, the more staff training, the higher the occupancy rate of beds, and the higher the technical efficiency of nursing homes [26].
3. Methods
3.1 DEA model analysis
DEA is a nonparametric analysis method especially suitable for complex systems with multiple inputs and multiple outputs [27-29].
DEA uses mathematical programming models to evaluate the relative effectiveness of decision-making units (DMU). Each DMU in the same evaluation group has the same kind of resource consumption; each DMU has the exact input index and the same output index. The DMU is lined up on the grade, and gives a DEA-efficient-DMU or non-DEA-efficient- DMU and the gap between them [30]. There are two basic models including the BCC model with the variable radial return to scale and the CCR model with the constant return to scale; the two models above do not add the relaxation variable to the objective function and is likely to cause the deviation of the measurement results generated by the radial and angle. Using the DEA model, each decision-making unit's efficiency value can be determined, including comprehensive technical efficiency value, pure technical efficiency value, and scale efficiency value. The values above can be used to correct the input and output of the ineffective DEA decision-making unit. The DEA decision-making unit's input can be transferred to the effective project, thereby improving production efficiency [30].
3.2 Malmquist index analysis
Malmquist index was first used by Malmquist in 1953, and Fare et al. use Malmquist productivity index to assess total factor productivity (TFP) growth in 1994 [31]. This method fills the gap that the traditional DEA model cannot dynamically analyze the efficiency changes, and the equation is listed as follows:
TF𝑃 =T𝐹𝑐ℎ × TE𝐶𝐻𝑐ℎ − 𝑃E𝑐ℎ × SE𝑐 ℎ × TE𝐶𝐻𝑐ℎ
In the equation above, TEch represents technical efficiency change from stage t to stage t+1. When TEch>1 means that the technical efficiency is improved; otherwise, it indicates a
decline. TECHch represents the influence of the technology progress index from t to t+1 on the efficiency change trend. When TECHch>1 means that the technology is progress and the efficiency is an improvement; otherwise, it indicates that the technology is not progress and the efficiency is not an improvement. In this study, each province in China's eastern areas is taken as a DMU to calculate the changes of TFP by Malmquist index analysis.
3.3 Selection of indicators
The number of elderly care workers, the number of beds, fixed assets, business input, the total number of services, and institutional area are often used as input-output indicators to evaluate nursing homes' efficiency [23-26]. Only by integrating human resources, material resources, and financial resources can we better assess nursing homes' efficiency [32]. Therefore, this study divides nursing homes' input into three aspects: labor input, capital input, and material input. Considering the availability and accuracy of data, the number of professional and technical personnel represents labor input. The fixed assets of nursing homes represent capital input, and the number of beds of nursing homes is used to describe material input. When studying nursing homes' efficiency, many scholars tend to use case combinations to measure the output, such as Sexton, Nyman, Fizel and Kooreman [12-17]. According to the economic theory of production factors, some scholars believe that the output factors should be divided into economic and social factors, such as Ren and Tian [23, 25]. Considering nursing homes' particularity, this study uses the business income to represent economic factors and uses elderly case combinations to represent social factors.
Therefore, in this study, the input index
including the number of beds, number of
professional and technical personnel, and fixed
assets; and the output index including the
DMU Year
2014 2015 2016 2017 2018
BeiJing 1.000 1.000 1.000 1.000 1.000
FuJian 0.801 1.000 1.000 0.984 1.000
GuangDong 0.991 1.000 1.000 1.000 1.000
HaiNan 0.695 1.000 1.000 1.000 1.000
HeBei 0.664 0.886 0.848 0.770 0.805
JiangSu 1.000 1.000 1.000 1.000 1.000
LiaoNing 0.860 1.000 0.942 0.909 0.999
ShanDong 1.000 1.000 1.000 1.000 1.000
ShangHai 1.000 1.000 1.000 1.000 1.000
TianJin 0.854 1.000 1.000 1.000 1.000
ZheJiang 0.861 0.769 0.770 0.866 1.000
Avg. 0.884 0.969 0.960 0.957 0.982
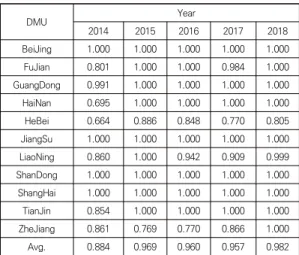
Table 3. Result of DEA model about BCC- output in 2014-2018
DMU Year
2014 2015 2016 2017 2018
BeiJing 1.000 1.000 1.000 1.000 1.000
FuJian 0.793 1.000 1.000 0.958 1.000
GuangDong 0.794 1.000 0.972 0.833 1.000
HaiNan 0.677 1.000 1.000 1.000 1.000
HeBei 0.501 0.833 0.762 0.767 0.740
JiangSu 0.656 0.805 0.772 0.706 0.825
LiaoNing 0.818 1.000 0.928 0.908 0.965
ShanDong 0.807 1.000 0.993 0.884 0.837
ShangHai 1.000 1.000 1.000 1.000 1.000
TianJin 0.852 1.000 1.000 1.000 1.000
ZheJiang 0.678 0.730 0.713 0.776 0.880 Avg. 0.780 0.943 0.922 0.894 0.932 Table 2. Result of DEA model about CCR- output in
2014-2018 number of self-care elders, number of self-care
partly elderly, number of unable self-care elderly and business income. It is essential to mention that the output measures must be appropriately related to the input measures so that the model meets the DEA application objectives [11].
Input-output indicators are shown in Table 1.
Item Indicators Unit
Input
Bed num. A sheet
Number of special labors People Fixed assets Ten thousand Yuan Self-care elderly num. People Self-care partly elderly num. People Output Unable self-care elderly num. People
Income Ten thousand Yuan
Table 1. Input-output indicators
3.4 Data sources
The data used in this study have come from China Civil Affairs Statistical Yearbook 2014-2018 [33], and only 11 regions are included, which is listed as follows: Tianjin, Hebei, Liaoning, Shanghai, Jiangsu, Zhejiang, Fujian, Shandong, Guangdong, Guangxi Zhuang autonomous region and Hainan.
4. Results
4.1 Results of DEA model analysis
Table 2 showed that the average CCR-output of 11 regions in China's eastern areas in 2014-2018 was 0.789, 0.943, 0.922, 0.894, and 0.932, respectively, and has volatility characteristics. The results indicated that the CCR-output of nursing homes in China's eastern areas was good, and the highest CCR-output of nursing homes was observed in Beijing and Shanghai.
Table 3 showed that the average BCC-output of 11 regions in China's eastern areas in
2014-2018 was 0.884, 0.969, 0.960, 0.957, and 0.982, respectively, which was higher than the CCR-output and also had the characteristics of volatility. By the way, these results indicated that the BCC-output of nursing homes in China's eastern areas was good, and four regions (Beijing, Jiangsu, Shandong, and Shanghai) have the highest BCC-output of nursing homes.
Table 4 showed that the average scale
efficiency(SE) of 11 regions in China's eastern
areas in 2014-2018 was 0.884, 0.972, 0.959,
0.935, and 0.948, respectively, and has the
characteristics of volatility. These results
indicated that the SE of nursing homes in China's
DMU 2014→2015 2015→2016 2016→2017 2017→2018
TECI TCI MPI TECI TCI MPI TECI TCI MPI TECI TCI MPI
BeiJing 1.000 0.712 0.712 1.000 1.324 1.324 1.000 1.278 1.278 1.000 0.323 0.323
FuJian 1.249 0.924 1.153 1.000 1.105 1.105 0.984 0.976 0.960 1.016 0.557 0.566
GuangDong 1.009 1.059 1.069 1.000 1.011 1.011 1.000 1.040 1.040 1.000 0.738 0.738
HaiNan 1.439 1.270 1.827 1.000 1.211 1.211 1.000 0.914 0.914 1.000 1.121 1.121
HeBei 1.335 0.931 1.242 0.956 1.048 1.002 0.908 1.193 1.083 1.047 0.624 0.653
JiangSu 1.000 1.144 1.144 1.000 1.080 1.080 1.000 0.995 0.995 1.000 0.746 0.746
LiaoNing 1.163 0.931 1.083 0.942 1.036 0.975 0.966 1.130 1.091 1.098 0.499 0.548
ShanDong 1.000 1.077 1.077 1.000 1.080 1.080 1.000 0.958 0.958 1.000 0.605 0.605
ShangHai 1.000 1.011 1.011 1.000 1.016 1.016 1.000 1.020 1.020 1.000 0.935 0.935
TianJin 1.172 0.889 1.041 1.000 1.095 1.095 1.000 1.038 1.038 1.000 0.717 0.717
ZheJiang 0.893 0.957 0.855 1.001 1.044 1.045 1.125 0.947 1.065 1.154 0.821 0.948
Avg. 1.115 0.991 1.110 0.991 1.095 1.086 0.998 1.044 1.040 1.029 0.699 0.718
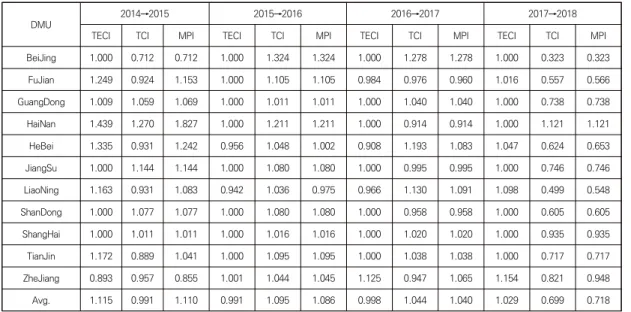
Table 5. Analysis results of productivity in 2014-2018
DMU Year
2014 2015 2016 2017 2018
BeiJing 1.000 1.000 1.000 1.000 1.000 FuJian 0.990 1.000 1.000 0.974 1.000 GuangDong 0.801 1.000 0.972 0.833 1.000 HaiNan 0.974 1.000 1.000 1.000 1.000 HeBei 0.755 0.940 0.899 0.996 0.919 JiangSu 0.656 0.805 0.772 0.706 0.825 LiaoNing 0.951 1.000 0.985 0.999 0.966 ShanDong 0.807 1.000 0.993 0.884 0.837 ShangHai 1.000 1.000 1.000 1.000 1.000 TianJin 0.998 1.000 1.000 1.000 1.000 ZheJiang 0.787 0.949 0.926 0.896 0.880 Avg. 0.884 0.972 0.959 0.935 0.948 Table 4. Result of DEA model about SE in 2014-2018
eastern areas was good, and three regions (Beijing, Shanghai, and Tianjin) have the highest average SE of nursing homes. By the way, the lowest average SE of nursing homes was observed in Jiangsu.
4.2 Results of Malmquist index analysis The Malmquist index (MPI) represents total factor productivity, which can be divided into technical efficiency change (TECI) and technological change (TCI). In this study, the
productivity of nursing homes in China's eastern areas was assessed using the Malmquist index method. Table 5 showed that the average TECI, TCI, and MPI of 11 regions in China's eastern regions in 2014-2018 were changed over time.
From 2017 to 2018, the average TCI and MPI of 11 areas in China's eastern areas declined to 0.699 and 0.718.
Fig. 1. showed that the increase or decrease of MPI is positively correlated with the increase or decrease of TECI and TCI. Among 11 regions in China's eastern areas, the highest MPI was observed in Hainan.
Fig. 1. Mean changes of MPI, TECI, and TCI in eastern
areas, 2014-2018
5. Discussion
We used the DEA model and Malmquist index method to calculate nursing homes' efficiency in 11 eastern areas of China from 2014 to 2018.
These findings suggest that it is inevitable that nursing homes' efficiency will change over time, whether in developed areas or underdeveloped areas. The efficiency of nursing homes is affected by many factors, for example, number of beds, number of professional and technical personnel, fixed assets, number of self-care elders, number of self-care partly elderly, number of unable self-care elderly, business income, government or social funding, and so on [34]. Our results further support it. Both of the data from the DEA model analysis and the Malmquist index analysis indicated that nursing homes' efficiency in China's eastern areas was good. Among the 11 regions in China's eastern regions in 2014-2018, the highest CCR-output of nursing homes was observed in two areas (Beijing and Shanghai), the highest BCC-output of nursing homes was observed in four areas (Beijing, Jiangsu, Shandong, and Shanghai), and the highest average SE of nursing homes was observed in three regions (Beijing, Shanghai and Tianjin). Beijing and Shanghai are the two regions at the forefront of the three indicators above. The reason for the above results is that the China Civil Affairs has introduced a series of policies that support the service construction of nursing homes since 2014, and conduct standardized management. Therefore, the service efficiency of the nursing homes is effectively improved [35]. In addition, because the scale of the nursing home is relatively stable, SE is less than 1.0 may be related to the low use efficiency of the bed.
The Malmquist index analysis results suggest that the total factor productivity was relatively stable from 2014 to 2015, 2015 to 2016, and 2016 to 2017. There is a positive association between
the Malmquist index and technical efficiency change or technological change. This means that the total factor productivity is likely to be affected by technical efficiency change or technological change. Interestingly, Beijing and Shanghai are at the forefront of the three indicators above from DEA model analysis. However, the highest Malmquist index was observed in Hainan but not in Beijing and Shanghai. By the way, from 2017 to 2018, the average TCI and MPI of 11 regions in China's eastern areas were declined to 0.699 and 0.718. respectively. These results indicated that the relatively stable total factor productivity from 2014 to 2017 had been broken. The decline in total factor productivity can be partially explained by (1) the improvement of medical/health care level, improvement of life quality, and extension of the average life expectancy of Chinese [2,3]; (2) by an insufficient number of nursing homes, insufficient nursing beds, and insufficient nursing staff [9]. Since the government advocates community or social pension before 2017, more old people stay at the nursing home. Therefore, 2014-2017 MPI efficiency is above 1.0. However, in 2017, China issued the 13th-five national development and pension system construction plan, advocating home pension; on the one hand, China's traditional filial piety culture advocates home pension; on the other hand, China's old people increase year by year, most of them choose home pension; and causing the 2017-2018 MPI efficiency below 1.0. By the way, China's is one very large country, the development is extremely imbalance, and the economic, cultural, and population of different regions are very different, resulting in significant differences in the efficiency of the nursing homes in different regions.
6. Conclusions
This work presents new findings for growing
debate about the efficiency of nursing homes.
The progressive aging of the population and the relative shortage of medical care funding have forced medical care regulators and practitioners to think about how to improve efficiency. The study assessed a sample of 11 regions in China's eastern areas using the DEA model and Malmquist index method over five years. These nursing homes are located in China's development regions, which are the regions with strong economic strength and financial investment to improve nursing homes' efficiency.
Our results suggested that the efficiency of elderly care in 11 eastern areas of China is relatively insufficient, which is consistent with the findings reported by Yang [4]. Our results suggest the following conclusion:
The average technical efficiency of nursing homes in Beijing (1.00) and Shanghai (1.00) was the highest in China's eastern areas from 2014 to 2018. This means that the utilization of input resources, internal management, and operation scale was relatively effective in Beijing and Shanghai.
The total factor productivity of 11 eastern areas showed regional imbalance. The total factor productivity of nursing homes in Hainan (1.00) was the highest in China's eastern areas from 2014 to 2018. The rate of technological progress was more significant than the contribution of technical efficiency.
It is well known that sample size or input-output variables will affect the results. Our work's limitation is that only 11 regions in China's eastern areas were selected for nursing homes input-output data. One study, including 31 provinces to assess nursing homes' efficiency in China, needs to be done in future.
This work we reported here has the following implications:(1) this work is beneficial to enhance the efficiency of the nursing homes in the eastern part, and provide beneficial reference and applicability for other relative
backward areas. (2)this work can provide the research material to improve and reasonably use the efficiency analysis method of nursing home, and to choosing a scientific efficiency evaluation indicator. (3) this work is helpful for pensioner managers to recognize the problems in the current pension industry, thereby promoting science and standardization for the management and operation of pension industries, and to achieving health and sustainable development of pension industries. (4) this work can provide empirical research evidence and theoretical basis for relevant government departments to revise and formulate pension policies or development plan of the elderly care industry.
In a word, we believe that efficiency studies will help improve the quality of elderly care and enhance the happiness of the elderly. Healthcare regulators and practitioners need to know how to improve efficiency and quality of care. We must be aware that the studies about the efficiency/quality of nursing homes will face numerous limitations regarding data, resources, and sample size. This work presents an example of how an efficiency analysis, using the DEA model and the Malmquist index method, could be performed in 11 regions in China's eastern areas. Our results can provide new insights and clues for improving nursing homes' efficiency and quality in China.
References
[1] G. Mu. (2000). The transformation and prospects of traditional Chinese old-age care methods. Journal of the Renmin University of China, 5, 39-44.
[2] Ministry of Civil Affairs of the People’s Republic of China. (2020). 2019 Statistical Bulletin of Civil Affairs Development. (in Chinese)
http://www.mca.gov.cn/article/sj/tjgb/
[3] United Nations. (2015). World Population Outlook.
http://esa.un.org/unpd/wpp/
[4] X. Yang. (2018). An Empirical Analysis of the
Efficiency of China's Elderly Service Industry and Its
Influencing Factors. Zhejiang : Zhejiang Gongshang University.
[5] Y. Zeng. (2010). Discussion on the Characteristics and Countermeasures of the "Two high Three big" of China's Population Aging. Population and Economy, 5, 3-9.
[6] Q. Wang. (2017). DEA method and resource allocation problem research. Beijing: China Social Sciences Press, p. 3-7.
[7] Ministry of Civil Affairs of the People’s Republic of China. (2020). 2019 China Civil Affairs Statistical Yearbook.
http://www.mca.gov.cn/article/sj/
[8] A. Tran, K. H. Nguyen, L. Gray & T. Comans. (2019).
A Systematic Literature Review of Efficiency Measurement in Nursing Homes. International journal of environmental research and public health, 16(12), 2186.
https://doi.org/10.3390/ijerph16122186
[9] X. Wang. (2015). The status quo and future development models of nursing homes in China.
Chinese market, 51, 175,178.
DOI:10.13939/j.cnki.zgsc.2015.51.175. (in Chinese) [10] R. Bhat, B. B. Verma & E. Reuben. (2001). Data
Envelopment Analysis (DEA). Journal of Health Management, 3(2), 309-328.
https://doi.org/10.1177/097206340100300207 [11] D. G. Shimshak, M. L. Lenard & R. K. Klimberg.
(2009). Incorporating Quality into Data Envelopment Analysis of Nursing Home Performance: A Case Study.
Omega, 37(3), 672–685.
https://doi.org/10.1016/j.omega.2008.05.004 [12] T. R. Sexton, A. M. Leiken, S. Sleeper & A. F. Coburn.
(1989). The impact of prospective reimbursement on nursing home efficiency. Medical care, 27(2), 154–
163. https://doi.org/10.1097/00005650-198902000-00006 [13] B. Hollingsworth, P. J. Dawson & N. Maniadakis.
(1999). Efficiency measurement of health care: a review of nonparametric methods and applications.
Health care management science, 2(3), 161–172.
https://doi.org/10.1023/a:1019087828488
[14] Y. A. Ozcan, S. E. Wogen & L. W. Mau. (1998).
Efficiency Evaluation of Skilled Nursing Facilities.
Journal of Medical Systems, 22(4), 211-224.
[15] J. A. Nyman, D. L. Bricker & D. Link. (1990).
Technical efficiency in nursing homes. Medical care, 28(6), 541–551.
https://doi.org/10.1097/00005650-199006000-00006 [16] J. Fizel & T. Nunnikhoven. (1992). Technical
Efficiency of For-Profit and Non-Profit Nursing Homes. Managerial and Decision Economics, 13(5), 429-439. Retrieved March 28, 2021.
http://www.jstor.org/stable/2487777
[17] P. Kooreman. (1994). Nursing home care in The Netherlands: a nonparametric efficiency analysis.
Journal of health economics, 13(3), 301–346.
https://doi.org/10.1016/0167-6296(94)90029-9 [18] M. D. Rosko, J. A. Chilingerian, J. S. Zinn & W. E.
Aaronson. (1995). The effects of ownership, operating environment, and strategic choices on nursing home efficiency. Medical care, 33(10), 1001–1021.
https://doi.org/10.1097/00005650-199510000-00003 [19] G. Garavaglia, E. Lettieri, T. Agasisti & S. Lopez.
(2011). Efficiency and quality of care in nursing homes: an Italian case study. Health care management science, 14(1), 22–35.
https://doi.org/10.1007/s10729-010-9139-2 [20] R. Dulal. (2018). Technical efficiency of nursing
homes: do five-star quality ratings matter?. Health care management science, 21(3), 393–400.
https://doi.org/10.1007/s10729-017-9392-8
[21] M. A. Björkgren, U. Häkkinen & M. Linna. (2001).
Measuring efficiency of long-term care units in Finland. Health care management science, 4(3), 193–
200. https://doi.org/10.1023/a:1011444815466
[22] Y. Zhou & Z. Chai. (2015). Research on the Efficiency Evaluation of Ningbo Elderly Care Institutions. Journal of Ningbo University (Humanities Edition), 3, 79-84.
[23] J. Ren. (2016). A Study on the Efficiency of Institutional Elderly Care Service-Taking Xiamen City as an Example. Population and Economy, 2, 58-68.
[24] T. Huang. (2017). Analysis on the Operational Efficiency of Ningbo Elderly Care Institutions.
Zhejiang : Ningbo University.
[25] Y. Tian, S. Cui & S. Yang. (2018). Research on the implementation effect of support policies for elderly care institutions—Based on the survey and analysis of 45 elderly care institutions in Shandong Province.
Journal of Shandong University (Philosophy and Social Sciences Edition), 3, 79-89.
DOI:10.3969/j.issn.1001-9839.2018.03.009.
[26] Y. Zeng, L. Zhang, J. Yan & Y. Fang. (2019). Research on the Service Efficiency and Influencing Factors of Elderly Care Institutions in Xiamen City Based on DEA. Chinese Journal of Health Statistics, 36(1), 13-17. (in Chinese)
[27] I. K. Kleinsorge & D. F. Karney. (1992). Management of nursing homes using data envelopment analysis.
Socio-economic planning sciences, 26(1), 57–71.
https://doi.org/10.1016/0038-0121(92)90026-2 [28] N. J. Zhang, L. Unruh & T. T. Wan. (2008). Has the
Medicare prospective payment system led to increased nursing home efficiency?. Health services research, 43(3), 1043–1061.
https://doi.org/10.1111/j.1475-6773.2007.00798.x [29] M. L. Lenard & D. G. Shimshak. (2009). Benchmarking
nursing home performance at the state level. Health
services management research, 22(2), 51–61.
https://doi.org/10.1258/hsmr.2008.008006
[30] A. Min, C. G. Park & L. D. Scott. (2016). Evaluating Technical Efficiency of Nursing Care Using Data Envelopment Analysis and Multilevel Modeling.
Western journal of nursing research, 38(11), 1489–
1508.
https://doi.org/10.1177/0193945916650199
[31] M. D. Masri & E. Z. Asbu. (2018). Productivity change of national health systems in the WHO Eastern Mediterranean region: application of DEA-based Malmquist productivity index. Global health research and policy, 3, 22.
https://doi.org/10.1186/s41256-018-0077-8
[32] N. G. Castle & J. C. Ferguson. (2010). What is nursing home quality and how is it measured?. The Gerontologist, 50(4), 426–442.
https://doi.org/10.1093/geront/gnq052
[33] Ministry of Civil Affairs of the People’s Republic of China. (2015∼19). 2014∼18 China Civil Affairs Statistical Yearbook. (in Chinese)
http://www.mca.gov.cn/article/sj/
[34] R. Weech-Maldonado et al. (2019). High Medicaid nursing homes: Organizational and market factors associated with financial performance. INQUIRY: The Journal of Health Care Organization, Provision, and Financing, 56, 0046958018825061.
https://doi.org/10.1177/0046958018825061
[35] National Development and Reform Commission of China. (2014). Notice on accelerating the construction of health and elderly services project. (in Chinese)
https://www.ndrc.gov.cn/xxgk/zcfb/tz/201410/t20141 010_964249.html
초 정(Ting Chu) [정회원]
․ 2007년 6월 : 난화대학교 간호학과(의 학사)
․ 2013년 6월 : 종산대학교 간호학과(의 학석사)
․ 2019년 ~ 현재 : 세한대학교 경영학 (경영학박사 재학)
․ 2021년 ~ 현재 : 절강중의약대학교 부 교수
․ 관심분야 : 위생경제관리, 건강관리
․ E-Mail : [email protected]
심 재 연(Jae-yeon Sim) [정회원]
․ 1985년 2월 : 조선대학교 회계학과(경 영학사)
․ 1990년 2월 : 조선대학교 대학원 회계 학과(경영학석사)
․ 1995년 2월 : 조선대학교 대학원 경영 학과(경영학박사)
․ 1995년 3월 ~ 현재 : 세한대학교 경영 학과 교수
․ 관심분야 : 회계정보시스템, 정부회계, 인적자원관리
․ E-Mail : [email protected]