$ q $ g q ~ : ~ q q x l 41153 3 3 (m5q 12%) J Korean Scc Occup Environ Hyg m5;15(3):183- 191
Comparative Study on the EXciency Test Using Remodeled Bubble Generating Pump for Aquarium Fish and Established Air Sampling Pump
Bong-Ki Jang 9
.
Jae-Young Chun.
Bu-Soon Son.
Jong-Wha Lee.
Jong-An Park Department of Environmental Health Science, S o o n c w a n g UniversityThis study is designed to compare the performance of established samplers (personal air sampler and MiniVOL poaable air sampler) commonly used in the air environment or work environment with that of the sampler made by remodehg the air bubble generator for aquarium fishes. Sampling method used in this study is the filter collection method for PMlO and total suspended particles (TSP), the liquid collection method for sulfur dioxide (SOz) and nitrogen dioxide (NOz), and the solid collection method for toluene, respectively. There is not a significant difference in the average concentration of TSP between the Gian personal air sampler (1 4 0.3 16 10.095; 2nd 0.191 kO.090; 3rd, 0.185 i0.073 mg/m3) and the remodeled sampler (lst, 0.3 17 i0.106, 2nd 0.201 i 0.050; 3rd 0.189 2 0.081 mg/m3). There are also not ~ i ~ c a n t differences in the average concentration of PMlO among the Gilian personal air sampler (0.058 k 0.006 d n f ) , the remodeled sampler (0.052 k 0.008 d m 3 ) and the MiniVOL p d l e air sampler (0.054 i 0.007 m$nf). The average concentration of the SO2 by the established sampler and the remodeled one is 3.79 k0.21 ppb and 3.45 i0.15 ppb, respectively. In addition, there are not sigmficant differences in the average concentration of the NO2 between the Gilian personal air sampler (lst, 0.325 10.068; 2nd
0.341 10.206; 3rd, 2.971 20.078 \~g/mn~) and the remodeled sampler (lst, 0.300 k0.062; 2nd 0.332 iO.144, 3rd 2.%8
+
0.085 pdrn3). There are not sigruficant differences in the average concentration of toluene between the G h personal air sampler (lst, 0.499 k0.072; 2nd 0.598 i0.112; 3rd 2.284 i0.077 fig/
rn3
and the remodeled sampler (lst, 0.463i0.133; 2nd 0.603 kO.082; 3rd 2.353 l o . 115 dm3). From these results, we can conclude that the performance of the remodeled sampler is not different fiom that of established samplers. There is possibiity that the remodeled sampler can be used as a alternative device for Gilian personal air sampler in area and personal air sampling.Key Words : air sampling pump, eficiency test, remodeled bubble generating pump, personal and area sampling
a 7 l A l i Z
f l + ) q E + +71q
%-$g a g g 9 - g 3j48171 44 % 3 @
A] i~
31 4 QH
41 (sampling media)6-l) %71 E +pi+ +%OZ 74-8140s ~4
+ 22
571%97]73., 581
h)"d-Lq -l$4%1611Aj A ] Z E
2jqg
+ 25% h)%6114 Y q A l 3 + 9
+ 9n.g
7H9h)S- 3{qgr(personal air sampling pump) +3@q. 3
31n
34 2s
7 ~ 9% l q g n +
~ 1 ~ShenvoodS+ Greenhalgh(1960)
4 4 4
3 j . l g o ~
74@5;l%q.
01g n + 5
3717)
gqq3 -S?-q4 747)
0)
t-ZxFq7ll q - $ A l 4
-l84%141~j
A l a s
%j#g+ 9 s q 3 9 q
%iq.
3 71 A]
a 41 4 9
z ( a i r samplingpump)e
~ l a 4 f l ~ H 4 p l l ~ 9 ~ 3 %
$+ZjOZ
%{fl8)k
$ 4 + A l s .314
@Jq
61101-$gq.
34)AX+!q3 3
+ qygq 7Hg
2 7 1 ~ 1 si{#g n ng$
8 ~ 1 3 o]+t7 ) % 3 + 2
y L
qg-7)"+4-
5 8 7 1 7 )3 q q q 9q.
719
$ 7 1 ~ 1 3~ { # g z + qq
zj-fi- 99
noow flow pump)9
3+%?I
frlhlgh flow pump)zLF;.- ol4 q. ag"1 zj+~'Ed"~O.oo1-0.2
Plminq
-lqol1"1 q%qz 9s 8 qag
01-$@$71q 715 44 oil h)-$gq. 3 + % g E + 3 3 4 2 Z
0.5
elmin
611 ~j 1 P Imin, 3,4 H+ 5e
Iminflxlq - l 4 6 1 1 A j
q % r l q
f Zq q x ] g
0]-$@gx\*g2q 344
"11
4-$Elq. 01tl@
$%4611s +
% a $ n5g q %A]
714 q-
E+ 01s yqA]gOsq zj+% 9 x + %
zag
Ef$%A]% + 2%
%%
n(multip1e flow pump) 5 7H35;l 61 2q.
0 1 sg n s g 4 % 'gq 4611
Aj %*+ +$$OZ
E 3 3 + 3q.
42611% zj%$*q 44 a q q
+
i$$$%%%448)71 44
-fi-;-8013 x 1 4 2 s 41olqol 9 3 @ +%01 -i+lq+ gn7) z g q ~ . 8x14
$)q
E++ 9
?$Aj (electronic flow or pressuresellsor)7)4gqq 261 54
714 -19,
$5,x r , AlaY'i;F 5 4 4 % $3611 q;H%ijFq +%% 9 4 4
A1 41ol @q.
DuPont4,
MSAh), SKch)%qAj 0)4@ 3%
;cla%uH 43 2 q .
971
gn+
+qaq]9
&.g ==%
idcl -$f-+!& % 5
i-01~
71
4@ q 4 2 Z 94 h)-$qq %
q.
01s 7flE8)$, f 271+"d
qg415"s $448]Y!
A ] i Z£4
3%1Z014-3 e 37-11 qq.
01 $A] 9-Z A l i Z
£4321 5 7)4
01~ j g i ~ " r 4 , o o o w l ~ j
10,000~ 0 1 ~ ~ )q q g ~ ~ l a
gn,~ d i l 7 1 ~Ala 3~4611 61-$2 + 3 q
359
gY!
$ 7 6 1 ] A j 0 6 ) s i-h]iZ E471Z4-$4
$ +-+5,
1991).3 q q 71g4
$%$$ A ] 3 3 { # 714Hla.iiFq
3 .'J*4 ~ 8 ) q g 3 A l a s ~ 4 W 4 %"llr
978)x 0 1 4 &g$
o)--"?3%
4 %di.
q + A j
3
$'F+4 q.'d4 4
01
9 9 8
371314 gnpF 84-17)
$31 ")-$8)kg*q-$ +q
3 $71 7]E34 7 1 s7Haqq
9-ZA l Z % { #
'51"s q71 5 "dp$ g
3 1 7
z 4
7141% 3 3 % +
717lSZ A]9s % 9 @ 93Ed4
E4~H41sx48)q g q @ gqg
H l Z $E8)brl QaA1aq
x]qA]iZ %j# A]4
* 01
ZF$mqgz $dgdiJq5! 77134qg7k q$Y?z@] gylgq413
x]
$g q q
$%,%)2%
4+g:2004$123 3 0 g , jlqg: 20059 1 2 3 7 9
zi!@j~) : 3971
?-pJ.']
+j%$ :!qd 646$x]$&QL~#qii!
@g&zjqq Tel : 041-530-1268, Fax : 041-530-1272, E-mail : [email protected])a!iFq-$ +$a 471 71E%-A871
(9 DK-8000, r;H
%a
x)$9
A))4 a71 &$yg61] 8 % 938)q
7HE@
gn(ol8)
7Hz@~ ] a 3 ] 4 7 ] ,
Remodeled pump+
71$4 41%
o ~$ 2 0 1 ~
agg
j7H9~1s. 314
71
9
constant flow air sampling pump (Gillianh) , GilAir-3, u]7.)
.g A)-$ ijFq , 599 83Ea4
271993 44 % 5 S q4£;zdqoZ$y-fi- 24 %(TSP)q z$.'Jga
$+(PMio)g, q;711e4qos p1gggzj-s -$8)q
o ] * * ~ S 0 2 ) q0)$*3&
(N@)S,
z41E4qoz 339ag AI-w)q S?$! % S Z
%FZFZF 3444
Lq A j Z
qz 83 E a q s
x \ ) q i ~ j
n4q-x
UHn+plp~q ZF ZF
57Hqg z s , ~1s-314
$3
30cmo ] q q 34 4dli)rq
*%
xlol 5 9 @ 83Z4(71P, $?
5,
71%, A]iZ%S %)q A l a s
3;zdqq % r s gq@ 34s
H ~ ZSd71-8) sq.
1)
g n +% 24 *J%
7 1 ~ 9 gnq 71Eq 9ZS 5%
d 3 % A ] 7 ] 3 , +3@Jq
611qq 4 3@ ~141ZAj q 4 4 , &q81 %C
H+ X-" a T
q%
939
gzj (impinger)s gfF-611 $a@ *d4Aj $x)4
4
g u ] ~j(Gillian primary low calibmtor,P-
N
800266-1)s 0]-$8)q += 54
8mq. 93
A l 3 L qAliZ 2 4
$611r
@&*JqoE +w q38)q
q$+$$% 9 4 q - 9 q .
(a) Electronic bubble pump for (b) Remodeled (c) Remodeled pump internal
aquarium Pump image
Fig. 1. Remodeled pump.
(diaphragm)
$24 $ 4 5
oJ$%3
941, @E
qyq a%@] 4 2 g
+7)g 8%
gg7)$-t;]x
+29 271
" , g A j 2717)8qqiI 4%
901
o ) q s4 4 9 3 w4
g227)9qiI +$4
9227)gEqq/\l
A ) S271s X;a'%)A] $ w i g . 1).
3)
7p4
h]Sirj# 71 (Established pump)7 4 ~ 3 ~ h ] s i r H +
714
H J Z471
4% 7lEq ~lgirR4 7 1 ~ 4 2
3711
q$ga
h l g x;a'h] g o ] A)%qII-
%+
7 H 9 ~ 1 ~?447)9
Gdlian
A 1 4
A] gj]4
71 (Gilh-3)01
$%)%il,
3 q q
$x1q -14
Ad
++
'&jo)!27]4
51 portable air sampler (MiniVol, AIRmetricsA))(Fig. 2)s
4-$S)iFSd q .Table 1 4 Q,Fp ~361!01]Aj
47129
$ 3 ~ 1 % % ( 3 G ? ,
20031611aF+
TSPpF P M I o ~
%w4
q+$ o]$S) 9 3 , -"?&&i#p. L T O Z - L M ~ "sJ!-%uFH~ffl6+z+gs q + ~ ) P Q q O s $4
'i;F%Q. zF?ll,Fp NIOSH(1994)
HJq
611
q+ g~dggg
o1$% x d l r 4~ O I r;a's)q
7 ) ~ 3 1 ~ ) ~ 3 4 q
(Shimadzu, GC-17A) I
2 4 81% r;F. -
1) TSP, PMIO
$3BJq
Fig. 2. Portable air sampler (Mi n Nol ).
gy+g
$(TSP)i+ 3%4
( P M I o ) ~
%s+ 48
37 mm,$8
0.8pmq
cellulose ester membrane filters 3- piece cassette 611%qS)q
6 h]7,F%O,F% E s $38)9On], PMIO S 3 h J o l J
2
lOmmq g g
A)o)jZg+ cassetteq]4-qS\%r;F. hlSirj;HW-$s TSP+ 1 Qlmin, PMIoP 1.7 QIminOI
$!38]q
r ; a ' q B s z;a'g
q4~12
q 1 ~ 1 4 o l ~ j q l ~ j 2 4 ~ 1 343 P %mY?+j
2s 3 4 8 ) B q . 2 4 ~ 1 3 PMloq
x
fi 45)q
+ g o ] 5 Q l m i n g portable air sampler (MmVol, AlRrnebicsA D S ~]$-E)%z,
q 4 4 4
pallflexmembrane filter (47 rnm, Gelman sciences hF)S Ol$S)dcJ qlh1711OIEj 46114
2) So2
+d'g%
( q q z 3 ) g g q )- $ q I &q
$gxj(rnidget impinger ) 611$+q
(potassium tetra- chloromercurate, TCM ) 10mQs
$3,+$
g5q %q
0.5 QIminqAj 1 Qlrninq + E I
g3 -f;-qq
271s+++~13
331% so2s
% + A ]S)q, 01 a+qg
palamdmoz $$+$ A)$
* g
3) No2
$;FjUJq
(* $zy#)$+ 949
[n-(1-Naphthy 1) Ethylene diamine oJ
9 + 9
,sulfadic acid
9 32
gv9j] 10 mQs
dq-rjl 4814
g + g q l $3 0.4 Q 1 g q-f;-92s
S 7 1 h l S S5 4 h l
3r;F. N 0 2 q q HJsI]'E)scJ%+$4
o i E t m ) sS-7) 71 A1
3-dcl 9q @
$44 $grs
550 nrnoll ~jbcJ
N o 2 % E s 7sFBr;F.4)
gFg
+3BJ% (%Ad q g q ) NIOSH4 33
A] $q
(Method No.1500) 611
4 31 01 Fq 30
W I O S H , 1994),BAdggS 4 - 4 g 2 1 40)
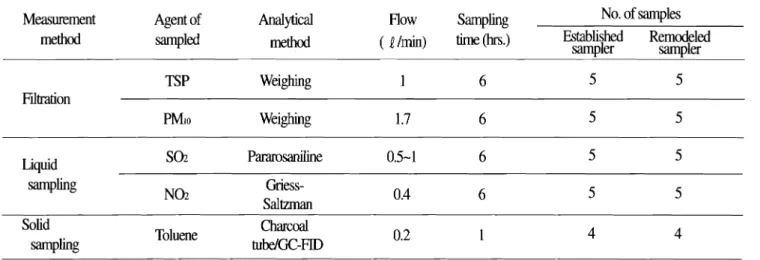
7Table 1. Analvsis and measurement method
Measurement Agent of Analpcal Flow Sampling No. of samples
method -led method ( l lrnin) time (hrs.1 Established Remodeled
sampler m l e r
TSP Weighmg 1 6 5 5
Fdtration
PMIO Weighing 1.7 6 5 5
Liquid SOz PmsaniIine 0.5- 1 6 5 5
sampling NOz Griess- 0.4 6 5
Saltzman 5
Solid
sampling Toluene Charcoal
tuWGC-FID
x \ s q gqp
SPSS 12.0% 0]+B)6cl 7HzB
A 1 a£4714
7 1 W -11a £4714 9 3 2+ 344
3401 34% HIE+ %d143%9
W ~ X O I I signed rank test(@Aj
34
71, m1.Z
58%Mq.
Table 2. Rate of flow change of established pump
Sampling Flow ( l Irnin)
No. Rate of
material Before (B) After (A) change (%)*
PMio 30 1.680 i 0.343 1.670 i0.345 0.60
TSP 30 0.920 i0.133 0.908 k0.151 1.30
No2 30 1.007kO.019 1.002i0.054 0.50
So2 30 0.819 t 0.294 0.804 k0.300 1.83
Toluene 26 0.207 k0.013 0.200 iO.006 3.38
* : Rate o f charge (96) =
B
Table 3. Rate of flow change of remodeled pump
sampling No. Flow ( elmin) Rate of
material Before After change(%)
Toluene 26 0.230 k0.050 0.220 i0.044 4.35
7 3 7 $ +
4 $qS ?5%q4 P3)$q611
Z (Table 2) $+ 0.50 -3.38% S 0133
o,F fpg4 3 q.
@233(OSHA,1998)g.L-?
~ J q q ~ j ~lail]Wq3bl]~-l
%$j%F% 7)%4]1Jh@
33 +?$+ @@gg
+5% P Z 9 x 1 51j#+gOS, A]g?I]#
713 06]Ll101%q. 5% %47! 271%$+4 4q
55%7flE9
~]5;3]]# 71qA-11; g3 a, qkg7)%\2~{]A-l 719@q.
271 %P
-$$+@3+Wable3)&0.11-4.35% % E ~ ~ J J B ) ~ ]q q ~ j 5 3 7 ) Tz]
1) TSP H ] l
q q ~ l n q q s
o 1 8 s ) q TSPSq39 $4
l q % ) qg$$s+
7)g ~1S314
7171 0.316 I&TI', 7 1 3 9 A ] S % { ~ 717) 0.317 d m ' s44
-$A)%)%O
q,
2 q%l(0.191 mgld VS. 0.201 mdm3), 3q
XK0.185 mpjm9~. 0.189 mgl m")+7 1 3 9 A l S 3 1 4
7]q]AjZ % ~ L + 574]%&4 9
-fi-G)3
X)o]4
$j%Wable 4).4714
0.058 mdm30S AjjZ3 6 1 1 -fi- 4 9
~ ) o ]4
I + ~ L + X ] g g w a b l e 5).++2$ 3
3 3 A Jgag
A\$@)q13 zqq Egg + 2% q 3 q E$cS
1Oclmo]S\9s%)uj
A C G I H ~ J A ~ ~ qlxq] 50%$q 4 4
g $ y 3 o ] 4 . 0 m 934%
Z S A J
gaqqz 3qS)z 2q
(ACGIH, 1993). Z$AJ
24
A]ACGIH
2
osHAq]Aj4 lOmm49
z
~ ) o l S z % A F - $ ~ 414-$W
1.7e lrnins %)qo+
9qx %I+. 01 3%
ACGIH 3 3 A J24
3%7]$4 n443.11 q5
3o]Wippmann, 1989).g 9 7
q1 ~j A)+ @ portable MiniVOLs0193
P M I o ~ PM254 244
Baldauf %2001)61]4S)ccJ 4%@
2 q .Chenie(2003),
t-5
3 2 0 0 4 ) 49
?"1 43)q ~ 1 q ~ l ~ s F 719~lat
qw
+-l%oiLF
7 ~ ~ 0 1 1 q t ~ ~ j461
7)
a& gg3A)4*?b1q7
37H94 TWWl IZFWE 3
Table 4. Comparison of TSP concentrations with established pump and remodeled pump
(unit :
mdm3)
First Second Third
Repeat Established Remodeled Established Remodeled Established Remodeled
sampler sampler sampler sampler sampler sampler
Mean 0.316 0.317 0.191 0.201 0.185 0.189
f S.D t 0.095 t0.106 fO.090 k0.050 f 0.073 -t 0.08 1
N.S : Notsi~nificmce between establiskd s a m l e r a r d rermdeled s a n l ~ l e r b y W k o x o n sirmedrank test
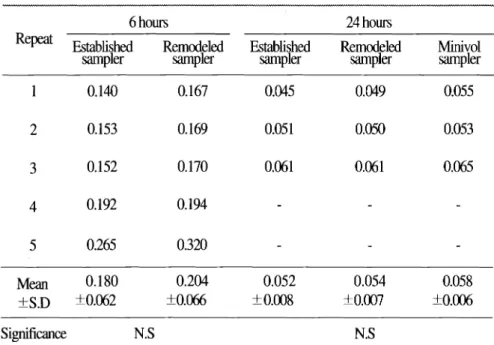
Table 5. Comparisons of PMio concentrations with established P A ) S 3 { 4 4
/.d%q
2)617) pump, remodeled pump and MinNOL sampler (unit : nlg/m3)$2 301
~J7)45jr;f.6 hours 24 hours
Rep Established Remodeled Established Remodeled Minivol
sampler sampler sampler sampler sampler
3) So2 %5 H] l
qA]X"d$6]++%)q f 3 3
So24
'413%54 13j2)61Jr;l 71e~1s
;iH
471
7) 3.79 ppb, 7 1 ~ 3A ~ s ~ H 4
7 1 5 3.45 p p b z
-+q3
2)0)7)$9 r;F.
234 3 ) (2.83 ppb vs. 2.99 ppb), 33j 2) (2.56 ppb vs. 2.55 ppb) 9 f-+q 3
3)61% $%Wable 6).
0)+$(!(1993)$ 371 k$ S0.r 7,F
01
4Stl 4%
:F7qlAj A l S r 493s
AF$~);C]23 q$g 613q q+
r ; 6 ' % i A l gg ~ q g i 3 2 ~ q
%Eg
433
H) % g q , 7 J E4
~ " 1 3 H q 7 l q +js~1x3
$ 3 5 j q . N.S : Not significance between established sampler and remodeled sampler by 4)N@ +E
HIS
Wilcoxm signed rank test.
q j ) ~ a q P
o ) + + % ) qS33
A 0 0
Z@ T
A-4,
T ) ~ A ] S ~ )7 H q ~ )
A)++%)SOq71Pq
Alg>Hq7]Q+ NOzqg $ + ~ $
l q 2 ) o l J ~ j 7 1 ~Sq 344 ~18)q 94
q q 9 r ; f X 7 H E 3 ~ ] S % j d 719
MiniVOLiZ4
~ ) ~ > j 4 7 ] 7 ) 0.325 &/mi, 7 1 3 3 A]8)%q. 3 4 4
+?glJAj?q A13
P O3 E4
A ) g 2 H 4 7 1 4 0 . 3 0 0 1 r g l m 3 0 ~ ~ E + % O 4 7 E1 1 4 5)q
7 1 3 3 ~ ] S 3 ] 4 7 1 q 714
, 2 q 3) (0.341 ,.J$~'vs. 0.332 &/m3), Table 6. Comparison of SO2 concentrations with established pump and remodeled pump(unit : ppb)
First Second Third
Established Remodeled Established Remodeled W l i s h e d Remodeled
sampler sampler sampler sampler sampler sampler
Mean 3.79 3.45 2.83 2.99 2.56 2.55
kS.D k0.21 k0.15 k0.17 k 0.08 k0.08 k0.08
N.S : Not significance between established sampler and remodeled sampler by Wilcoxon signed rank test
Table 7. Comparison of NO2 concentrations with established pump and remodeled pump
(unit :
,udrn7)
First Second Third
Re* Established Remodeled Established Remodeled Established Remodeled
sampler sampler sampler sampler sampler sampler
Mean 0.325 0.300 0.341 0.332 2.97 1 2.%8
f S.D k 0.068 f0.062 k0.206 +O. 144 k0.078 f 0.085
N.S : Not significance between established sampler and remodeled sampler by Wilcoxon signed rank test
334x1 (2.971 dm' vs. 2.968 @Im3) P 3343\ollAj 10eH?jl E
Z711 LFq9 fl LFq9 323- A J Z F g q . 7 2 %
@ 73% 3 s f3
% & 7 \ 1 , 2 3 4 3 ) ~ + 4 r-+S 5)Toluene+EH]X*able 7). Z O ~ , X\%O]
q q 4
z o l o l ~ j 3 4 ] X ; T d % O S P Z S ) ~ w.-TI- ~ kTable 8. Comparison of to1 uene concentrations with established pump and remodeled pump
(unit : , d m J )
First Second Third
Repeat Established Remodeled Established Remodeled Established Remodeled
sampler sampler sampler sampler sampler sampler
Mean 0.449 0.463 0.598 0.603 2.284 2.353
kS.D k0.072 f 0.133 k0.112 k0.082 k0.077 f 0.115
- -- - - - - - - -- - - -
N.S : Not significance between established sampler and remodeled sampler by Wilcoxon signed rank test
toluene
4 -12
%S+ 7)e A]gi1 4.1714
71E94S3114
71ZFZF
134 3\q]Aj 0.449 d m ' VS. 0.463 @lm; 2 343\q]Aj 0.598 d m 3 VS. 0.603 &m', 3q
~\q]Aj 2.284 d m 3 VS. 2.353 @/m3C g E?a49
3\017\ %%%E 8).3 q 3 \ 4
q3
Alq]?579% g y
*+ qg01 gqa
01Pq] A l g gn;Tdgo
1HA^ %w\
~ 7 1 1~ ~ e g
222
q 7 4 4 q .5 7 )
5
-+7]$xj]g xP;Xd5\2
H F H 0 klo 1 A j 7\%
$4 q-$q
&*Jq+
MOSH(1994) 4) ~j 74
33
3 A j93 %
01q. 01
HJq+ 3qrq
30?rq13
P + 5 \ J l 9 ,4i+$Zb
(bmkthmugh)
01
A]gg 31 #
5\+ o&,$ 5 ,
gr 5011
q t ~ ~ j93% +
9q 4--%011 w 5 \ q 01
9'4tO,W%5,
1994; q3+ji+ 3 5 4 , 1998).42 A l S 3 1 4 $
gE7\ ",A92
H J 3 0 1
-4
A h J g 3 1 4 71(%23
A]s%]4
71 , passive sampler) 7) 71%!q q ~ 1 Z 3
571% %71$41%$
7171s
7% 92 9q
010]1q 3 P 4
Ad$ 9 7 m a r p e r p F b e l l , 1987;t-5 5,
1994; q 3 + j %, 1 w ; 19%b,E+x\S+ q eg,
1997;q 9 qi+
$ 5 4 , 1998;%3+ 5,
2002;6)%$
5,
2004)0]i$-gq~ 3
q.
013s qz1 2714 A ) s > ] q g
E7\
g q s
+-7)$A]nP;Xdg
$9-
"d-$01304
A]g% 3 j q q 42-01q-F;
HI*\* %@S_olAj +$-aH g
9 7 q A j A]SX]# g E 1 A j4 *
-$ 7\+$jo) q 7 \ @
7 1 ~ 9
3+Jq#7]35$."J7]5
h)-$&%qq
~ j Z 9$01
q 4 714 -1]E4l4 g3S
+ 3 0 ~ 1 614
q 4 1 + 0 1A\-$- 7)%9 3 q q .
144
id+$401
" , A % \ E ~J l q A l
gj ] ] q H & 4
"
2qg
+%Ol]%*
%olJAj 3- $r .
1 1
97413
~,slqa
0) 51%94
01%cq,
-g970114
n ; l d ~ l s q % 5 7 1 4 4 1 14%sq
g 3 z a q l A j"]Fqa2."1
iL+?rqAjq Ad$Iv. 3 s
QAJq$ ++g 71394
71s71 z%\q 9s
A]g?]#714
Ad* 71E4 d7]
% + q q Z $ a A l S S 2 38\71481
hF$5\? +,,g$Xj1gq
719AlS 3 4 7 1 4
59 94~1414
g 3 a a q l A j
Mlx5\%q. qqz1 n
'"dq
2.1 *+ga(TsP)i+ u ] 4g
zl(PM10),
q4]P;Td%
0s013qqt
( s ~ q o ~ g q 2 ~ @ ) g , ~ 3 l l r ; a '
y o 1 z7gg7 %!a\ q - s 32.
1 dcl;"lJl+
q7-F
37FJl Z $ a ( q SPil9
4-)ollAj , pH A1 u \ qZFZF
5144
g ~ g 3
15q$,~]gjHq 7361 93
30cm 6144)Z)q 421 5\rq q P z1q 593 g q ~ d
(718, G r , 715, ~ l s % r
514
-11s g 245\q
E47]7]34 3p]g 4.q+ *q
g q .1. A l g
$32
8 ,qq e# a9
';tlq+
7]E4 ~lz>14717\
0.50- 3.38% S o u j ,p,Jq$ 71x9
"8715
7HE9A l S j 1 4 7 1 2
0.11- 4.35%4% 4 g ef
5%01 4 s
3\01 7) % % q .2. TSpq qj$ %S+ 7 1 g q -11s
434714
7135% ~ ] g 3 ] 4 7 ]2) (0.316k0.095 mg'm' VS. 0.317k 0.106 dm3), 2 q A\ 0.191 k0.090 mdm' VS. 0.201 k0.050 mg'm3), 334 3) (0.185
+
0.073 d m 3 VS. 0.189 k0.08 1 dm') E-4- + A F ~ \ W .
3. P M I o ~ 6 A)~,F p;zd
~ 1 4 g$
%71g4
A ] S A ] ~ ~ ] Q +7 1 3 9
A]-L
g>]
471 Z)q
0.180k0.062 ,/m3, 0.204k0.066 mg/m'g7 1 ~ 9
A ] S 314710114 "33
%+%Sg LFGLH%
0q g;t]]qzj 9
3\01?2%
o q , 2 4 ~ 1 3
~ 4 ~ 1 4 g z % s g
-
H)ii!5)71
454
x ] ~ A ] SjIq719
MiniVOL portable air sampler, 71
$4
.
"1SjH
4
712
71E9 A ) g 3 ]q 714
PMIO
g z
% g g M J Z ~34 qq
0.058 +0.006 mg/mP, 0.052 k0.008 mgfd, 0.054+0.07 m g l ~-$A\$ ' ~ ~
+$
QP
LFeLH3q.4.
q
4lP;Tdq s
0]$5\q 71g A)S
314714
71359 A 1 S4471g 233 so24 q 2 +s+
i q 3 \ (3.79 s . 2 1 ppb vs. 3.45 s . 1 5 ppb) ,234 3) (2.83 20.17 ppb vs. 2.99 kO.08 ppb), 334
3) (2.56 k0.08 ppb vs. 2.55 H.08 ppb)ef 8 4 9
3 \ ~ ] 7 \ L+E+LF~TJg$o
uj, NOzq
-13
% S k 1 4 3 1 (0.325 k0.068 @ / ~ ' v s . 0.300 H.062 %/m3), 234
3) (0.341 f 0.206 p g / d vs. 0.332k 0.144 %/m3), 334 3) (2.971 H.078 d m 3 vs. 2.%8 k0.085 FfiJ 4
+-A\4-A1
% 3 q % q .5.
5 7 3 4
323 7 ) s A]SX]
471 S+ 7 1 3 9
~ 1 ~ 3 H 4 7 13-4-
1
q 314
~j 0.499 k0.072 d m 3 VS.0.463 k0.133 K/m3, 2 4 3\ 0.598+
0.112 VS. 0.603 k0.082 d m 3 , 3
q
3) 2.284 20.077 @Im3 VS. 2.353 0.115 4 m 3 2 z44
-$A\$q%Q P
LFEF45Ir;f.ol%4 3i+ollAj +$ 41,
%'bFo14- ++g
871 7 ] P 's,F~J7]g7 f l ~ % \ q 9s
A]~ 3 4 4
714 7]$q
-1j+o] $%$ A&y$ A]Sii]#7]4
A l s q
Ad%ol]Aj @40' ;" 3\017\
92 301 LF+-+ 71Eq ~1sZ;Td
&?g ~#+Jg\q
71359 A]==214 g$
7\$4 619 q ~
q .
1 t l L F S
9 7 o l l A j 5 f 14%
r q
gT!qAj qzq%2.~-iz, 3%r
g 3 6 1 1 ~ j qlid 977)
9 q o i3 2qq.
~1
1991; 3: 21-31%!%,
499, 483,
ol"?,P
%Ad,
OIAd$, 01%;;'.Wq# x-
ray fluorescence+ high volume air samplers o J # 3
2/33
d-715
9 35
~ l i z9 ~ . g q g g q
AJ
q3)
X] 22004,14(1): 71-76%hi%, 9%#, 0193. q^,F%' P4 714
g - A J @ 9 $ oJ#$ 571%pQ -+71#;~I]
g'E3q 83 9 7 . 3;;'+qq."Jqq
1994;4(2):127-136
6159.
3171kg s&
3 0 14 9 4 7194 3% 9+. ?3 +3 q
%Liz
q714qq
1993; 2(3): 207- 216%pgf, kg*, x."oFq
.q",Fq 34
714 3 A J q q g
ol#$~ $ 9
E+%% 3 7 1 5 3% +7]
4-414 PWlii!. 3393qAJ' q3)
X] 2002; 12(3): 21 1-220EgAd, %W5,
o ] % 3 . zjlz" d l A j 371%
9
kg715oil 95E
f?sgq 93
PA ) .
$%%L*$jqq
1999; 5(2):27-37
Eqx), Y'd-3.
571% -$71-@1] 1) E$8611 33 q3EG 714 Zj-AdQ84 9+.
@'$3 WAJqqz]
1997; 7(1): 3 045
@+dg,
%%71.H8%414 olE4 241.
H e q , 20043 3 7 . q719g34Alg%. @ 4 9
X A ] 41722, 2003
Baldauf RW. Lane DD, Marob GA, Wiener RW. Performance evaluation of the portable MiniVOL particulate matter sampler. Atmospheric Environment 2001; 6087-6091
Chenie JW. The beginning of the science underpinning occupational hygiene.
Ann Occup Hyg 2003; 47(3): 179- 185 Harper M, b e l l CT. Diffusive samphg;
A review. Am Ind Hyg Assoc J 1987;
48(3): 214218
Lippmann M. Sampling aerosols by filtmtion, in air sampling instruments, 7th, ed, Hering SV, Cincinnati, OH:
American Conference of Governmental Industrial Hygienists;
1989, pp. 305-336
NIOSH. Manual of Analytical Methods.
3rd ed, Cincinnati: NIOSH; 1994 OSHA. Sampling and Analytical Method
Manual. OSHA, 1998
Sherwood RJ, Greenhalgh DMS. A personal air sampler. Ann Occup Hyg 1960; 2: 127-132