Vol. 19, No. 1, pp. 56-63, February 2015
The Study of Emission Characteristics of Biodiesel Fuel in Diesel Engines
Jeong-Kuk Yeom*†
(Received 05 October 2014, Revision received 28 January 2015, Accepted 29 January 2015)
Abstract: In this study, the exhaust characteristics of the diesel engine for the change of the mixing ratio of biodiesel fuel were quantitatively analyzed by using the numerical analysis method. As the fuel used in the experiment, the diesel and biodiesel(waste oil, soybean oil), the mixed fuel BD2(Diesel only), BD3, BD5, BD20, BD50 and BD100 were used. The injection pressure(pinj) was set to 400bar, 600bar, 800bar, 1000bar and 1200bar as the experimental variable. Also the concept of the standard deviation, Pearson’s correlation coefficient and Spearman rank-order correlation coefficient based on the statistics was introduced in order to analyze the exhaust characteristics of the quantitative NOx and Soot according to the injection pressure and the mixing ratio variation of biodiesel blending fuel. It is considered that as a result of studies, for the waste oil, NOx and Soot can be simultaneously reduced through control of the mixing ratio at the regions of pinj=400bar and pinj=600bar, and the Soot can be reduced without affecting on the emission of NOx at more than pinj=800bar. For the soybean oil, NOx and Soot can be simultaneously reduced at pinj=400bar and the Soot can be reduced without affecting on the emission of NOx at pinj=600bar.
Key Words:Biodiesel fuel, Common-rail diesel engine, Pearson correlation coefficient, Spearman rank-order correlation coefficient
*†Jeong-Kuk Yeom(corresponding author) : Department of Mechanical Engineering, Dong-A University.
E-mail : [email protected], Tel : 051-200-7640
1. Introduction
In order to respond to current stricter emission regulation, the studies on reducing of the nitrogen oxide(NOx) and particulate matter(PM) have progressed. The biodiesel when with the diesel fuel comparing, a similar physical chemical quality is having and the research is advanced1~2). The biodiesel fuel applicable to the diesel engine is the fatty acid methyl esters passing through the transesterification process using the vegetable oil
such as soybean oil and rape seed oil, or animal fats and waste oil as the catalysts. In order to be suitable the high viscosity of the triglycerides which is the main component of fats to the diesel engine, the substance abstracting by separating from water, impurities and glycerol is the biodiesel fuel. The biodiesel fuel has not a sulfur component and an aromatic polymer3), and because at the time of combustion, the oxygen components of 11%~15%
within fuel promote the combustion reaction, there are excellent effects on the reduction of soot. The studies on the biodiesel have actively progressed due to these advantage, and Seo, et al4) were compared the atomization characteristics of the biodiesel fuel to diesel fuel by experimentally
studying the spray behavior and the atomization characteristics according to the injection pressure, ambient pressure and mixing ratio in targeting the diesel fuel and biodiesel fuel. Also, Yoon et al5) reported that CO and Soot was greatly decrease according to increasing mixing ratio of biodiesel.
Therefore, in this study, the biodiesel fuel(waste oil, soybean oil) was used using the common rail system diesel engine, and the engine’s exhaust characteristics were investigated by changing the injection pressure of fuel along with the mixing ratio of diesel and biodiesel fuel. Pearson’s and Spearman correlation coefficient analyzing the correlation between two factors to quantitatively analyze the relationship for the generation of NOx and Soot putting focus to trade-off characteristics of the exhaust gas emitted according to the characteristics of the used fuel base on the experimental results were introduced6~7). Thus, the purpose of this study is that suggests the optimal fuel injection pressure for an engine and the control of the mixing ratio of biodiesel fuel for the reduction of NOx and Soot by introducing statistics-based quantitative analysis method.
2. Experimental and numerical procedure
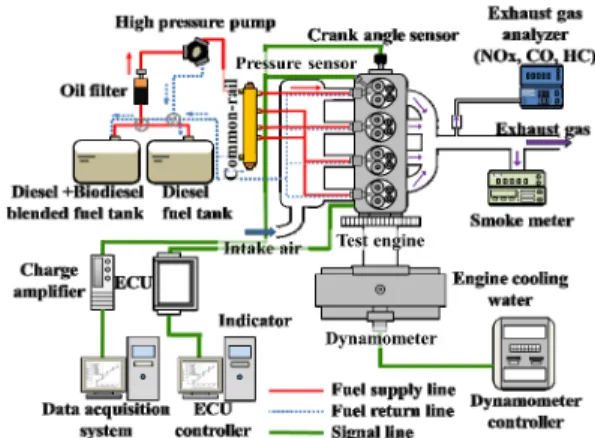
2.1 Experimental apparatus and method Figure 1 is the schematic diagram of the experimental apparatus for measuring the exhaust characteristics of the engine using biodiesel fuel.
The experimental apparatus consists of commercial common rail diesel engine, fuel supply system, EC dynamometer, engine control unit and exhaust gas analyzer, etc. IVCA V5.4 program and ECU are used to the control of the engine, and the gas effluent was measured using the exhaust gas analyzer (Horiba, MEXA-554JK) and Soot meter(AVL, Smoke meter 415S). The detailed
Fig. 1 Schematic diagram of experimental apparatus for engine combustion analysis8)
conditions of the engine experiments using biodiesel fuel are listed in Table 1. The fuel which blends diesel and biodiesel fuel (waste oil, soybean oil) were used, and BD3 in the body of this paper means that the biodiesel fuel of 3%(Volume) is blended into diesel, and in this study, the mixing ratio of biodiesel fuel for diesel fuel were experimented by producing as BD2(Diesel only), BD3, BD5, BD20, BD50 and BD100(Biodiesel only). For the measurement of the exhaust gas, NOx and Soot were measured collecting the exhaust gas from the step before going through a catalytic converter under each experimental condition.
Table 1 Experimental conditions for emissions
Engine Type : CRDI
Engine speed [rpm] 1500 Engine load(BMEP) [MPa] 0.635
Injection timing [deg.]
pilot BTDC 10
main TDC
Compression ratio 10.5
Coolant temperature [℃] 90 Injection pressure [bar] 400~1200
2.2 Correlation analysis method
Whether the relationship between two variables is or not, or the statistical analysis method for the intensity of relationship is called as the correlation analysis, and the deduction for the correlation coefficient is possible using the sample correlation coefficient. In this paper, two kinds of the correlation coefficients(Pearson’s correlation coefficient, Spearman correlation coefficient) were used, and first, the Pearson’s correlation coefficient is defined by Eq. (1) as the method analyzing the relationship between two variables.
(1)
,
Where, , are data observed, respectively, and n is the number of data., , are the average values of each data. In addition, the Spearman correlation coefficient is used to reduce the assumption for distribution between the groups and to reduce the possibility of error in the case judged that it is difficult to assume the specific distribution function for the groups. The Spearman correlation coefficient is defined by Eq.(2) as the method using , converting to ranking according to the size of each data given as , .
(2)
,
Where, , are the values determining the ranking according to the size of the data value of
, . , are the mean value of , . On the other hand, Hypothesis test is required to determine the significance of the correlation coefficient. The results of this study are assumed that depends on the Student's t-distribution that the degree of freedom approximately is .
(3)
3. Results and discussion
3.1 Analysis of engine exhaust characteristics of biodiesel fuel Figures 2 and 3 show the emission quantity of NOx and the emission quantity of Soot for the change of the injection pressure and the mixing ratio of the waste oil and the soybean oil. Where, the diesel fuel was specified as BD2 in order to compare with the conventional fuel and the result values are the average of 10 data. The injection pressure was set to 400bar, 600bar, 800bar, 1000bar and 1200bar as the experimental variables, and the biodiesel fuel was performed each the experiment by manufacturing of BD3, BD5, BD20, BD50 and BD100 according to the mixing ratio. Figures 2-(a) and 3-(a) show the emission relationship of NOx according to the change of the mixing ratio for the injection pressure of the waste oil and the soybean oil. As shown in the graphs, it can confirm the trend that the more the injection pressure is increased, the more NOx is increased. It is considered that it is resulting from the formation of the high temperature(1500℃ or more) which is the optimal condition of the NOx generation because the atomization of fuel is improved due to increase of the injection pressure, and also from the oxygen within the biodiesel blending fuel. Meanwhile, it can be confirmed that the change of the emission quantity of NOx according to the change of the
(a) NOx emission (b) Soot emission
Fig. 2 Change in the NOx and Soot generation in accordance with injection pressure and mixed fuel ratio (Waste oil and diesel)
(a) NOx emission (b) Soot emission
Fig. 3 Change in the NOx and Soot generation in accordance with injection pressure and mixed fuel ratio (Soybean oil and diesel)
mixing ratio of biodiesel fuel is relatively insignificant. Fig. 2-(b) and Fig. 3-(b) are the graphs showing the correlation Soot emission of the waste oil and soybean oil. As shown in the graphs, it can confirm the trend that the more the injection pressure is increased, the less the emission quantity of Soot becomes reduced. It is considered that the generation amount of atomization of fuel according to increase of the injection pressure is decreased by the formation of the uniform fuel-air mixture due to promote.
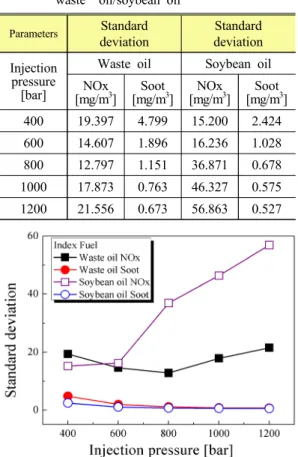
3.2 Analysis of exhaust characteristics of NOx and Soot using standard deviation
In order to more accurately analyze the difference of the emission quantity of NOx and Soot between the waste oil and soybean oil which are the biodiesel fuel, each the standard deviation for the data of the emission quantity of NOx and Soot were obtained and analyzed, and the results are listed in Table 2. If the standard deviation is large, it means that the data distribution of measurements is large with the average baseline as the center, and
Table 3 Statistical correlation analysis of linear relationship between the two variables and NOx/Soot (a) Waste oil
Pressure
[bar] Pearson
correlation Spearman correlation
400 0.809 0.7
600 0.350 0.205
800 -0.089 0.2
1,000 -0.137 -0.4
1,200 -0.095 -0.205
Total -0.732 -0.724
(b) Soybean oil Pressure
[bar] Pearson
correlation Spearman correlation
400 0.7 0.7
600 -0.757 -0.9
800 -0.865 -0.9
1,000 -0.903 -1.0
1,200 -0.845 -0.9
Total -0.8 -0.862
Table 2 Standard deviation of NOx and Soot in waste oil/soybean oil
Parameters Standard deviation
Standard deviation Injection
pressure [bar]
Waste oil Soybean oil [mg/mNOx 3] Soot
[mg/m3] NOx
[mg/m3] Soot [mg/m3] 400 19.397 4.799 15.200 2.424 600 14.607 1.896 16.236 1.028 800 12.797 1.151 36.871 0.678 1000 17.873 0.763 46.327 0.575 1200 21.556 0.673 56.863 0.527
it means that the emission quantity of NOx and Soot are significantly changed due to the change of the mixing ratio. It can be seen that as shown in Table 3, in particular, the waste oil that the standard deviation is large in the injection pressure
of 400bar is influenced more much by the mixing ratio, and the soybean oil is influenced more much the mixing ratio in the injection pressure of 600bar, 800bar, 1000bar and 1200bar. In addition, the waste oil which the standard deviation is larger in all the pressure condition has the larger effect of the mixing ratio on the soot emission quantity between the waste oil and the soybean oil as shown in Table 3. For the selection of fuel for efficient simultaneous reduction of the emission quantity of NOx and Soot from these results, the waste oil is better in comparison with the soybean oil in the injection pressure of 400 bar, and in other pressure of 600bar, 800bar, 1000bar and 1200bar, the soybean oil is more efficient for the reduction of NOx, and the waste oil is more efficient for the reduction of the emission quantity of Soot. As these results, the fuel used according to the using characteristics of a diesel engine can be characterized.
3.3 Correlation analysis
The correlation analysis was performed to analyze the linear intensity relationship of the emission quantity of NOx and Soot. Table 3 represents the relationship of the Pearson’s and Spearman correlation coefficient according to the change of the injection pressure for the waste oil and soybean oil and the mixing ratio of the biodiesel fuel. First,
Table 4 P-value for the injection pressure in NOx and Soot (a) Waste oil
Parameter NOx Soot
pressure[bar] P-value P-value
400 0.791 0.858
600 0.585 0.744
800 0.251 0.719
1,000 0.341 0.859
1,200 0.462 0.861
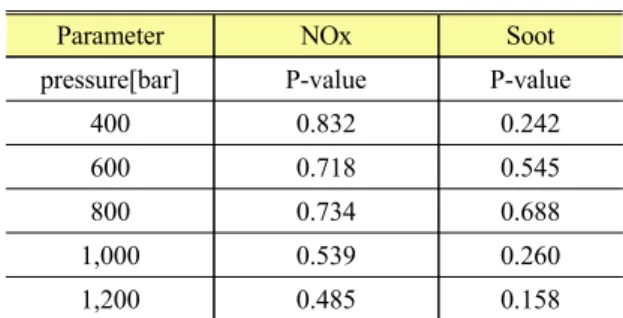
(b) Soybean oil
Parameter NOx Soot
pressure[bar] P-value P-value
400 0.832 0.242
600 0.718 0.545
800 0.734 0.688
1,000 0.539 0.260
1,200 0.485 0.158
for the waste oil, the correlation coefficient according to the change of the mixing ratio of biodiesel for the set-up pressure represent the positive relationship according to the change of the mixing ratio in 400bar and 600bar that arethe low-pressure injection area. Whereas, the negative relationship shows in 800bar, 1000bar and 1200bar that are relatively high-pressure injection area. Also, the correlation coefficient between whole NOx and Soot is expressed the negative correlation coefficient as -0.732, and as previously reported results, the relationship between NOx and Soot indicates the relationship of trade-off. The soybean oil represents the positive correlation relationship in 400bar that is the relatively low-pressure injection area, and indicates the negative correlation relationship in 600bar, 800bar, 1000bar and 1200bar that are other injection pressure. Overall the correlation represents the negative relationship as -0.8, and it can be confirmed the trade-off relationship that could be seen by the Pearson’s correlation analysis, and it is represented that the simultaneous reduction of NOx and Soot is difficult. In addition, the difference of Pearson’s and Spearman correlation coefficient is caused by Pearson’s correlation analysis method analyzing by using data, and the Spearman method conducting the correlation analysis by converting the information that this data has into the sequence score. Pearson’s correlation coefficient was used in normality data, while Spearman correlation
coefficient was used in non-normality data. In this study, data was judged as normality by conducting normality test. Therefore Pearson’s correlation coefficient was used in this study and Spearman correlation coefficient was shown as example. Table 4 was P-value of waste oil and soybean oil in NOx, Soot data. If P-value of data was lager than 0.05, data was normality.
4. Conclusions
In this paper, the characteristics of exhaust gas of the NOx and Soot according to the change of the injection pressure and the mixing ratio by volume of biodiesel blending fuel were investigated for biodiesel fuel(waste oil, soybean oil) using a diesel engine. In addition, in order to analyze the quantitative experimental results, the statistics-based standard deviation, Pearson’s correlation coefficient and Spearman correlation coefficient were used. The results obtained in this study are as follows:
(1) In the combustion characteristics of diesel engine, when using biodiesel fuel(waste oil, soybean oil), there is the trend that the generation amount of NOx generating according to increase of injection pressure is increased and Soot is decreased. The effect of the mixing ratio of biodiesel fuel on the exhaust characteristics of an engine is insignificant in all sections of set injection pressure in the case of NOx, but it can be identified that if analyzing
through the standard deviation, the affect of the change of mixing ratio on the exhaust characteristics is relatively larger in 400bar, 1000bar and 1200bar, and it is small in 600bar, 800bar in the case of waste oil. In addition, it can be confirmed that in the case of soybean oil, the more it is high pressure, the more the affect by the change of the mixing ratio of biodiesel fuel becomes larger. When using the waste oil, the influence of the mixing ratio on the emission amount of Soot is larger, and the more the pressure gets higher, the less the influence becomes small, and it becomes smaller in 800 bar or more. This tendency can be quantitatively confirmed through the standard deviation. In the case of soybean oil, the more the pressure gets higher, the less the standard deviation becomes smaller, so it can be confirmed that the affect by the change of the mixing ratio of biodiesel fuel on the Soot emission becomes larger.
(2) In order to investigate the affect of the change of the mixing ratio of diesel and biodiesel fuel on the emission amount of NOx and Soot, Pearson’s and Spearman correlation coefficient method were applied to the analysis of data. In the case of the waste oil, Pearson’s correlation coefficient values are -0.089 -0.095 in the injection pressure of 800bar and 1200bar, respectively, and it can be confirmed that because their absolute values are close to zero, the mixing ratio does not affect on the emission amount of NOx and Soot. In addition, in the case of soybean oil, Pearson’s correlation coefficient values represent the positive correlation relationship as 0.7 in the injection pressure of 400bar, and the negative correlation relationship can be confirmed in the injection pressure area of 600bar or more. These results represent that the simultaneous reduction of NOx and Soot are possible in the fuel injection pressure of 400bar, and it is shown that in 600bar of more section, the relationship of inverse proportion, that is, the trade-off relationship between the emissions of NOx and Soot exist.
Acknowledgement
This work was supported by the Dong-A University research fund.
References
1. Y. Lin, Y. G. Wu, and C. Chang, 2007,
"Combustion Characteristics of Waste-Oil Produced Biodiesel/Diesel Fuel Blends," Fuels, Vol. 86, pp. 1772-1780.
2. M. J. Hass, K. M. Scott, T. L. Alleman, and R.
L. McCormick, 2001, "Engine performance of Biodiesel Fuel Prepared from Soybean Soapstock:
A High Quality Renewable Fuel Produced from a Waste Feedstock," Energy & Fuels, Vol. 15, pp.
1207-1212.
3. S. Y. No, 2009, Bioenergy Engineering, ABCNURI, Chungbuk National University, pp.
47-60.
4. Y. T. Seo, H. K. Suh, and C. S. Lee, 2010, "A Study on the Injection Characteristics of Biodiesel Fuels Injected through Common-rail Injection System," Journal of The Korean Society of Automotive Engineers, Vol. 5, No. 5, pp.
97-104.
5. S. K. Yoon, and N. J. Choi, 2014, "Effects of Bio-diesel Blending Rate on the Combustion and Emission Characteristics in a Common Rail Diesel Engine with EGR Rate", Journal of The Korean Society for Power System Engineering, Vol. 18, No. 2, pp. 5-11.
6. W. C. Kim, 2006, "Modern Statistical,"
YONUNGCHI MUNHWASA, Seoul, pp.
256-325.
7. C. H. Jeon, M. G. Jeong, and H. S. Lee, 2004,
"Applied Statistics for Engineers," HONGRUNG PUBLISHING COMPANY, Seoul.
8. J. K. Yeom, and H. S. Ha, 2013, “An Experimental Study on Application of Biofuel to Diesel Engine," Journal of The Korean Society for Power System Engineering, Vol. 17, No. 2, pp. 29-37.
Injection Pressure (bar)
RPM load (Nm)
ambient pressure (bar)
cooling temp.
(°C) in-air (kg/h)
in-air (mg/hub)
main timing (BTDC)
1 pilot timing (BTDC)
main quantity (mg/inj)
1 pilot quantity (mg/inj)
total quantity (mg/cy c)
λ CO
(%) HC (ppm)
NOx (ppm)
CO2
(%) λ O2
(%) Soot (mg/m3)
intake temp.
(°C) exhaust
temp.
(°C) ambient
temp.
(°C) 400 1500 80 1014 67 78.69 437.1 0 10 16.677 1.6 18.278 1.853 0.01 11 651 7.96 1.86 10.04 15.24 57 425 16 600 1500 80 1014 67 78.29 434.9 0 10 17.009 1.6 18.609 1.874 0.01 13 871 7.94 1.87 10.02 6.57 60 410 20 800 1500 80 1013.9 70 77.74 431.81 0 10 16.974 1.6 18.573 1.858 0.01 15 1064 7.98 1.84 9.8 3.63 61 404 21 1000 1500 80 1013.9 70 76.72 426.13 0 10 16.355 1.6 17.955 1.836 0.01 16 1241 8.12 1.8 9.56 2.81 62 400 21 1200 1500 80 1013.7 70 74.39 413.21 0 10 15.349 1.6 16.949 1.788 0.01 17 1391 8.34 1.75 9.24 2.62 61 400 21
Appendix
<Experimental conditions for waste oil>
Injection Pressure (bar)
RPM load (Nm)
ambient pressure (bar)
cooling temp.
(°C) in-air (kg/h)
in-air (mg/hub)
main timing (BTDC)
1 pilot timing (BTDC)
main quantity (mg/inj)
1 pilot quantity (mg/inj)
total quantity (mg/cy c)
λ CO
(%) HC (ppm)
NOx (ppm)
CO2
(%) λ O2
(%) Soot (mg/m3)
intake temp.
(°C) exhaust
temp.
(°C) ambient
temp.
(°C) 400 1500 80 1023 70 77.8 432.17 0 10 16.522 1.6 18.122 1.852 0.01 8 724 8.04 1.85 10.08 11.32 61 431 18 600 1500 80 1022.9 71 77.94 432.95 0 10 16.924 1.6 18.524 1.866 0.01 10 927 7.94 1.88 10.2 4.23 63 416 18 800 1500 80 1022.9 72 77.52 430.62 0 10 16.911 1.6 18.511 1.863 0.01 11 1111 7.96 1.87 10.12 2.98 63 409 18 1000 1500 80 1022.9 72 76.14 422.95 0 10 16.333 1.6 17.933 1.821 0.01 11 1321 8.14 1.83 9.88 2.43 64 403 18 1200 1500 80 1023 72 75.68 420.35 0 10 15.938 1.6 17.538 1.802 0.01 13 1450 8.22 1.8 9.7 1.97 64 403 18
<Experimental conditions for soybean oil>