© 2016 The Korean Ophthalmological Society
This is an Open Access article distributed under the terms of the Creative Commons Attribution Non-Commercial License (http://creativecommons.org/licenses /by-nc/3.0/) which permits unrestricted non-commercial use, distribution, and reproduction in any medium, provided the original work is properly cited.
Original Article
Changes in Corneal Endothelial Cell after Ahmed Glaucoma Valve Implantation and Trabeculectomy: 1-Year Follow-up
Min Su Kim, Kyoung Nam Kim, Chang-sik Kim
Department of Ophthalmology, Chungnam National University Hospital, Chungnam National University School of Medicine, Daejeon, Korea
Purpose: To compare changes in corneal endothelial cell density (CECD) after Ahmed glaucoma valve (AGV) implantation and trabeculectomy.
Methods: Changes in corneal endothelium in patients that underwent AGV implantation or trabeculectomy were prospectively evaluated. Corneal specular microscopy was performed at the central cornea using a non-con- tact specular microscope before surgery and 6 months and 12 months after surgery. The CECD, hexagonal- ity of the endothelial cells, and the coefficient of variation of the cell areas were compared between the two groups.
Results: Forty eyes of 40 patients with AGV implantation and 28 eyes of 28 patients with trabeculectomy were studied. Intraocular pressure in the AGV implantation group was significantly higher than that in the trabe- culectomy group (p < 0.001), but there was no significant difference in other clinical variables between the two groups. In the AGV implantation group, the mean CECD significantly decreased by 9.4% at 6 months and 12.3% at 12 months compared with baseline values (both, p < 0.001), while it decreased by 1.9% at 6 months and 3.2% at 12 months in the trabeculectomy group (p = 0.027 and p = 0.015, respectively). The changes at 6 months and 12 months in the AGV implantation group were significantly higher than those in the trabeculec- tomy group (p = 0.030 and p = 0.027, respectively). In the AGV implantation group, there was a significant decrease in the CECD between baseline and 6 months and between 6 months and 12 months (p < 0.001 and p = 0.005, respectively). However, in the trabeculectomy group, a significant decrease was observed only be- tween baseline and 6 months (p = 0.027).
Conclusions: Both the AGV implantation group and the trabeculectomy group showed statistically significant decreases in the CECD 1 year after surgery. The decrease in CECD in the AVG implantation group was great- er and persisted longer than that in the trabeculectomy group.
Key Words: Corneal endothelial cell loss, Glaucoma drainage implants, Trabeculectomy
Received: March 22, 2016 Accepted: April 20, 2016
Corresponding Author: Chang-sik Kim, MD. Department of Ophthalmology, Chungnam National University Hospital, #282 Munhwa-ro, Jung-gu,
Daejeon 35015, Korea. Tel: 82-42-280-7606, Fax: 82-42-255-3745, E-mail: [email protected]
The corneal endothelium is the innermost layer of the cornea, where the hexagonal corneal endothelial cells are distributed in a single layer, and it is important for main- taining transparency. The corneal endothelial cell density (CECD) in healthy young adults is approximately 3,000 to 3,500 cells/mm
2and its mean value is reduced by 0.5 ± 0.6% every year due to aging. Furthermore, variations in shape (pleomorphism) and size (polymegathism) of corne- al endothelial cells increase with age [1-5].
The most common surgeries for glaucoma are trabeculec- tomy and glaucoma drainage device implantation. Previous studies have reported that trabeculectomy and glaucoma drainage device implantation, in addition to other intraocu- lar surgeries or laser treatment, can damage corneal endo- thelial cells [6-14]. Various changes have been reported in CECD after glaucoma surgery. Storr-Paulsen et al. [7] re- ported that, after trabeculectomy, there were 9.5% and 10.0% decreases in the number of corneal endothelial cells after 3 months and 12 months, respectively, whereas Pastor et al. [13] reported 11.4% decrease in CECD 3 months after trabeculectomy. Shin et al. [14] reported that the post-trabe- culectomy CECD was reduced by 7.7% after 3 months when viscoelastic substances were not used in the anterior chamber, whereas the CECD was reduced by 2.5% when viscoelastic substances were used in the anterior chamber.
Of the studies, we could find by PubMed search on CECD change after glaucoma drainage device implantation, in- cluding three of our own [10-12,15-17], five studies were conducted with Ahmed glaucoma valve (AGV) implanta- tion. Lee et al. [11] reported that the endothelial cell density of the central cornea was reduced by 8.6%, 12.6 %, and 15.4% at 6, 12, and 24 months after AGV implantation, re- spectively, and Kim et al. [12] reported that the endothelial cell density of the central cornea was reduced by 10.7% at 12 months after AGV implantation.
Postoperative CECD is reduced after AGV implantation and trabeculectomy. To our knowledge, however, there has been only one report that directly compared the effects of these two surgical procedures on CECD [18]. In addition, only short-term results at 3 months after AGV implanta- tion and trabeculectomy were reported in that study.
Therefore, in this study, we studied the long-term results of up to 1 year after surgery in order to compare continu- ous changes in CECD between AGV implantation and tra- beculectomy.
Materials and Methods
This was a prospective study that was approved by the institutional review board of Chungnam National Univer- sity Hospital. Informed consent was obtained from all pa- tients. The study involved glaucoma patients who under- went AGV implantation or trabeculectomy at the Department of Ophthalmology, Chungnam National Uni- versity Hospital from 2003 to 2005. We collected the spec- ular microscopy data before and after surgery and com- pared the change in corneal endothelium between AGV implantation and trabeculectomy. If both eyes of a patient were treated, one was randomly selected and enrolled in the study. Age, sex, presence/absence of diabetes or hyper- tension, history of intraocular surgery or laser treatment, preoperative intraocular pressure (IOP), the number of IOP-lowering medications (a fixed combination agent was counted as two medications), and the diagnosis were re- corded for all patients. We excluded patients with congeni- tal glaucoma, preoperative corneal decompensation, cor- neal endothelial cell disease (including Fuchs’ dystrophy, posterior polymorphous dystrophy, and iridocorneal endo- thelial syndrome), previous penetrating keratoplasty, and any other corneal epithelial or stromal disorders that could influence the quality of the specular microscopy. To study the natural course after uncomplicated surgery, patients with apparent tube-corneal contact were excluded. Cases that required additional surgery or laser treatment because the IOP increased after surgery or cases that required other intraocular surgery such as cataract surgery were includ- ed, and the data collected up to the second surgery were used in the analyses. Patients that were unable to complete the 1-year follow-up without specific reason were also ex- cluded.
All surgeries were conducted by a single surgeon (CSK), after retrobulbar anesthesia. AGV implantation was per- formed on the superotemporal side of every eye. A traction suture through the clear cornea was used at the upper pe- ripheral cornea to enhance exposure of the surgical field.
A 10-mm incision was made in the conjunctiva and Ten-
on’s capsule, circumferentially at 5 mm posterior from the
corneal limbus, followed by a dissection between the Ten-
on's capsule and the sclera. The body of the AGV (model
S2 with a surface area of 184 mm
2; New World Medical,
Rancho Cucamonga, CA, USA) was inserted under the
Tenon's capsule between the superior rectus muscle and
lateral rectus muscle. The body of the AGV was fixed to the sclera by two 9/0 nylon anchoring sutures at the front edge of the plate on both sides, 8 to 9 mm from the corneal limbus. An anterior chamber puncture, parallel with the iris surface, was made 1 mm posterior to the corneal lim- bus, using a 23-gauge needle. A silicone tube was then cut, and a length of approximately 2 mm was inserted into the anterior chamber, in a bevel-up position. The silicone tube was fixed to the sclera by two anchoring sutures. The sili- con tube near the corneal limbus was covered using a 4 × 3-mm full-thickness donor sclera. The surgery was com- pleted with continuous running sutures of the Tenon's cap- sule and the conjunctiva.
Trabeculectomy was performed on the superotemporal or superonasal area, and a traction suture was performed on the upper peripheral cornea. A limbus-based conjunctival incision was performed in parallel to the corneal limbus at 8 mm posterior to the limbus, followed by a dissection be- tween the Tenon's capsule and the sclera. Mitomycin C at a concentration of 0.3 mg/mL was applied to the subconjunc- tival space for 1 to 4 minutes and then thoroughly rinsed with balanced salt solution. Time was subjectively adjusted by the surgeon, based on the age of the patient and thick- ness and vascularity of the conjunctiva and Tenon’s capsule.
A 3.5 × 3-mm trapezoidal half-thickness scleral flap was made, and mitomycin C at the same concentration was ap- plied again under the scleral flap for 1 to 2 minutes, and then washed out. The total mitomycin C application time did not exceed 5 minutes. The IOP was gradually lowered by an anterior chamber puncture and drainage of the aque- ous humor, followed by injection of 0.05 mL of a viscoelas- tic substance (Healon; Pharmacia, Peapack, NJ, USA) into the anterior chamber. A 2.5 × 1-mm corneoscleral block was excised, and a peripheral iridectomy were performed. The viscoelastic substance was removed from the anterior cham- ber by injecting balanced salt solution through the premade paracentesis. The scleral flap was sutured to the scleral bed using 2 to 4 10/0 nylon sutures, the tightness was adjusted based on the degree of aqueous outflow filtration, and the conjunctiva and Tenon's capsule were closed with a continu- ous 10/0 nylon suture.
In all patients that underwent surgery, 1% Isopto atropine eye drops (Ocutropine; Samil, Seoul, Korea) were used for 2 days after the surgery, and 0.3% ofloxacin eye drops (Ocu- flox, Samil) and 0.12% prednisolone acetate eye drops (Ocu- Pred, Samil) were used four times a day for 2 weeks and ta-
pered over 6 months.
Specular microscopic examination of corneal endothelial cells was performed by an experienced examiner using a non-contact specular microscope (Robo SP-8000; Konan Medical, Nishinomiya, Japan) immediately before surgery and at 6 months and 12 months after surgery. This instru- ment automatically captures images of the endothelium once the subject fixates on a target. Then, the CECD (cells/
mm
2), the percentage of hexagonal cells (an index of pleo- morphism), and the coefficient of variation in the cell area (%, standard deviation divided by mean cell area, an index of polymegathism) were determined semiautomatically; at least 50 contiguous endothelial cells centered on the screen were hand-marked, and a computer algorithm was used to calculate the values. We analyzed the results on the central area of the cornea.
Statistics
PASW ver. 18.0 (SPSS Inc., Chicago, IL, USA) was used
for statistical analysis of all data. The Mann-Whitney
U-test was used to compare age, history of intraocular sur-
gery or laser treatment, preoperative and postoperative
IOP at 6 months and 12 months after surgery, the number
of glaucoma medications, the CECD, the percentage of
hexagonal cells, and the coefficients of variation of cell ar-
eas between the AGV implantation and trabeculectomy
groups. The chi-square test was used to evaluate differenc-
es in sex, diabetes, and hypertension between the two
groups. The Wilcoxon’s signed-rank test was used to com-
pare changes in the CECD, percentage of hexagonal cells,
and the coefficient of variation of cell areas before and af-
ter surgery. The Kaplan-Meier survival curve and the log-
rank tests were used for survival analyses to assess pa-
tients whose postoperative corneal endothelial cells were
reduced by 10% or less compared to preoperative levels. A
univariate linear regression analysis was performed to
identify variables associated with large amounts of CECD
reduction. The Pearson’s correlation coefficient was calcu-
lated to compare preoperative and postoperative CECD at
12 months in each group. A p-value less than 0.05 was
considered statistically significant.
Results
Forty eyes of 40 patients, with a mean age of 55.3 ± 11.6 years, underwent AGV implantation. There were 29 males and 11 females in the group. The preoperative IOP was 38.1 ± 12.9 mmHg, and the preoperative number of glauco- ma medications was 3.6 ± 0.7. Among the 40 eyes that re- ceived AGV implantation, 22 (55.0%) were diagnosed with neovascular glaucoma, 14 (35.0%) were diagnosed with secondary glaucoma, 3 (7.5%) were diagnosed with prima- ry open-angle glaucoma, and 1 (2.5%) was diagnosed with
primary angle-closure glaucoma.
Twenty-eight eyes of 28 patients, with a mean age of 58.7 ± 11.0 years, underwent trabeculectomy. There were 22 males and six females in the group. The preoperative IOP was 24.7 ± 7.3 mmHg, and the preoperative number of glaucoma medications was 3.9 ± 0.3. Among the 28 eyes, 20 (71.4%) were diagnosed with primary open-angle glau- coma, 6 (21.4%) were diagnosed with primary angle-clo- sure glaucoma, 1 (3.6%) was diagnosed with neovascular glaucoma, and 1 (3.6%) was diagnosed with secondary glaucoma. IOP before surgery was greater in the AGV im-
Table 1. Demographics of patients with Ahmed glaucoma valve implantation or trabeculectomy Ahmed glaucoma valve
implantation Trabeculectomy p-value
No. of patients (no. of eyes) 40 (40) 28 (28)
Age at surgery (yr) 55.3 ± 11.6 58.7 ± 11.0 0.161
*Sex (male / female) 29 / 11 22 / 6 0.569
†Diabetes mellitus 14 14 0.216
†Hypertension 14 15 0.247
†No. of previous ocular interventions 0.7 ± 0.8 0.6 ± 0.7 0.122
*Cataract surgery 16 9
Trabeculectomy 2 1
Pars plana vitrectomy 5 0
Others
‡2 6
Intraocular pressure (mmHg)
Baseline 38.1 ± 12.9 24.7 ± 7.3 <0.001
*Postoperative 6 mon 19.5 ± 6.3 17.0 ± 2.9 0.108
*Postoperative 12 mon 19.0 ± 7.8 16.3 ± 4.8 0.117
*No. of glaucoma medications
Baseline 3.6 ± 0.7 3.9 ± 0.3 0.085
*Postoperative 6 mon 1.6 ± 1.0 0.8 ± 1.1 <0.001
*Postoperative 12 mon 1.9 ± 1.1 1.1 ± 1.2 0.004
*Diagnosis, no. of eyes
Neovascular glaucoma 22 (55) 1 (3.6) <0.001
§Secondary glaucoma 14 (35) 1 (3.6) 0.002
§Primary open-angle glaucoma 3 (7.5) 20 (71.4) <0.001
§Primary angle-closure glaucoma 1 (2.5) 6 (21.4) 0.011
§Corneal specular microscopy
Endothelial cell density (cells/mm
2) 2,502.2 ± 436.3 2,381.0 ± 450.0 0.217
*Hexagonality (%) 55.6 ± 9.3 56.2 ± 11.6 0.349
*Coefficient of variation of cell area (%) 41.8 ± 54.1 33.4 ± 6.2 0.827
*Values are presented as mean ± standard deviation or number (%).
*
Mann-Whitney U-test;
†Chi-square test;
‡Peripheral laser iridotomy;
§Fisher’s exact test.
plantation group than in the trabeculectomy group (p <
0.001, Mann-Whitney U-test), but the number of glaucoma medications was not different in the two groups ( p = 0.085). The preoperative mean CECD in the AGV group and the trabeculectomy group was 2,502.2 ± 436.3 and 2,381.0 ± 450.0 cells/mm
2, respectively, with no significant difference (p = 0.217). No significant differences were
found in either hexagonality or the coefficient of variation of the cells (p = 0.349 and p = 0.827). Other parameters of age, sex, accompanied systemic diseases, and number of previous ocular surgeries were not significantly different between the two groups. The IOPs at 6 months and 12 months after the surgery were not significantly different between the groups (all, p > 0.1), but the number of glauco-
Table 2. Change in corneal endothelial cell density in the Ahmed glaucoma valve implantation and trabeculectomy groups Follow-up period Ahmed glaucoma valve
implantation p-value
*Trabeculectomy p-value
*Baseline 2,502.2 ± 436.3 - 2,381.0 ± 450.0 -
Postoperative 6 mon 2,284.7 ± 549.2 <0.001 2,332.5 ± 427.8 0.027
Postoperative 12 mon 2,212.0 ± 575.9 <0.001 2,311.6 ± 483.0 0.015
Values are presented as mean ± standard deviation.
*
Compared to baseline (Wilcoxon signed-rank test).
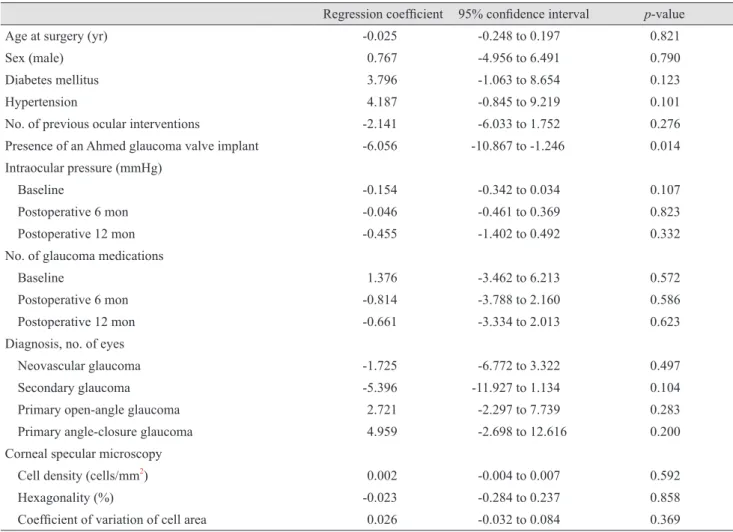
Table 3. Univariate linear regression analyses of clinical variables associated with corneal endothelial cell loss
Regression coefficient 95% confidence interval p-value
Age at surgery (yr) -0.025 -0.248 to 0.197 0.821
Sex (male) 0.767 -4.956 to 6.491 0.790
Diabetes mellitus 3.796 -1.063 to 8.654 0.123
Hypertension 4.187 -0.845 to 9.219 0.101
No. of previous ocular interventions -2.141 -6.033 to 1.752 0.276
Presence of an Ahmed glaucoma valve implant -6.056 -10.867 to -1.246 0.014
Intraocular pressure (mmHg)
Baseline -0.154 -0.342 to 0.034 0.107
Postoperative 6 mon -0.046 -0.461 to 0.369 0.823
Postoperative 12 mon -0.455 -1.402 to 0.492 0.332
No. of glaucoma medications
Baseline 1.376 -3.462 to 6.213 0.572
Postoperative 6 mon -0.814 -3.788 to 2.160 0.586
Postoperative 12 mon -0.661 -3.334 to 2.013 0.623
Diagnosis, no. of eyes
Neovascular glaucoma -1.725 -6.772 to 3.322 0.497
Secondary glaucoma -5.396 -11.927 to 1.134 0.104
Primary open-angle glaucoma 2.721 -2.297 to 7.739 0.283
Primary angle-closure glaucoma 4.959 -2.698 to 12.616 0.200
Corneal specular microscopy
Cell density (cells/mm
2) 0.002 -0.004 to 0.007 0.592
Hexagonality (%) -0.023 -0.284 to 0.237 0.858
Coefficient of variation of cell area 0.026 -0.032 to 0.084 0.369
ma medications after surgery was smaller in the trabe- culectomy group than in the AGV group at 6 and 12 months after surgery (p < 0.001 and p = 0.004, respective- ly) (Table 1).
In the AGV implantation group, the CECD was 2,502.2
± 436.3 cells/mm
2before surgery and decreased signifi- cantly to 2,284.7 ± 549.2 cells/mm
2at 6 months after sur- gery ( p < 0.001) and 2,212.0 ± 575.9 cells/mm
2at 12 months after surgery, (p < 0.001) compared to baseline; the amount of change between 6 and 12 months after surgery was significantly different (p = 0.005). In the trabeculecto- my group, the CECD was 2,381.0 ± 450.0 cells/mm
2before surgery and decreased significantly to 2,332.5 ± 427.8 cells/
mm
2at 6 months after surgery (p < 0.027) and 2,311.6 ± 483.0 cells/mm
2at 12 months after surgery (p = 0.015) compared to the baseline; there was no significant differ- ence in the CECD between 6 months and 12 months after surgery (p = 0.322) (Table 2). When the percentage of change in CECD from the baseline value was compared, the AGV implantation group showed 9.4% and 12.3% de- creases in CECD at 6 months and 12 months after surgery;
these changes were significantly greater than 1.9% and 3.2% in the trabeculectomy group (p = 0.030 and p = 0.027, respectively, Mann-Whitney U-test) (Fig. 1).
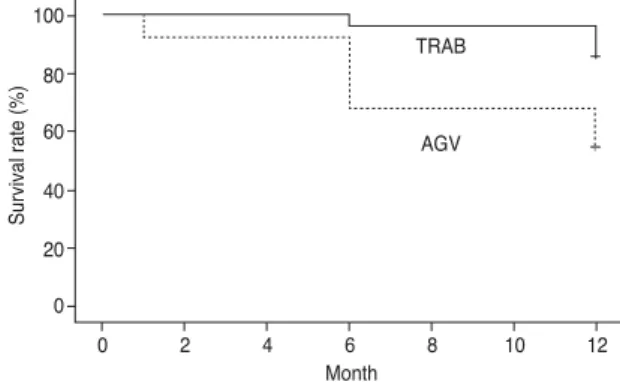
The cumulative Kaplan-Meier survival analysis of the 10% loss of CECD from baseline was 66.9% in the AGV implantation group and 96.4% in the trabeculectomy group at 6 months after surgery. At 12 months after surgery, the
survival rate in the AGV implantation group was 54.0%, while that in the trabeculectomy group was 85.6% (p = 0.005, log-rank test) (Fig. 2). A scatter plot showing the differences between preoperative and postoperative CECD at 12 months in each group indicates that the AVG implan- tation group (Fig. 3A) showed wider variation in postoper- ative CECD compared to the trabeculectomy group (Fig.
3B) (Pearson’s correlation coefficient, r = 0.777 and 0.948, respectively; p = 0.002, Fisher’s Z transformation).
We aimed to identify factors that were associated with large amounts of reduction in CECD. Based on the regres- sion analysis, the presence of AGV implant was the only variable relevant to the rate of the CECD loss (regression coefficient = -6.056, p = 0.014). Age, sex, diabetes, hyper- tension, previous intraocular surgery or laser treatment time, preoperative IOP, the number of glaucoma medica- tions for IOP, clinical diagnosis, CECD, percentage of hex- agonal cells, and the coefficient of variation of the cell ar- eas were not significantly associated (all p > 0.05) (Table 3).
Discussion
The corneal endothelium is an essential structure for main- taining the transparency of the cornea [4,5]. Reports have in- dicated that the CECD can be reduced due to surgery, trau- ma, and aging. When the CECD is reduced below a
Fig. 1. Postoperative percentage change following Ahmed glaucoma valve implantation or trabeculectomy. At 6 months, this change was 90.6% in the Ahmed glaucoma valve implan- tation group and 98.1% in the trabeculectomy group (p = 0.030, Mann-Whitney U-test). At 12 months, this change was 87.7% in the Ahmed glaucoma valve implantation group and 96.8% in the trabeculectomy group (p = 0.027). Preop = preoperative.
*