INTRODUCTION
Autoantibodies to extractable nuclear antigens (ENAs) are im- portant diagnostic markers for autoimmune diseases, such as systemic lupus erythematosus (SLE), Sjögren’s syndrome (SjS), and systemic sclerosis (SSc).1-3 These anti-ENAs exhibit strong clinical associations with several systemic autoimmune rheu- matoid diseases (SARDs). Anti-Sm is considered to be a highly
specific marker for SLE, anti-Scl-70 for SSc, and anti-RNP for SLE, SSc, and mixed connective tissue disease (MCTD).4,5 There- fore, accurate detection of anti-ENAs plays a key role in the dif- ferential diagnosis of SARDs.
Several methods are available for the detection of anti-ENAs;
however, no gold standard has been established due to the fol- lowing reasons: 1) variations in substrates and fixatives, 2) dif- ferences in methods and quantitation of results, and 3) difficul- ty of establishing reference ranges.6 Over the years, gel-based immunoprecipitation techniques and ELISA have been wide- ly used for the detection of anti-ENAs.7,8 ELISA assays are highly sensitive in measurements of the levels of antigens or antibod- ies in various clinical samples, and it is one of the most com- monly used diagnostic test in clinical and research laborato- ries.9-11 Despite the advantages of ELISA assay, it is limited by laborious and long protocols. Several new methods with ac- curate results and simplified laboratory procedures have been evaluated in various institutions to substitute conventional test- ing methods for the detection of anti-ENAs.12,13
Detection of Anti-Extractable Nuclear Antigens in Patients with Systemic Rheumatic Disease via Fluorescence Enzyme Immunoassay
and Its Clinical Utility
Joowon Oh, Younhee Park, Kyung-A Lee, and Hyon-Suk Kim
Department of Laboratory Medicine, Yonsei University College of Medicine, Seoul, Korea.
Purpose: Testing for autoantibodies to extractable nuclear antigens (ENAs) plays an important role in the diagnosis and manage- ment of systemic rheumatic disease. Currently, no gold standard tests are available for detecting anti-ENAs. To address this gap, we aimed to identify an assay that exhibits satisfactory diagnostic performance in the detection of five common anti-ENAs by com- paring two commonly used assays, an automated fluorescent enzyme immunoassay (FEIA) and a microplate ELISA assay.
Materials and Methods: Sera from 100 patients with systemic rheumatic disease were collected and assayed with FEIA and mi- croplate ELISA to detect anti-ENAs. Statistical analyses were performed to check the agreement rate between the two platforms using kappa coefficients. Analytical sensitivity and specificity for each assay were calculated.
Results: The concordance rates between ELISA and FEIA ranged from 89% for anti-RNP to 97% for anti-Scl-70, and the kappa coef- ficients of the two assays were in the range of 0.44 to 0.82. Between the two assays, a significant difference in sensitivity and speci- ficity was seen only for anti-Sm and anti-RNP, respectively.
Conclusion: In this study, FEIA and ELISA showed comparable efficiency for detecting anti-ENAs.
Key Words: Anti-ENA antibody, rheumatoid arthritis, systemic lupus erythematosus, enzyme-linked immunosorbent assay pISSN: 0513-5796 · eISSN: 1976-2437
Received: September 27, 2019 Revised: November 1, 2019 Accepted: November 4, 2019
Corresponding author: Hyon-Suk Kim, MD, PhD, Department of Laboratory Medicine, Yonsei University College of Medicine, 50-1 Yonsei-ro, Seodaemun-gu, Seoul 03722, Korea.
Tel: 82-2-2228-6111, Fax: 82-2-364-1583, E-mail: [email protected]
•The authors have no potential conflicts of interest to disclose.
© Copyright: Yonsei University College of Medicine 2020
This is an Open Access article distributed under the terms of the Creative Com- mons Attribution Non-Commercial License (https://creativecommons.org/licenses/
by-nc/4.0) which permits unrestricted non-commercial use, distribution, and repro- duction in any medium, provided the original work is properly cited.
Yonsei Med J 2020 Jan;61(1):73-78 https://doi.org/10.3349/ymj.2020.61.1.73
Herein, we studied the overall performance of the automat- ed fluorescent enzyme immunoassay (FEIA) technique for the detection of anti-ENAs and diagnosis of SARDs and compared the results with those of microplate ELISA.
MATERIALS AND METHODS
Serum samples
In this study, we collected non-duplicated and non-selected sera from 100 patients who underwent anti-ENA testing at one university hospital from December 2011 to January 2012. The appropriate sample size with which to evaluate the performance of the diagnostic tools was determined based on a previous re- port.14 Of the 100 patients, 60 patients were diagnosed with well- defined SARDs [25 SLE, 24 SjS, 5 rheumatoid arthritis (RA), 4 MCTD, and 2 SSc]; 17 were diagnosed with non-SARD autoim- mune disease, such as Raynaud disease, autoimmune carpal tunnel syndrome, or autoimmune disease with no criteria met for an exact diagnosis; 22 suffered from non-autoimmune dis- eases, such as osteoarthritis, allergic rhinitis, and hypertensive heart disease; and 1 patient’s diagnosis was not available. The diagnosis of each patient with autoimmune disease was deter- mined by expert rheumatologists. We received ethical approval of this study from the Institutional Review Board of Severance Hospital (IRB No. 1-2019-0013).
Autoantibody profiling methods
We detected the most commonly measured ENA specificities, such as anti-SS-A/Ro, anti-SS-B/La, anti-RNP, anti-Sm, and an- ti-Scl-70. Table 1 lists the nature of the antigens in the two tests that were evaluated.
Microplate ELISA
Microplate ELISA for detecting five different anti-ENAs were conducted using QUANTA LiteTM ELISA kits (INOVA Diagnostics, San Diego, CA, USA). Laboratory procedures were performed by expert technicians according to the manufacturer’s instruc- tions, and manual sample preparation and manual distribution on the microplate initiated the wet process. After the procedure, the optical density (OD) of each reaction was measured by an ELISA reader, and the levels of autoantibodies were calculated using the values of OD from the patients’ sera and positive con- trols. According to the manufacturer’s instructions, the results
were reported in three categories: negative, weak positive, and positive. Semi-quantitative results of less than 20 units were classified as negative, 20–39 units as weak positive, and more than 40 units as positive. For statistical analyses, weak-positive results were considered positive results.
Automated FEIA
As previously described in the literature, the Phadia® 250 as- say (Phadia, Uppsala, Sweden) utilizes polystyrene EliATM wells precoated with targeted antigens (SS-A/Ro protein, SS-B/La protein, RNP protein, SmD3 peptide, and Scl-70 protein, respec- tively).15 The fluorescence emitted from the conjugate of the autoantibody was detected by a built-in fluorometer, and the es- timated value was expressed in EliA U/mL. The results were clas- sified in three categories: negative, equivocal, and positive. Ac- cording to the cutoff values provided by the manufacturer, results less than 7 EliA U/mL were classified as negative, 7–10 EliA U/
mL as equivocal, and more than 10 EliA U/mL as positive. For statistical analyses, equivocal results were considered positive results.
Statistical analyses
The statistical tests in this study were conducted using Anal- yse-it® 3.90.4 (Analyse-it Software, Ltd., Leeds, UK) and R 3.5.3 (R Foundation for Statistical Computing, Vienna, Austria). Agree- ment between qualitative results from the two assays was as- sessed using kappa coefficients. Recommended interpretations of kappa values were as follows: poor agreement, 0.01–0.20; fair agreement, 0.21–0.40; moderate agreement, 0.41–0.60; substan- tial agreement, 0.61–0.80; and almost perfect agreement, 0.81–
0.99.16 Degrees of association between quantitative values from the two tests were assessed using Spearman’s correlation co- efficients. A p value less than 0.05 was considered statistically significant. Sensitivity and specificity for each test were deter- mined with two-by-two contingency tables. To define true posi- tive, true negative, false positive, and false negative, a true event was defined as diagnosis of the patient with correlated disease.
The sensitivities and specificities for the two methods were com- pared by estimation of confidence intervals for differences in paired sensitivities and paired specificities.17,18 If the confidence limits for the differences in sensitivities or specificities did not include zero, there was evidence that the sensitivities or speci- ficities were statistically different.18 As the clinical data of one patient was not available, analyses of diagnostic sensitivities Table 1. The Composition of Antigens in INOVA and Phadia® 250
Antigens INOVA Phadia® 250
SS-A/Ro Purified SS-A antigen (60 kDa and 52 kDa) Recombinant SS-A/Ro (60 kDa, 52 kDa) protein
SS-B/La Purified SS-B antigen Recombinant SS-B/La protein
RNP Purified RNP/Sm antigen complex Recombinant RNP (RNP70, A, C) protein
Sm Purified Sm antigen (BB, D1, D3, etc.)* Recombinant SmD3 peptide
Scl-70 Purified Scl-70 antigen Recombinant Scl-70 protein
*Targets all Sm autoantigen complexes, which consist of more than nine polypeptides
and specificities were conducted with results from 99 patients.
RESULTS
Patients
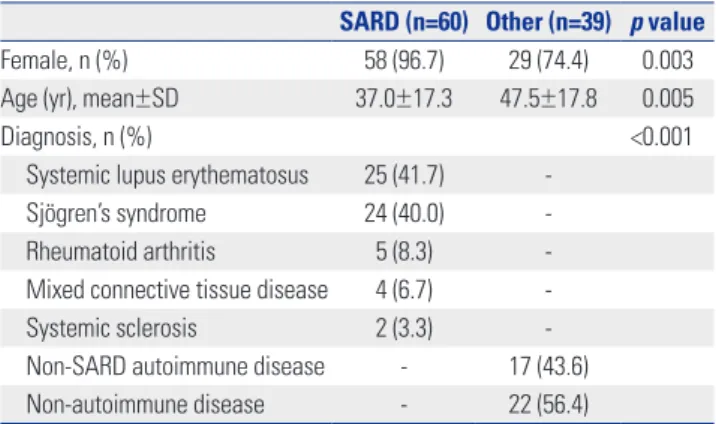
The demographic data for the 99 patients are detailed in Table 2.
Fifty-eight SARD patients were female (58/60, 96.7%), and 29 non-SARD patients were female (29/39, 74.4%). The average age of the SARD patients was 37.0 years, with a standard deviation (SD) of 17.3, and in non-SARD patients, the average age was 47.5 years, with a SD of 17.8. Sixty SARD patients comprised five different clinical diagnoses: SLE (n=25), SjS (n=24), RA (n=5), MCTD (n=4), and SSc (n=2). Non-SARD patients were subdi- vided into a non-SARD autoimmune disease group (n=17) or non-autoimmune disease group (n=22).
Agreement between Phadia® 250 and microplate ELISA Overall agreement values between Phadia® 250 and ELISA as- say are listed in Table 3. Based on values of concordant and dis- crepant results, the agreement rates between ELISA and Phad- ia® 250 ranged from 89% for anti-RNP to 97% for anti-Scl-70.
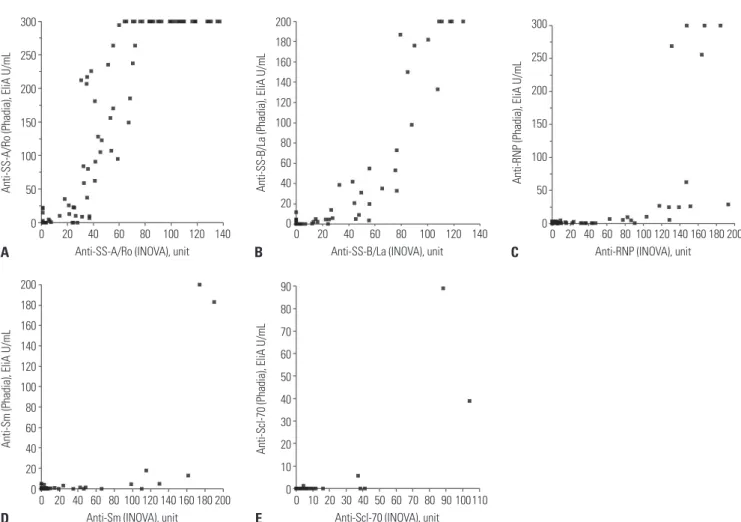
The estimated kappa coefficients for agreement between the results by the two assays had a minimum value of 0.44 for an- ti-Sm and a maximum value of 0.82 for anti-SS-B/La. In detec- tion of anti-Scl-70 and anti-Sm, the two methods showed mod- erate agreement with kappa coefficients of 0.56 and 0.44, respectively. For anti-SS-A/Ro and anti-RNP, the two methods demonstrated substantial agreement. Correlation of signal to cut-off ratios was analyzed with Spearman’s rank correlation co- efficients to document the degree of association between the two tests (Fig. 1). Spearman’s coefficients between the results by the two methods were 0.93 for anti-SS-A/Ro, 0.72 for anti-SS-B/
La, 0.43 for anti-RNP, 0.33 for anti-Sm, and 0.33 for anti-Scl-70.
Diagnostic performance of the two assays
The sensitivities and specificities of ELISA and Phadia® 250 in the detection of each anti-ENA antibody are shown in Table 4.
As stated in the Materials and Methods section and Table 4, a true event in the evaluation of the diagnostic sensitivity and specificity of anti-SS-A/Ro was a diagnosis with SLE or SjS (to- tal n=49). The rest of the diagnostic accuracy criteria for each autoantibody are detailed in the Table 4. According to the Clini- cal and Laboratory Standards Institute guideline EP12-A, we used 95% confidence intervals to determine statistically dif- ferent differences.18 In general, in the provided clinical context in Table 4, more false positive cases were observed with the ELI- SA assay. Phadia® 250 showed higher sensitivity and specifici- ty for the detection of anti-SS-A/Ro and anti Scl-70, although the difference was not statistically significant. Overall, there were no significant differences between the two assays, except for the specificity of anti-RNP and sensitivity of anti-Sm.
DISCUSSION
In this study, we attempted to compare the overall performance of two laboratory platforms for the detection of anti-ENAs. Au- tomated Phadia® 250 for the detection of anti-ENAs showed comparable performance with conventional microplate ELISA in that the two methods showed overall good analytical agree- Table 2. Demographic Data of the 99 Patients
SARD (n=60) Other (n=39) p value
Female, n (%) 58 (96.7) 29 (74.4) 0.003
Age (yr), mean±SD 37.0±17.3 47.5±17.8 0.005
Diagnosis, n (%) <0.001
Systemic lupus erythematosus 25 (41.7) -
Sjögren’s syndrome 24 (40.0) -
Rheumatoid arthritis 5 (8.3) -
Mixed connective tissue disease 4 (6.7) -
Systemic sclerosis 2 (3.3) -
Non-SARD autoimmune disease - 17 (43.6)
Non-autoimmune disease - 22 (56.4)
SARD, systemic autoimmune rheumatoid disease.
p value was calculated from Fisher’s exact test, comparison of values be- tween SARD patients and other patients. p value lower than 0.05 was con- sidered significant.
Table 3. Comparison of the Results for Antibodies to Extractable Nuclear Antigens in INOVA and Phadia® 250 for a Total of 100 Serum Samples Autoantibody
Concordant results Discrepant results*
Agreement rate (%) Kappa coefficient
(95% CI) Spearman’s coefficient† (95% CI) Positive/
positive Negative/
negative Positive/
negative Negative/
positive
Anti-SS-A/Ro 65 26 4 5 91 0.79 (0.66–0.92) 0.93 (0.90–0.96)
Anti-SS-B/La 23 70 6 1 93 0.82 (0.69–0.95) 0.72 (0.61–0.81)
Anti-RNP 16 73 11 0 89 0.68 (0.51–0.85) 0.43 (0.25–0.58)
Anti-Sm 4 87 9 0 91 0.44 (0.15–0.73) 0.33 (0.14–0.50)
Anti-Scl-70 2 95 3 0 97 0.56 (0.12–1.00) 0.33 (0.13–0.50)
CI, confidence interval.
*Shown as “no. of respective results by ELISA/Phadia® 250.” Weak positive samples (20–39 units) by ELISA and equivocal samples (7–10 EliA U/mL) by Phadia® 250 were included as positive results, †Spearman’s rank correlation analysis was performed with signal to cut-off ratio values of the results by ELISA and Phad- ia® 250, p values were <0.0001 for all autoantibodies.
ment and that the diagnostic performance showed no statisti- cally significant differences, except for anti-RNP and anti-Sm.
Although there are no evaluation reports comparing the exact same methods of FEIA and ELISA in detecting anti-ENAs, our results are in line with a recent study comparing FEIA methods with enzyme immunoassays (EIA) and with a study comparing multiplexed flow immunoassay with conventional ELISA as- say.12,13 In the previous study comparing EIA-based assay with FEIA, the two showed good agreement (kappa coefficient=0.70), and regarding clinical implications, the two showed compara- ble results.12 In a study comparing FEIA with conventional in- direct immunofluorescence assay, the percent agreement be- tween the two assays was 79.2%, and FEIA showed higher sensitivity.19 In this context, where newly developed methods show comparable or even better performance than convention- al immunoassays, practical consideration of the testing plat- form based on the simplicity of the procedure, turnaround time, etc. could help to decide which platform to use in the laboratory.
The clinical sensitivities of anti-Sm with Phadia® and ELISA were 0.120 and 0.400, which was a significant difference. Anti- Sm has high diagnostic specificity in SLE patients, and clinical sensitivity has less correlation with establishing the diagnosis.5 Even so, clinical correlation with diagnostic symptoms in pa-
tients prevents misdiagnosis with false negative results. The discrepant results in detecting anti-RNP (Table 3) could raise a question of misdiagnosis when using Phadia® 250. Out of 11 discordant cases in the detection of anti-RNP, the diagnoses and semi-quantitative antibody titers, described as positive or weak positive, varied among the cases: SLE (weak positive, n=2;
positive, n=2), SjS (weak positive, n=2; positive, n=2), MCTD (weak positive, n=1), and non-systemic autoimmune disease (weak positive, n=1; positive, n=1). As anti-RNP is a diagnostic marker for SLE and SSc and since a high level of anti-RNP is diagnostic of MCTD, this result could suggest the possibility of false positive cases according to clinical diagnoses, leading to misdiagnosis using the ELISA method.5 The problem of false- positive anti-ENA tests has been continuously raised, and it is recommended that testing be performed with two different methods to avoid false-positive results.20,21 Clinical correlation with anti-ENA results can be another solution for avoiding false- positive results.
Our study is limited by the small number of patients with SARD and by the absence of normal healthy controls. Also, due to the high number of negative results for anti-Sm and anti-Scl-70 (Ta- ble 3), we cannot accurately determine the degree of associa- tion between the two methods in detecting these two antibod- 300
250 200 150 100 50
00 20 40 60 140
Anti-SS-A/Ro (INOVA), unit 80 100 120
Anti-SS-A/Ro (Phadia), EliA U/mL
A
200 180 160 140 120 100 80 60 40 20
00 20 40 60 140 160 180200 Anti-Sm (INOVA), unit
80 100 120
Anti-Sm (Phadia), EliA U/mL
D
200 180 160 140 120 100 80 60 40 20
00 20 40 60 140
Anti-SS-B/La (INOVA), unit 80 100 120
Anti-SS-B/La (Phadia), EliA U/mL
B
90 80 70 60 50 40 30 20 10
00 10 20 3040 50 60 110 Anti-Scl-70 (INOVA), unit
80 70 90100
Anti-Scl-70 (Phadia), EliA U/mL
E
300 250 200 150 100 50
00 20 40 60 140160180200 Anti-RNP (INOVA), unit
80 100 120
Anti-RNP (Phadia), EliA U/mL
C
Fig. 1. Spearman’s correlation plots of results from INOVA and Phadia® 250 for the five anti-ENAs. (A) anti-SS-A/Ro, (B) anti-SS-B/La, (C) anti-RNP, (D) anti- Sm, and (E) anti-Scl-70. ENAs, extractable nuclear antigens.
ies. Well-designed studies with a larger pool of patients would be helpful to determining the true diagnostic performances of the two methods.
In this study, we evaluated and compared the analytical per- formances of the automated FEIA platform Phadia® 250 and microplate ELISA (INOVA Diagnostics) for the detection of the five most commonly used anti-ENAs. Phadia® 250 showed com- parable performance with conventional microplate ELISA.
Since the selection of an assay for use in a clinical laboratory depends on several factors, such as protocol time, turnaround time, and simplicity of use by laboratory technicians, as well as the accuracy of test results, we believe that Phadia® 250 could be a useful and efficient method, as it shows comparable effi- cacy and good agreement with previous methods, along with a shorter protocol time, a shorter turnaround time, and better ease of use than microplate ELISA.
AUTHOR CONTRIBUTIONS
Conceptualization: Hyon-Suk Kim. Data curation: Joowon Oh. For- mal analysis: Joowon Oh. Funding acquisition: Hyon-Suk Kim. Inves- tigation: Joowon Oh, Younhee Park. Methodology: Kyung-A Lee, Younhee Park. Project administration: Hyon-Suk Kim. Resources:
Hyon-Suk Kim, Younhee Park. Software: Joowon Oh. Supervision:
Hyon-Suk Kim, Kyung-A Lee, Younhee Park. Validation: Joowon Oh.
Visualization: Joowon Oh. Writing—original draft: Joowon Oh. Writ- ing—review & editing: Joowon Oh, Hyon-Suk Kim.
ORCID iDs
Joowon Oh https://orcid.org/0000-0002-8449-3660 Younhee Park https://orcid.org/0000-0001-8458-1495 Kyung-A Lee https://orcid.org/0000-0001-5320-6705 Hyon-Suk Kim https://orcid.org/0000-0001-5662-7740
REFERENCES
1. Egner W. The use of laboratory tests in the diagnosis of SLE. J Clin Pathol 2000;53:424-32.
2. van Venrooij WJ, Charles P, Maini RN. The consensus workshops for the detection of autoantibodies to intracellular antigens in rheumatic diseases. J Immunol Methods 1991;140:181-9.
3. Catoggio LJ, Bernstein RM, Black CM, Hughes GR, Maddison PJ.
Serological markers in progressive systemic sclerosis: clinical cor- relations. Ann Rheum Dis 1983;42:23-7.
4. Kayser C, Fritzler MJ. Autoantibodies in systemic sclerosis: unan- swered questions. Front Immunol 2015;6:167.
5. Migliorini P, Baldini C, Rocchi V, Bombardieri S. Anti-Sm and an- ti-RNP antibodies. Autoimmunity 2005;38:47-54.
6. Meroni PL, Biggioggero M, Pierangeli SS, Sheldon J, Zegers I, Borghi MO. Standardization of autoantibody testing: a paradigm for serology in rheumatic diseases. Nat Rev Rheumatol 2014;10:
35-43.
7. Albon S, Bunn C, Swana G, Karim Y. Performance of a multiplex as- say compared to enzyme and precipitation methods for anti-ENA testing in systemic lupus and systemic sclerosis. J Immunol Meth- ods 2011;365:126-31.
8. Siracusano A, Agelli M, Ioppolo S, Quintieri F, Bombardieri S. De- Table 4. Comparison of Sensitivity and Specificity of Anti-ENA in a Clinical Context with a Total of 99 Serum Samples
Autoantibody Kits True
positive True
negative False
positive False
negative Sensitivity
(95% CI) 95% CI for
Dsens (%) Specificity
(95% CI) 95% CI for Dspec (%)
Diagnostic accuracy criteria
(no. of patients) Anti-SS-A/Ro
INOVA 42 24 26 7 0.857
(0.733–0.929)
-2.5 to 27.3
0.480 (0.348–0.615)
-6.1 to 28.5 SLE, SjS (n=49)
Phadia® 250 45 26 24 4 0.918
(0.808–0.968)
0.520 (0.385–0.652) Anti-SS-B/La
INOVA 19 41 9 30 0.388
(0.264–0.528)
-15.5 to 15.2
0.820 (0.692–0.902)
-3.7 to 22.8 SLE, SjS (n=49)
Phadia® 250 16 43 7 33 0.327
(0.212–0.466)
0.860 (0.738–0.930) Anti-RNP
INOVA 14 59 13 13 0.519
(0.340–0.693)
-28.5 to 15.6
0.819 (0.715–0.891)
2.3 to 23.2* SLE, SSc (n=27)
Phadia® 250 10 66 6 17 0.370
(0.215–0.558)
0.917 (0.830–0.961) Anti-Sm
INOVA 10 71 3 15 0.400
(0.234–0.593)
-46.3 to -7.5*
0.959 (0.887–0.986)
-3.1 to 10.3 SLE (n=25)
Phadia® 250 3 73 1 22 0.120
(0.042–0.300)
0.986 (0.927–0.998) Anti-Scl-70
INOVA 2 94 3 0 1.000
(0.961–1.000)
-0.1 to 196.1
0.400 (0.118–0.769)
-101.1 to 39.9 SSc (n=2)
Phadia® 250 2 97 0 0 1.000
(0.962–1.000)
1.000 (0.342–1.000)
ENAs, extractable nuclear antigens; CI, confidence interval; Dsens, difference between paired sensitivities; Dspec, difference between paired specificities; SjS, Sjögren’s syndrome; SLE, systemic lupus erythematosus; SSc, systemic sclerosis.
*Values show statistical data with significant differences.
tection of anti-extractable nuclear antigens in connective tissue diseases: comparison between passive hemagglutination, coun- terimmunoelectrophoresis and double immunodiffusion. Ric Clin Lab 1985;15:33-8.
9. Lynes MA. Solid-phase immunoassays. Curr Protoc Toxicol 2005;
Chapter 18:Unit18.7.
10. Chen YJ, Chen M, Hsieh YC, Su YC, Wang CH, Cheng CM, et al.
Development of a highly sensitive enzyme-linked immunosor- bent assay (ELISA) through use of poly-protein G-expressing cell- based microplates. Sci Rep 2018;8:17868.
11. Pereira KM, Dellavance A, Andrade LE. The challenge of identifi- cation of autoantibodies specific to systemic autoimmune rheu- matic diseases in high throughput operation: proposal of reliable and feasible strategies. Clin Chim Acta 2014;437:203-10.
12. Jeong S, Hwang H, Roh J, Shim JE, Kim J, Kim GT, et al. Evaluation of an automated screening assay, compared to indirect immuno- fluorescence, an extractable nuclear antigen assay, and a line im- munoassay in a large cohort of Asian patients with antinuclear antibody-associated rheumatoid diseases: a multicenter retro- spective study. J Immunol Res 2018;2018:9094217.
13. Au EY, Ip WK, Lau CS, Chan YT. Evaluation of a multiplex flow immunoassay versus conventional assays in detecting autoanti- bodies in systemic lupus erythematosus. Hong Kong Med J 2018;
24:261-9.
14. TDR Diagnostics Evaluation Expert Panel, Banoo S, Bell D, Bossuyt P, Herring A, Mabey D, Poole F, et al. Evaluation of diagnostic
tests for infectious diseases: general principles. Nat Rev Microbi- ol 2010;8(12 Suppl):S17-29.
15. Elrefaei M, Boose K, McGee M, Tarrant TK, Lin FC, Fine JP, et al.
Second generation automated anti-CCP test better predicts the clinical diagnosis of rheumatoid arthritis. J Clin Immunol 2012;
32:131-7.
16. Viera AJ, Garrett JM. Understanding interobserver agreement: the kappa statistic. Fam Med 2005;37:360-3.
17. Altman DG, Machin D, Bryant TN, Gardner MJ. Statistics with con- fidence. 2nd ed. London: BMJ Books; 2000.
18. CLSI. User protocol for evaluation of qualitative test performance;
approved guideline—second edition. CLSI document EP12-A2.
Wayne, PA: Clinical and Laboratory Standards Institute; 2008.
19. van der Pol P, Bakker-Jonges LE, Kuijpers JHSAM, Schreurs MWJ.
Analytical and clinical comparison of two fully automated immu- noassay systems for the detection of autoantibodies to extractable nuclear antigens. Clin Chim Acta 2018;476:154-9.
20. Banhuk FW, Pahim BC, Jorge AS, Menolli RA. Relationships among antibodies against extractable nuclear antigens, antinuclear anti- bodies, and autoimmune diseases in a Brazilian public hospital.
Autoimmune Dis 2018;2018:9856910.
21. Lee SA, Kahng J, Kim Y, Park YJ, Han K, Kwok SK, et al. Compara- tive study of immunofluorescent antinuclear antibody test and line immunoassay detecting 15 specific autoantibodies in patients with systemic rheumatic disease. J Clin Lab Anal 2012;26:307-14.