산삼 약침이 정상 중년여성의 맥파요인에 미치는 영향
Effect of pulse-wave factors in Middle Aged Women by Mountain Cultivated Ginseng Pharmacopuncture
Original Articles
Sang Wook Park*, Yi Soon Kim**, Won Deok Hwang*, Gyeong Cheol Kim*
*College of Oriental Medicine, Dong-eui University
**Department of Nursing, College of Natural Science, Dong-eui University
ABSTRACT
Objectives: The aim of this experiment is to know about Effect of pulse-wave factors in Middle Aged Women by Mountain Cultivated Ginseng Pharmacopuncture.
Methods: First 20 Middle Aged women are diagnosed by pulse diagnosis, and then Mountain Cultivated Ginseng Pharmacopuncture(1 injection 20cc) were injected. 30 minutes later, pulse diag- nosis again performed. As a result, method of one-group pretest-posttes design were used for evalua- tion.
Results: T(Total pulse cycle) time statistically significant increased on both left and right chon, kwan, cheok. T4time statistically significant increased on both left and right chon, kwan, cheok. T4-T1/T indexs except left cheokmaek, Right cheokmaek observation area decreased significantly in four sites.
Wm(indicating high pressure retention time) indexs increased significantly in the five sites were observed except right chon maek.
Conclusions: Effect of pulse-wave factors in Middle Aged Women by Mountain Cultivated Ginseng Pharmacopuncture increased T, T4, Wm and decreased T4-T1/T indexs. The results of this experi- ment, Mountain Cultivated Ginseng Pharmacopuncture induced to increase the Pulse-wave's stability and strength.
Key Words:
Mountain Cultivated Ginseng
Pharmacopuncture, pulse-wave factors, pulse diagnosis Received : 11. 02. 17 Revised : 11. 02. 25 Accepted : 11. 02. 25
Corresponding author Professor, epartment of diagnostics, College of Oriental Medicine, Dongeui University, Busan, Korea.
Tel: 051-850-8649, E-mail : [email protected]
I
. 서론20
one-group pretest- posttest design
II
. 연구 방법 1HRV, PWV one-group pretest-posttest design
Fig. 1
2
2010 10 11
0.05 0.8 0.8
Cohen 20
20
3
1
8 3-6 7-
15
100 2
1.000 0.45 0.2
2 0.1
20cc
2
3D MAC DAEYOMEDI co. Korea
5 50 2
90 3 140 4 190 5 240
6
20 30
10
5
4
1
HR Heart Rate 1
bpm beat per minute CMBP Mean Blood Pressure
ESV Estimated Stroke Volume 1 mL
ESI Estimated Stroke Index 1
ECO Estimated Cardiac Output 1
ECI Estimated Cardiac Output Index
ECR Estimated Circulation Resistance
ECRI Estimated Circulation Resistance Index
2
h1
Unit div digital value for pressure
h2
Unit div digital value for pressure h3
h3
Unit div digital value for pressure h4
Unit div digital value for pressure
h5
h5 0
Unit div digital value for pres- sure
t1
Unit sec second t2
Unit sec second t3
sec Unit
sec second t4 t4 Unit sec second
t5 t5 Unit sec second
t t
Unit sec sec- ond
Wm 2/3
Unit sec second
Ap
Unit div2square of digital value for pressure As
AD AW T-T4 T1/T
T4-T1 T
5
SPSS/12.0
1
2 paired t-test,
Wilcoxon
III
. 연구결과 120 48.10
5.90 BMI 21.79 2.17
19 95 1 5
2.95 0.61 15.55 1.54
13 65
7 32 50.0 4.97
Table 1.
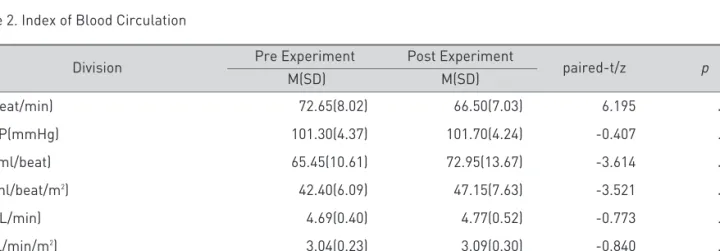
2
CMBP, ECO, ECI, ECR, ECRI Wilcoxon
HR 72.65 8.02 beat/min 66.50 7.03 beat/min
p=. 000 ESV 65.45 10.61 ml/beat 72.95 13.67 ml/beat
p=.001 ESI 42.40 6.09 ml/beat/m2 47.15 7.63 ml/beat/m2
p=.001 CMBP, ECO, ECI, ECR, ECRI Table 2.
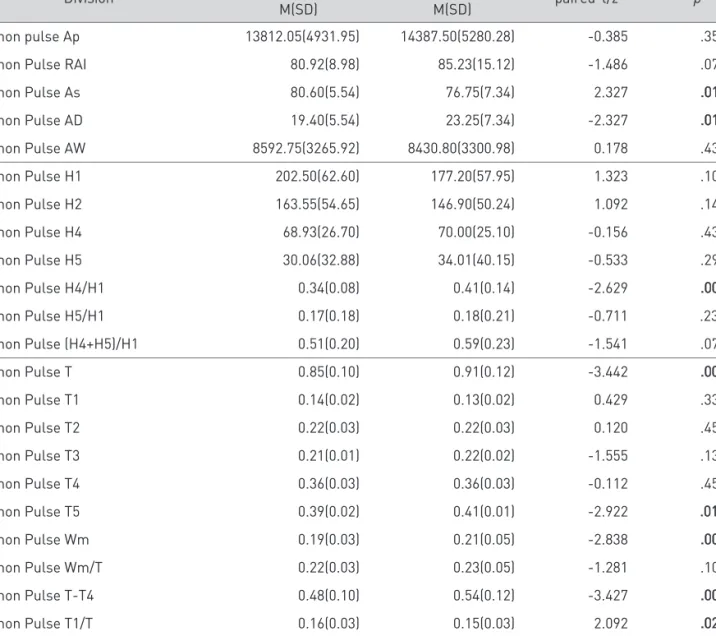
3
As, AD,
H4/H1 p=.008 T
p=.001 T5 p=.011 Wm p=.005 T-T4 p=.001
T1/T p=.025 T4- T1 T p=.032
Table 3.
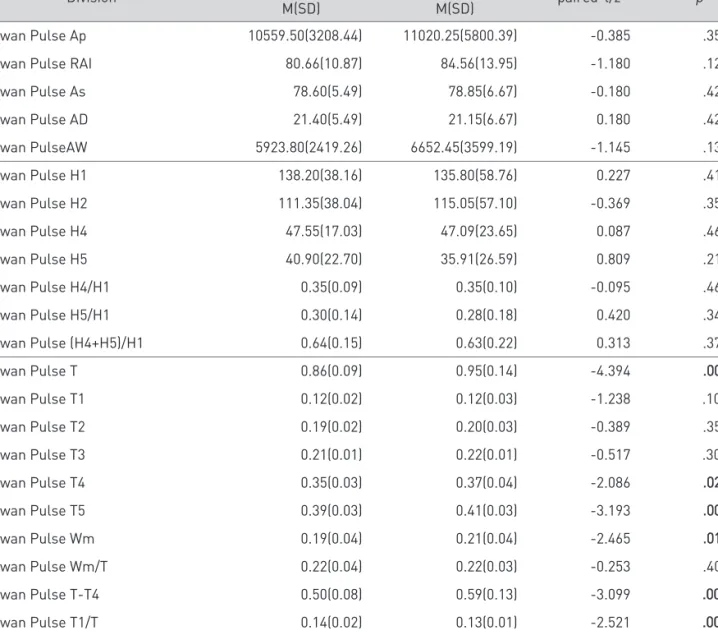
4
T
p=.000 T4 p=.025
T5 p=.004 Wm p=.012 T-T4 p=.001
T1/T p=.006 T4-T1 /T p=.043
Table 4.
5
T p =.0 00 T4 p=.002 T5 p=.025 Wm p=.000 T-T4 p=
.014 Table 5.
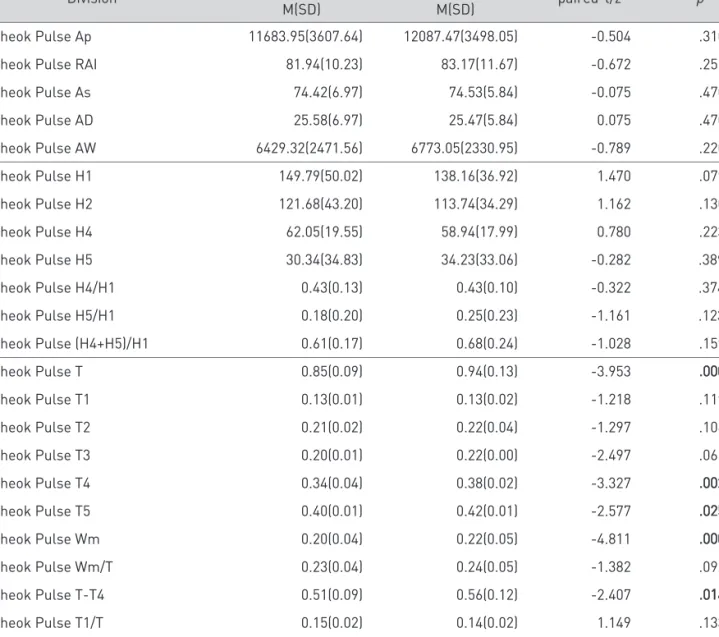
6
As p=.002 AD
p=.002 H4/H1
p=.015 T p=.001 T5 p=.039 T-T4 p=
.001 T4-T1 /T
p=.047 Table 6.
7
RAI p=.023 H1
p=.025 H4/H1 p=.005 H4+H5 H1 p=.048
T p=.000 T1 p=.032 T4 p=.001 T5 p=.009 Wm p=.015 T-T4 p=.000
T4-T1 T p=.012 Table 7.
8
Ap p=
.015 AW p=.031
H1 p=.002
H2 p=.013 H5 p=.024 H4/H1
p=.030 T p=.003 Wm p=.005 T-T4 p=.006
Table 8.
IV
. 고찰30
30
48.10 5.90 BMI 21.79 2.17
95 5 2.95 0.61
15.55 1.54
13 65 7 32
50.0 4.97
Table 3. As 80.60 5.54
76.75 7.34 p=.016
AD 19.40 5.54 23.25 7.34
p=.016 H4/H1 0.34 0.08 0.41 0.14
p=.008 T 0.85 0.10
0.91 0.12 p=.001 T5
0.39 0.02 0.41 0.01
p=.011 Wm 0.19 0.03 0.21 0.05 p=.005 T-T4
0.48 0.10 0.54 0.12 p=.001
T1/T 0.16 0.03 0.15 0.03 p=.025 T4-T1 T
0.27 0.03 0.25 0.04 p=.032 T
AD T-T4
T4- T1 T
Wm Wm
Table 4. T 0.86 0.09
0.95 0.14 p=.000 T4
0.35 0.03 0.37 0.04
p=.025 T5 0.39 0.03 0.41 0.03 p=.004 Wm
0.19 0.04 0.21 0.04 p=.012 T-T4 0.50 0.08 0.59 0.13 p=.001
T1/T
0.14 0.02 0.13 0.01 p=.006 T4-T1
T 0.28 0.03 0.26 0.04 p
=.043 T
T-T4
T4-T1 T
Wm
Table 5. T 0.85 0.09
0.94 0.13 p=.000 T4 0.34 0.04
0.38 0.02 p=.002 T5 0.40
0.01 0.42 0.01 p=.025 Wm
0.20 0.04 0.22 0.05 p=.000 T-T4 0.51 0.09 0.56 0.12 p=.014
T T-T4
Wm
Table 6. As 77.35 9.66
74.85 5.27 p=.002
AD 22.65 9.66) 25.15 5.27
p=.002 H4/H1 0.31 0.07 0.35 0.09
p=.015 T 0.87 0.24
0.91 0.12 p=.001 T5
0.39 0.02 0.41 0.03
p=.039 T-T4 0.51
0.22 0.55 0.11
p=.001 T4-T1 T 0.27 0.04
0.25 0.02 p=.047
T T-T4 T4-T1 T
Table 7. RAI 74.78 11.
71 79.87 14.02
p=.023 H1 138.35 35.10
123.20 35.76 p=.025
H4/H1 0.33 0.10 0.38 0.10
p=.005 H4+H5 H1 0.63 0.19 0.72 0.19 p=.048
T 0.83 0.10 0.91 0.12
p=.000 T1 0.12 0.01 0.13 0.0
2 p=.032 T4 0.34 0.03
0.36 0.02 p=.001 T5 0.39 0.02 0.40 0.02 p=.009 Wm 0.17 0.05
0.19 0.05 p=.015 T-T4 0.49 0.09 0.55 0.10 p=.000
T4-T1 T 0.27 0.03 0.26 0.04
p=.012 T T-T4 T4-
T1 T
Wm T1
Table 8. Ap 12122.47 4718.
78 10136.47 4544.71 p=.015 AW 6699.26 3235.68 5722.84 3054.
45 p=.031 H1
138.35 35.10 128.05 61.77 p=.002 H2
128.21 61.75 102.89 54.98 p=.013 H5 42.23 31.81 26.91 29.13
p=.024 H4/H1 0.35 0.13
0.41 0.14 p=.
030 T 0.84 0.11 0.89 0.10
p=.003 Wm 0.18 0.04 0.20
0.05 p=.005 T-T4 0.49 0.11 0.54 0.09 p=.006
T T-T4
Wm
Wm
T
HR 72.65 66.50
T T4
T5
t4-t1/t 4
Wm
5
30
V
. 결론 20one-group pretest-posttest design
1. HRdms 72.65Beat/min
66.50Beat/min
ESV 65.65ml/min
72.95ml/min ESI
42.40ml/beat/m2 47.15ml/beat/m2
2. T
3. T T4 T5
t4-t1/t 4
4. Wm
5
VI
. 참고문헌1. Committee of KPI. Pharmacopuncturology.
Elsevier Korea. 2008; 211.
2. Shin SS, Kim KC, Choi YH, Lee YT, Eom HS, Kim CS. Critic standardization and Objectivity of mountain grown ginseng. KIOM vol.5.
2001;107-114.
3. School of korean Medicine, Dept. of Herbo- logy. Herbology. Younggrim. 1994;531.
4. Organizing Committee of Chinese Materia Medica, Chinese Materia Medica, Jungdam 1997;(7)3473-3479.
5. Kwon KR, Cho AL , Lee SG. The clinical on acute and subacute toxicity and anti-cancer effects of cultivated wild ginseng herbal acup- uncture. J. of KPI. 2003; 6(2):15-26.
6. Cho HC, Lee SG, Kwon KR. Experimental study of cultivated wild ginseng herbal acupu- ncture to the apoptosis. J. of KPI.
2004;7(2). 1-18.
7. Kwon KR, Kim BW. Comparative study of
Various Ginseng Herbal Acupuncture-By mea- suring the increase of life span of mice and Expression of cytokine mRNA. J. of Korean Acupuncture & Moxibustion Society.
2005;22(2):203-210.
8. Kwon KR, Yoon HC, Kim HH. Anti-cancer effects of cultivated wild ginseng herbal acu- puncture in C57BL/6 mice injected with B16/F10 cells reproductive toxicity by doxoru- bicin. J. of Korean Acupuncture & Moxibusti- on Society. 2006;23(1):105-120.
9. Lim SY, Lee SJ, Kwon KR. Anti-cancer and promoting effects of cultivated wild ginseng herbal acupuncture on hepatic metastatic mod- el using Colon26-L5 carcinoma cells. J. of Ko- rean Acupuncture & Moxibustion Society.
2006;23(1):121-134.
10. Cho BJ, Kwon KR. Effects of cultivated wild ginseng herbal acupuncture to the serum cytokine on hepatic metastatic model using Colon26-L5 carcinoma cells. J. of KPI.
2006;9(1):127-138.
11. Heo jun Dong-eui-bo-gam, beob-in munhwasa.
1999;167.
12. Keun-Young Yoo, Daehee Kang, Sue Kyung Park*, Sook-Un Kim, Aesun Shin, Hachung Yoon, Se-Hyun Ahn, , Dong-Young Noh, Kuk- Jin Choe. Epidemiology of Breast Cancer in Korea. J Korean Med Sci 2002;17:1-6.
13. Lee gyu-jun Somun-daeyo, Dae-sung Medical company. 2000;19.
14. Cohen, J. Statistical power analysis for the behavioral sciences(2nd ed). New York : Acad- emic Press. 1988.
15. Heo jun Dong-eui-bo-gam, beob-in munhwasa.
1999;167.
16. Gyeong Cheol kim, Soon sik shin, Hee jung kang, Chul Yong Cha. The basic investigation for the objective study on the pulsation. korean J. Oriental Physiology 2003;17(5):1147-1150.
17. Kyeong ho, Ryu. The clinical study regarding the change of pulse-wave in Kwan area by incremental pressure measuremen. Department of Oriental Medicine, Graduate School, Dong- eui University. 2008.
18. Gyeong Cheol Jeong won Lee, Kyeong ho, Ryu, Dong Il Park, Woo Jin Shin, Hee jung K- ang. Study on the waveform analysis of radial artery pulse dianosis using pulse meter and analyzer. korean J. Oriental Physiology 2009;23(1):186-191.
Prior investigation Treatment Post investigation
Experimental group Y1 X Y2
Fig. 1 Design of study process
X : Mountain Cultivated Ginseng Pharmacopuncture (20cc /one time) Y1 : General Characteristic, Pulse wave
Y2 : Pulse wave
Character Division Number(%)
Age(yr) 31~40 3(15)
41~50 9(45)
51~60 8(40)
M(SD) 48.10(5.90)
BMI underweight(~18.5) 2(10)
Normal-weight(18.5~22.9) 13(65)
Overweight(23~24.9) 4(20)
Obesity(25~29.9) 1(5)
M(SD) 21.79(2.17)
Marital status Married 19(95)
Unmarried 1(5)
Number of childen 0 1(5)
1 1(5)
2 16(80)
3 2(10)
M(SD) 2.95(0.61)
Menarche age(yr) 10~15 8(40)
16~20 12(60)
M(SD) 15.55(1.54)
Menopause No 13(65)
Yes 7(32)
Menopause age(yr) ~40 1(14.3)
41~50 1(14.3)
51~60 5(71.4)
M(SD) 50.00(4.97)
Table 1. General Characteristic of Recipient N=20
Division Pre Experiment
M(SD)
Post Experiment
M(SD) paired-t/z p
HR(beat/min) CMBP(mmHg) ESV(ml/beat) ESI(ml/beat/m2) ECO(L/min) ECI(L/min/m2) ECR(dyne*sec*cm-5) ECRI(dyne*sec/cm)
72.65(8.02) 101.30(4.37) 65.45(10.61) 42.40(6.09)
4.69(0.40) 3.04(0.23) 1739.15(138.87) 2682.00(228.69)
66.50(7.03) 101.70(4.24) 72.95(13.67) 47.15(7.63)
4.77(0.52) 3.09(0.30) 1730.20(238.84) 2662.90(323.96)
6.195 -0.407 -3.614 -3.521 -0.773 -0.840 0.151 0.218
..000000 .344 ..000011 ..000011 .225 .206 .441 .415
Table 2. Index of Blood Circulation N=20
z : Wilcoxon signed rank test
Division Pre Experiment M(SD)
Post Experiment
M(SD) paired-t/z p
Left Chon pulse Ap Left Chon Pulse RAI Left Chon Pulse As Left Chon Pulse AD Left Chon Pulse AW Left Chon Pulse H1 Left Chon Pulse H2 Left Chon Pulse H4 Left Chon Pulse H5 Left Chon Pulse H4/H1 Left Chon Pulse H5/H1 Left Chon Pulse (H4+H5)/H1 Left Chon Pulse T
Left Chon Pulse T1 Left Chon Pulse T2 Left Chon Pulse T3 Left Chon Pulse T4 Left Chon Pulse T5 Left Chon Pulse Wm Left Chon Pulse Wm/T Left Chon Pulse T-T4 Left Chon Pulse T1/T Left Chon Pulse (T4-T1)/T
13812.05(4931.95) 80.92(8.98) 80.60(5.54) 19.40(5.54) 8592.75(3265.92)
202.50(62.60) 163.55(54.65)
68.93(26.70) 30.06(32.88) 0.34(0.08) 0.17(0.18) 0.51(0.20) 0.85(0.10) 0.14(0.02) 0.22(0.03) 0.21(0.01) 0.36(0.03) 0.39(0.02) 0.19(0.03) 0.22(0.03) 0.48(0.10) 0.16(0.03) 0.27(0.03)
14387.50(5280.28) 85.23(15.12) 76.75(7.34) 23.25(7.34) 8430.80(3300.98)
177.20(57.95) 146.90(50.24) 70.00(25.10) 34.01(40.15) 0.41(0.14) 0.18(0.21) 0.59(0.23) 0.91(0.12) 0.13(0.02) 0.22(0.03) 0.22(0.02) 0.36(0.03) 0.41(0.01) 0.21(0.05) 0.23(0.05) 0.54(0.12) 0.15(0.03) 0.25(0.04)
-0.385 -1.486 2.327 -2.327 0.178 1.323 1.092 -0.156 -0.533 -2.629 -0.711 -1.541 -3.442 0.429 0.120 -1.555 -0.112 -2.922 -2.838 -1.281 -3.427 2.092 1.970
.352 .077 ..001166 ..001166 .430 .101 .144 .439 .297 ..000088 .239 .070 ..000011 .336 .453 .130 .456 ..001111 ..000055 .108 ..000011 ..002255 ..003322
Table 3. Left Chon Pulse Wave Parameter N=20
z : Wilcoxon signed rank test
Division Pre Experiment M(SD)
Post Experiment
M(SD) paired-t/z p
Left Kwan Pulse Ap Left Kwan Pulse RAI Left Kwan Pulse As Left Kwan Pulse AD Left Kwan PulseAW Left Kwan Pulse H1 Left Kwan Pulse H2 Left Kwan Pulse H4 Left Kwan Pulse H5 Left Kwan Pulse H4/H1 Left Kwan Pulse H5/H1 Left Kwan Pulse (H4+H5)/H1 Left Kwan Pulse T
Left Kwan Pulse T1 Left Kwan Pulse T2 Left Kwan Pulse T3 Left Kwan Pulse T4 Left Kwan Pulse T5 Left Kwan Pulse Wm Left Kwan Pulse Wm/T Left Kwan Pulse T-T4 Left Kwan Pulse T1/T Left Kwan Pulse (T4-T1)/T
10559.50(3208.44) 80.66(10.87)
78.60(5.49) 21.40(5.49) 5923.80(2419.26) 138.20(38.16) 111.35(38.04) 47.55(17.03) 40.90(22.70) 0.35(0.09) 0.30(0.14) 0.64(0.15) 0.86(0.09) 0.12(0.02) 0.19(0.02) 0.21(0.01) 0.35(0.03) 0.39(0.03) 0.19(0.04) 0.22(0.04) 0.50(0.08) 0.14(0.02) 0.28(0.03)
11020.25(5800.39) 84.56(13.95) 78.85(6.67) 21.15(6.67) 6652.45(3599.19) 135.80(58.76) 115.05(57.10) 47.09(23.65) 35.91(26.59) 0.35(0.10) 0.28(0.18) 0.63(0.22) 0.95(0.14) 0.12(0.03) 0.20(0.03) 0.22(0.01) 0.37(0.04) 0.41(0.03) 0.21(0.04) 0.22(0.03) 0.59(0.13) 0.13(0.01) 0.26(0.04)
-0.385 -1.180 -0.180 0.180 -1.145 0.227 -0.369 0.087 0.809 -0.095
0.420 0.313 -4.394 -1.238 -0.389 -0.517 -2.086 -3.193 -2.465 -0.253 -3.099 -2.521 1.809
.352 .126 .429 .429 .133 .412 .358 .466 .214 .463 .340 .379 ..000000 .108 .351 .303 ..002255 ..000044 ..001122 .402 ..000011 ..000066 ..004433
Table 4. Left Kwan Pulse Wave Parameter N=20
z : Wilcoxon signed rank test
Division Pre Experiment M(SD)
Post Experiment
M(SD) paired-t/z p
Left Cheok Pulse Ap Left Cheok Pulse RAI Left Cheok Pulse As Left Cheok Pulse AD Left Cheok Pulse AW Left Cheok Pulse H1 Left Cheok Pulse H2 Left Cheok Pulse H4 Left Cheok Pulse H5 Left Cheok Pulse H4/H1 Left Cheok Pulse H5/H1 Left Cheok Pulse (H4+H5)/H1 Left Cheok Pulse T
Left Cheok Pulse T1 Left Cheok Pulse T2 Left Cheok Pulse T3 Left Cheok Pulse T4 Left Cheok Pulse T5 Left Cheok Pulse Wm Left Cheok Pulse Wm/T Left Cheok Pulse T-T4 Left Cheok Pulse T1/T Left Cheok Pulse (T4-T1)/T
11683.95(3607.64) 81.94(10.23) 74.42(6.97) 25.58(6.97) 6429.32(2471.56) 149.79(50.02) 121.68(43.20) 62.05(19.55) 30.34(34.83) 0.43(0.13) 0.18(0.20) 0.61(0.17) 0.85(0.09) 0.13(0.01) 0.21(0.02) 0.20(0.01) 0.34(0.04) 0.40(0.01) 0.20(0.04) 0.23(0.04) 0.51(0.09) 0.15(0.02) 0.26(0.05)
12087.47(3498.05) 83.17(11.67) 74.53(5.84) 25.47(5.84) 6773.05(2330.95) 138.16(36.92) 113.74(34.29) 58.94(17.99) 34.23(33.06) 0.43(0.10) 0.25(0.23) 0.68(0.24) 0.94(0.13) 0.13(0.02) 0.22(0.04) 0.22(0.00) 0.38(0.02) 0.42(0.01) 0.22(0.05) 0.24(0.05) 0.56(0.12) 0.14(0.02) 0.27(0.03)
-0.504 -0.672 -0.075 0.075 -0.789 1.470 1.162 0.780 -0.282 -0.322 -1.161 -1.028 -3.953 -1.218 -1.297 -2.497 -3.327 -2.577 -4.811 -1.382 -2.407 1.149 -0.680
.310 .255 .470 .470 .220 .079 .130 .223 .389 .374 .123 .159 ..000000 .119 .106 .065 ..000022 ..002255 ..000000 .092 ..001144 .133 .253
Table 5. Left Cheok Pulse Wave Parameter N=20
z : Wilcoxon signed rank test
Division Pre Experiment M(SD)
Post Experiment
M(SD) paired-t/z p
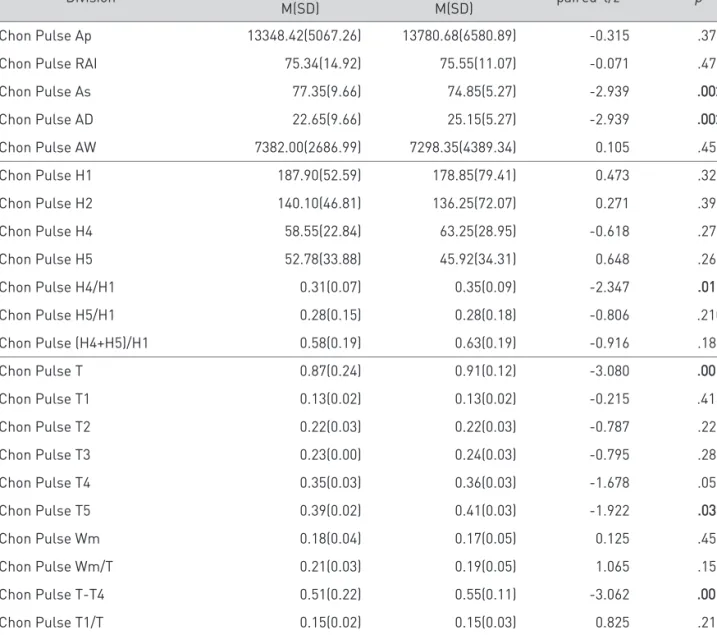
Right Chon Pulse Ap Right Chon Pulse RAI Right Chon Pulse As Right Chon Pulse AD Right Chon Pulse AW Right Chon Pulse H1 Right Chon Pulse H2 Right Chon Pulse H4 Right Chon Pulse H5 Right Chon Pulse H4/H1 Right Chon Pulse H5/H1 Right Chon Pulse (H4+H5)/H1 Right Chon Pulse T
Right Chon Pulse T1 Right Chon Pulse T2 Right Chon Pulse T3 Right Chon Pulse T4 Right Chon Pulse T5 Right Chon Pulse Wm Right Chon Pulse Wm/T Right Chon Pulse T-T4 Right Chon Pulse T1/T Right Chon Pulse (T4-T1)/T
13348.42(5067.26) 75.34(14.92) 77.35(9.66) 22.65(9.66) 7382.00(2686.99) 187.90(52.59) 140.10(46.81) 58.55(22.84) 52.78(33.88) 0.31(0.07) 0.28(0.15) 0.58(0.19) 0.87(0.24) 0.13(0.02) 0.22(0.03) 0.23(0.00) 0.35(0.03) 0.39(0.02) 0.18(0.04) 0.21(0.03) 0.51(0.22) 0.15(0.02) 0.27(0.04)
13780.68(6580.89) 75.55(11.07) 74.85(5.27) 25.15(5.27) 7298.35(4389.34) 178.85(79.41) 136.25(72.07) 63.25(28.95) 45.92(34.31) 0.35(0.09) 0.28(0.18) 0.63(0.19) 0.91(0.12) 0.13(0.02) 0.22(0.03) 0.24(0.03) 0.36(0.03) 0.41(0.03) 0.17(0.05) 0.19(0.05) 0.55(0.11) 0.15(0.03) 0.25(0.02)
-0.315 -0.071 -2.939 -2.939 0.105 0.473 0.271 -0.618 0.648 -2.347 -0.806 -0.916 -3.080 -0.215 -0.787 -0.795 -1.678 -1.922 0.125 1.065 -3.062 0.825 1.768
.378 .472 ..000022 ..000022 .459 .321 .395 .272 .262 ..001155 .210 .186 ..000011 .415 .220 .286 .055 ..003399 .451 .150 ..000011 .210 ..004477
Table 6. Right Chon Pulse Wave Parameter N=20
z : Wilcoxon signed rank test
Division Pre Experiment M(SD)
Post Experiment
M(SD) paired-t/z p
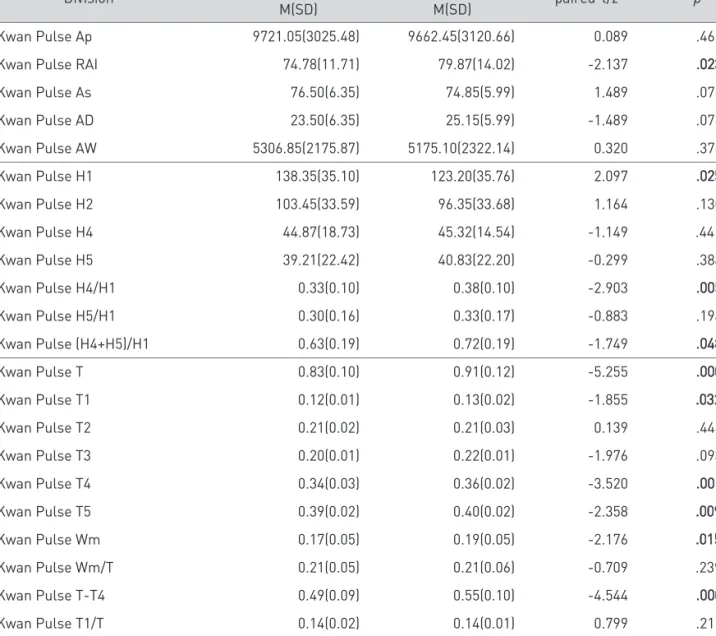
Right Kwan Pulse Ap Right Kwan Pulse RAI Right Kwan Pulse As Right Kwan Pulse AD Right Kwan Pulse AW Right Kwan Pulse H1 Right Kwan Pulse H2 Right Kwan Pulse H4 Right Kwan Pulse H5 Right Kwan Pulse H4/H1 Right Kwan Pulse H5/H1 Right Kwan Pulse (H4+H5)/H1 Right Kwan Pulse T
Right Kwan Pulse T1 Right Kwan Pulse T2 Right Kwan Pulse T3 Right Kwan Pulse T4 Right Kwan Pulse T5 Right Kwan Pulse Wm Right Kwan Pulse Wm/T Right Kwan Pulse T-T4 Right Kwan Pulse T1/T Right Kwan Pulse (T4-T1)/T
9721.05(3025.48) 74.78(11.71) 76.50(6.35) 23.50(6.35) 5306.85(2175.87) 138.35(35.10) 103.45(33.59) 44.87(18.73) 39.21(22.42) 0.33(0.10) 0.30(0.16) 0.63(0.19) 0.83(0.10) 0.12(0.01) 0.21(0.02) 0.20(0.01) 0.34(0.03) 0.39(0.02) 0.17(0.05) 0.21(0.05) 0.49(0.09) 0.14(0.02) 0.27(0.03)
9662.45(3120.66) 79.87(14.02) 74.85(5.99) 25.15(5.99) 5175.10(2322.14) 123.20(35.76) 96.35(33.68) 45.32(14.54) 40.83(22.20) 0.38(0.10) 0.33(0.17) 0.72(0.19) 0.91(0.12) 0.13(0.02) 0.21(0.03) 0.22(0.01) 0.36(0.02) 0.40(0.02) 0.19(0.05) 0.21(0.06) 0.55(0.10) 0.14(0.01) 0.26(0.04)
0.089 -2.137 1.489 -1.489 0.320 2.097 1.164 -1.149 -0.299 -2.903 -0.883 -1.749 -5.255 -1.855
0.139 -1.976 -3.520 -2.358 -2.176 -0.709 -4.544
0.799 2.461
.465 ..002233 .076 .076 .376 ..002255 .130 .441 .384 ..000055 .194 ..004488 ..000000 ..003322 .446 .093 ..000011 ..000099 ..001155 .239 ..000000 .217 ..001122
Table 7. Right Kwan Pulse Wave Parameter N=20
z : Wilcoxon signed rank test
Division Pre Experiment M(SD)
Post Experiment
M(SD) paired-t/z p
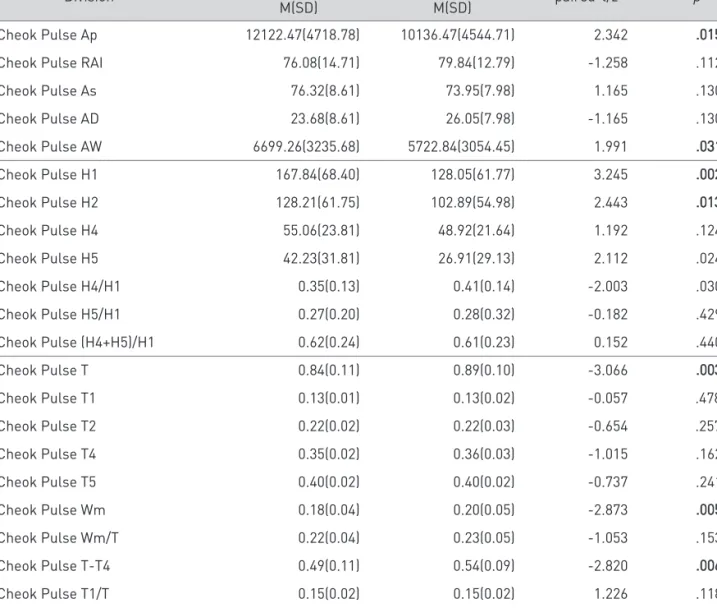
Right Cheok Pulse Ap Right Cheok Pulse RAI Right Cheok Pulse As Right Cheok Pulse AD Right Cheok Pulse AW Right Cheok Pulse H1 Right Cheok Pulse H2 Right Cheok Pulse H4 Right Cheok Pulse H5 Right Cheok Pulse H4/H1 Right Cheok Pulse H5/H1 Right Cheok Pulse (H4+H5)/H1 Right Cheok Pulse T
Right Cheok Pulse T1 Right Cheok Pulse T2 Right Cheok Pulse T4 Right Cheok Pulse T5 Right Cheok Pulse Wm Right Cheok Pulse Wm/T Right Cheok Pulse T-T4 Right Cheok Pulse T1/T Right Cheok Pulse (T4-T1)/T
12122.47(4718.78) 76.08(14.71) 76.32(8.61) 23.68(8.61) 6699.26(3235.68) 167.84(68.40) 128.21(61.75) 55.06(23.81) 42.23(31.81) 0.35(0.13) 0.27(0.20) 0.62(0.24) 0.84(0.11) 0.13(0.01) 0.22(0.02) 0.35(0.02) 0.40(0.02) 0.18(0.04) 0.22(0.04) 0.49(0.11) 0.15(0.02) 0.27(0.04)
10136.47(4544.71) 79.84(12.79) 73.95(7.98) 26.05(7.98) 5722.84(3054.45) 128.05(61.77) 102.89(54.98) 48.92(21.64) 26.91(29.13) 0.41(0.14) 0.28(0.32) 0.61(0.23) 0.89(0.10) 0.13(0.02) 0.22(0.03) 0.36(0.03) 0.40(0.02) 0.20(0.05) 0.23(0.05) 0.54(0.09) 0.15(0.02) 0.26(0.04)
2.342 -1.258 1.165 -1.165 1.991 3.245 2.443 1.192 2.112 -2.003 -0.182 0.152 -3.066 -0.057 -0.654 -1.015 -0.737 -2.873 -1.053 -2.820 1.226 1.659
..001155 .112 .130 .130 ..003311 ..000022 ..001133 .124 .024 .030 .429 .440 ..000033 .478 .257 .162 .241 ..000055 .153 ..000066 .118 .057
Table 8. Right Cheok Pulse Wave Parameter N=20
z : Wilcoxon signed rank test