Vol. 16, No. 6 pp. 3837-3844, 2015
Effects of Marketted-pigs per Sow per Year to recognition of Hog Farm Business Management
Hyun-ho Choi
1, Jeong-Seop Shin
1, Dong-kyun Suh
1, Dong-won Cheon
1*1National Institute of Animal Science, RDA
양돈농가 경영관리별 인식이 MSY에 미치는 영향
최현호1, 신정섭1, 서동균1, 천동원1*
1농촌진흥청 국립축산과학원
Abstract This study recommends effective ways to establish management strategies by suggesting to hog farm managers the importance of variables’ tendency to affect MSY according to hog management. Study subjects included 55 hog farms, which were analyzed using factor and regression analyses to determine each variable’s importance (22 total) for hog management, using MSY as the dependent variable. In the analysis result, the main necessary factor controlling MSY improvement was vaccination, followed, according to decreasing significance, by stages of growth classified breeding, thermo-humidity and ventilation control, and veterinary and hygienic control. Based on these results, suggesting the main factors to improve MSY to hog farms will establish management strategies.
요 약 본 논문은 경영주의 양돈사양 항목별 성향이 MSY에 미치는 중요도를 제시함으로서 양돈농가별 효과적인 경영전략 수립에 방향을 제시하고자 수행하였다. 조사는 양돈농가 50호를 대상으로 하였으며 MSY을 종속변수로 하여 양돈사양 항목 별 중요도(22항목)로 요인분석 및 회귀분석을 실시하였다. 분석결과, MSY 향상의 중요 요인으로는 예방접종이 필수적으로 나타났으며 성장단계별 구분사육, 온습도 및 환기관리, 방역 및 위생관리 순으로 유의하게 나타났다. 이러한 결과를 토대로 양돈농가에 MSY 향상의 중요한 요인을 제시함으로써 경영전략을 수립할 수 있을 것이다.
Key Words : MSY, Pig, Regression analysis, Management
*Corresponding Author : Dong-won Cheon(National Institute of Animal Science, RDA) Tel: +82-63-238-7215 email: [email protected]
Received May 1, 2015 Accepted June 11, 2015
Revised June 2, 2015 Published June 30, 2015
1. Introduction
The condition of current Korean hog industries must be competitive with the hog exporting countries because the FTA (Free Trade Agreement) was agreed on between Korea and the Australia, Canada and is processing with China, New Zealand and other developed livestock countries. Also, consumption delay and other difficulties due to the worsening national economic condition appeared because of increasing feed costs, which are linked to increasing international grain costs, and internally, because of occurrences of
Foot and Mouth Disease (FMD), increasing number of raised heads, and increasing excrement handling costs.
If new solutions cannot be suggested due to the instability of the production foundation, then the future of the hog industries is uncertain.
According to 14.8 heads in Korea, 26.0 heads in the Netherlands, and 21.0 heads in England in 2009, MSY (Marketed-Pigs per Sow per Year) of the domestic hog productivity, which is the most general productivity index, is noticeably lower based on the technical standard than the developed countries (The Hog Raising Association, 2011).
The government and related industries support the modernization of pigsty facilities, antibiotic-free certification, and hazard analysis critical control point, and gave training on computerization control, management control, feeding control, and disease control to hog farms to improve MSY. However, the result wasn’t satisfactory because MSY increased only 0.8 heads in 2011 from 2010, and also the mortality rates before and after weaning, which are the main factors that lower productivity, were 8.0-15.0% and 11.2-18.9%, respectively(The Hog Raising Association, 2011).
Hog management activity is constant because of high investing expenses and continuous production compared to other managements, and has a special structure that goes through complicated production processes due to partly exchanging supplies between several production categories, such as for sows and hogs. The amplitude of yearly management of each farm by these complicated management structures is largely different.
In the previous research on “Crucial factors and strategies of hog farm management to improve MSY”
by Kang et al. (2011), an MSY improvement plan was suggested by way of improvements to manager ability/ethic, manpower management, and facility/disease management. In the research on “A study on productivity improvement of swine farms using information of slaughter-hog disease check-up” by Lee et al. (2011), giving hog disease information to farms that use slaughter houses helps them deal with diseases properly. Like these studies, deciding which management practices are efficient and reasonable as an index to express productivity is necessary because there are many ways to approach the productivity measurement.
Research on hog farm management condition may suggest management strategies for improved productivity.
Therefore, this research was performed to provide information for management priorities by finding the importance of factors that affect MSY for each management business in detail.
2. MATERIALS AND METHODS
2.1 Research Areas and Subjects
For 2 months from September to October 2012, this research performed questionnaire surveys on the management conditions applied toward 85 hog farms that attended the hog permit system education. This research collected 85 surveys; however only 55 were used because 30 surveys were rejected due to poor answers. The farm totals for each region were 19 farms in Icheon, 17 in Naju, 10 in Haenam, and 9 in Youngnam. The average age of the research subjects was 52 years and the average number of raised heads on sow was 298.
2.2 Measurement Categories and Analysis Methods
2.2.1 Management ability and ethic
Management ability and ethic of hog farm managers yielded an MSY according to the number of raised heads on sow and marketed-pigs per year as the productivity judgment standard as shown in [Table 1].
The productivity effect factors were divided into the number of raised heads on sow, piggery type, piggery building year, disease occurrence at different growth stages, cause of disease occurrence, most damaging disease, management record control, and information acquisition route.
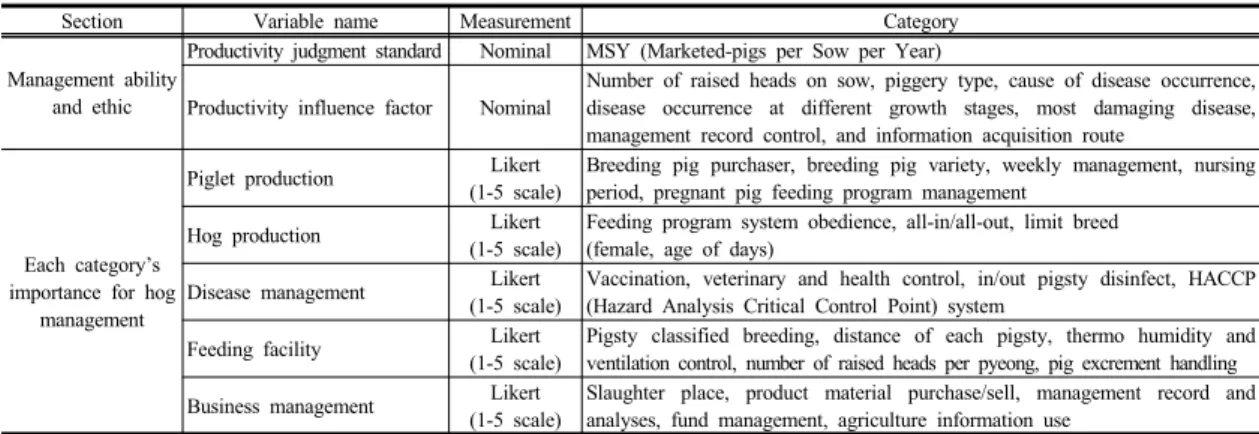
2.2.2 Research categories of hog management Farmers researched and divided the main factors that they think are important to hog management into 22 categories, including piglet production (5 categories), hog production (3 categories), disease management (4 categories), feeding facility (5 categories), and business management (5 categories), as shown in [Table 1]. The response fields used in the statistical analysis were a 5-level Likert scale to include “very important”,
“moderately important”, “averagely important”,
“moderately unimportant”, and “very unimportant”.
Section Variable name Measurement Category
Management ability and ethic
Productivity judgment standard Nominal MSY (Marketed-pigs per Sow per Year)
Productivity influence factor Nominal
Number of raised heads on sow, piggery type, cause of disease occurrence, disease occurrence at different growth stages, most damaging disease, management record control, and information acquisition route
Each category’s importance for hog
management
Piglet production Likert
(1-5 scale)
Breeding pig purchaser, breeding pig variety, weekly management, nursing period, pregnant pig feeding program management
Hog production Likert
(1-5 scale)
Feeding program system obedience, all-in/all-out, limit breed (female, age of days)
Disease management Likert (1-5 scale)
Vaccination, veterinary and health control, in/out pigsty disinfect, HACCP (Hazard Analysis Critical Control Point) system
Feeding facility Likert
(1-5 scale)
Pigsty classified breeding, distance of each pigsty, thermo humidity and ventilation control, number of raised heads per pyeong, pig excrement handling Business management Likert
(1-5 scale)
Slaughter place, product material purchase/sell, management record and analyses, fund management, agriculture information use
Table 1. Research variables for hog farm business management
2.2.3 Statistical Analysis
MSY according to the hog farm management condition was calculated through cross analysis using the SPSS (Statistical Package for the Social Science) program, where each group was analyzed using 22 variables for factor analysis such as technology type, facility type, environment, and others to find variables that affect MSY. Each group that was classified for factor analysis was processed for the main factors through multi-regression analysis. The regression formula is shown below.
Y = α + β1χ1 + β2χ2 + ··· + βiχi + εi
Where, Yij= measured value (predicted dependent variable),
α= constant,
β= regression coefficient of related independent variable,
χi= independent variable, and εi= random error.
3. Results
3.1 Factors Affecting MSY According to Management Ability and Ethic
3.1.1 Factors affecting MSY according to number of raised heads on sow and piggery type
The results of the research on MSY according to the number of raised heads on sow and piggery type using the sows as the study subject are shown in [Table 2].
In [Table 2], the number of raised head on sow was divided into categories of less than 100 heads, 101-200 heads, 201-300 heads, and greater than 301 heads.
Results showed that MSY increased when the scale increased. Piggery type was divided into categories of partial windowless, all windowless, and all ventilating.
MSY increased when the type was all ventilating.
The percentage of all ventilating and all windowless for each piggery building year was 10% ventilating and 5.9% windowless before 1985, 70% ventilating and 23.5% windowless from 1985 to 1996, 20% ventilating and 29.4% windowless from 1996 to 2005, and only windowless type and 19.9 heads for MSY after 2005.
These results showed that piggery type is relevant to MSY.
Classification Standard Frequency (Number)
Percentage (%)
MSY (Head) Number of
raised heads on sow
< 100 heads 13 23.6 17.7
101-200 heads 21 38.2 17.5
201-300 heads 9 16.4 18.5
> 301 heads 12 21.8 19.8
Piggery type
All windowless 15 27.3 18.2
Partial windowless 25 45.5 18.7
All ventilating 15 27.3 17.4
Piggery building year
Before 1985 3 5.5 18.2
1985-1996 26 47.3 17.7
1996-2005 9 16.4 17.8
After 2005 9 16.4 19.9
No answer 8 14.5 18.5
Table 2. MSY according to classifications of number of raised heads on sow and piggery type
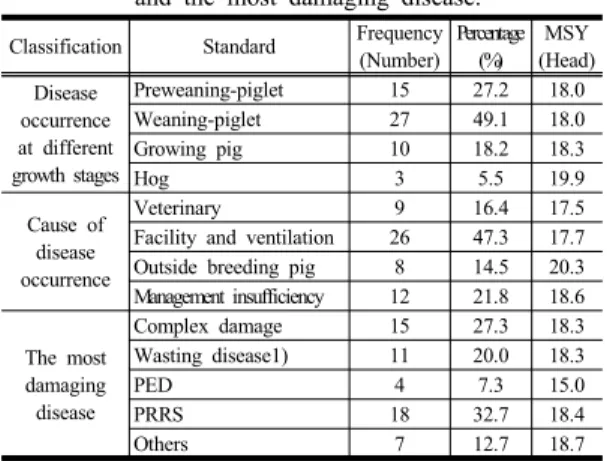
3.1.2 Factors affecting MSY according to disease occurrence at different growth stages and recognition of cause Table 3 shows MSY according to disease occurrence at different growth stages and recognition of cause.
MSY was divided into categories for disease occurrence at different growth stages, cause of disease, and the most damaging disease.
Disease occurrence at different growth stages mostly occurred in preweaning-piglets and weaning-piglets and was a primary cause for decreasing productivity, where MSY was low at 18 heads. However, MSY was high at 19.9 heads for the farms where they answered that disease occurred in hogs.
The most damaging disease showed 32.7% as the highest with Porcine Reproductive and Respiratory Syndrome, 27.3% with complex damage, 20% with wasting disease, and 7.3% with porcine epidemic diarrhea. PED was the most fatal factor that decreased MSY even though the percentage was the lowest.
PED provides difficulty in obtaining a secure income because it is the main reason for weaning-piglet death. Therefore, managers need to disrupt the paths for spreading from outside by weekly unit, all-in/all-out. Winter veterinary care is also very important because PED is resilient at low temperatures (Lee et al., 2011).
Classification Standard Frequency (Number)
Percentage (%)
MSY (Head) Disease
occurrence at different growth stages
Preweaning-piglet 15 27.2 18.0
Weaning-piglet 27 49.1 18.0
Growing pig 10 18.2 18.3
Hog 3 5.5 19.9
Cause of disease occurrence
Veterinary 9 16.4 17.5
Facility and ventilation 26 47.3 17.7 Outside breeding pig 8 14.5 20.3 Management insufficiency 12 21.8 18.6
The most damaging disease
Complex damage 15 27.3 18.3
Wasting disease1) 11 20.0 18.3
PED 4 7.3 15.0
PRRS 18 32.7 18.4
Others 7 12.7 18.7
1) Wasting disease: wasting disease except PED and PRRS Table 3. MSY according to disease occurrence at
different growth stages, cause of disease, and the most damaging disease.
3.1.3 MSY according to management record control and education, and information acquisition
Table 4 shows the research result of MSY according to management record control and information acquisition. MSY results showed big differences depending on management record control. 20.6 heads for MSY was the highest result because the percentage of computational management using computers was 21.8%. However, 15.7 heads for MSY was the lowest with 9.1% with no records. Written-note management was 43.6%, which was highest, and with 17.5 heads for MSY.
Category percentages for information acquisition route were 26.8% for feed company, 25.9% for consultant, and 19.6% for newspaper and magazine.
Both newspaper and magazine and internet had high results. MSY was the highest at 18.7 heads when they acquired the information using the Newspaper and magazine.
Top ranking MSY farms predicted that the MSY of farms is high when education participation is low because top ranking farms want to attend only necessary classes due to their long-term experience and knowledge in the hog industry. They do not want to attend classes that are too difficult and when they already have all the information and knowledge they need (Kang et al., 2011).
Classification Standard Frequency (Number)
Percentage (%)
MSY (Head)
Management record control
computational management using computers
12 21.8 20.6
Written-note management 24 43.6 17.5
Note and computer 14 25.5 18.7
No record 5 9.1 15.7
Information acquisition
route
Feed company 30 26.8 18.0
Consultant 29 25.9 18.1
Livestock related research institute (Agriculture technology center)
15 13.4 16.3
Newspaper and
magazine 22 19.6 18.7
Internet 10 8.9 18.3
Others 6 5.4 17.7
Table 4. MSY according to management record control and education, and information acquisition
3.2 Synthesis regression analysis of MSY factor between groups
The factor research and analysis results that affect the MSY of hog farms are shown in Table 5. Factor analysis measured the individual propensity of 22 items that affect MSY. The research used principal component analysis and the rotation component matrix to reduce factor numbers, to prevent information loss, and to find factors that hinder the validity of measurements. It used the Varimax method, which is normalized in Kaiser, to do clear factor classification of variables.
The factor analysis results for MSY gave the same quality factors into 4 groups (11 items). <Group 1>
showed disconnect the male-to-female breeding (0.800), all-in/all-out (0.779), HACCP (0.667), and veterinary and hygienic control (0.661). <Group 2>
showed number of raised heads per pyeong (0.698), thermo-humidity and ventilation control (0.643), pigsty classified breeding based on stage of growth (0.631), and distance between each pigsty (0.616). <Group 3>
showed nursing period (0.867) and weekly control (0.778). <Group 4> showed vaccination (0.889) and suggested wasting disease vaccination as the necessary factor in general.
Classification Component*
1 2 3 4
Group 1
Disconnect the
male-to-female breeding .800 -.006 .249 -.320
All-in/All-out .779 .103 .197 .173
HACCP .667 .382 -.122 .142
Veterinary and hygienic control .661 -.006 -.065 .471
Group 2
Number of raised heads per pyeong .136 .698 .003 -.122 Thermo-humidity and
ventilation control .148 .643 .169 -.165 Pigsty classified breeding
based on stage of growth -.026 .631 -.221 .198 Distance between each pigsty .028 .616 .503 .265
Group 3Nursing period .032 -.071 .867 .076
Weekly control .152 .084 .778 -.184
Group 4 Vaccination .137 -.028 -.014 .889 1) KMO measurement 0.541, the significant ratio of Barlett test
of sphericity 0.000, explained total dispersion 65.672%
Table 5. Classification and analysis results for MSY factors of hog farms
Table 6 shows the results from the regression analysis to find the most important factors for MSY improvement between Groups, which were determined by factor analysis. In the results of the factor analysis,
<Group 4>, which is vaccination, was excluded because it is the only one important factor of the input variables. In the regression analysis result (R2=0.955) between <Group1>, <Group2>, and <Group3>, <Group2>
had more influence on MSY (P<0.01) because it’s un-standardized coefficient was higher at 2.537 compared to 1.705 for <Group1>.
Model
Unstandardized Coefficients
Standardized Coefficients
t Sig.2)
B Std.
Error Beta
1
Group1 1.457 .844 .324 1.727 .090
Group2 2.046 .863 .485 2.369 .022*
Group3 .776 .618 .175 1.255 .215
21) Group1 1.705 .825 .379 2.067 .044*
Group2 2.537 .774 .602 3.278 .002**
1) MSY= β(1.705)X1(Group1)+β(2.537)X2(Group2) 2) * P<0.05, ** P<0.01
Table 6. MSY factor synthesize regression analysis result between Groups
Model
Unstandardized Coefficients
Standardized Coefficients
t Sig.2) B Std.
Error Beta
1
All-in/all-out -.666 .614 -.162 -1.084 .285 disconnect the
male-to-female breeding
.532 .459 .102 1.159 .253
Veterinary and
hygienic control 4.087 .509 1.073 8.030 .000***
HACCP -.129 .452 -.026 -.286 .777
2
All-in/all-out -.705 .592 -.171 -1.191 .240 disconnect the
male-to-female breeding
.497 .438 .096 1.135 .263
Veterinary and
hygienic control 4.051 .488 1.064 8.307 .000***
3
All-in/all-out -.392 .526 -.095 -.746 .459 Veterinary and
hygienic control 4.111 .486 1.080 8.454 .000***
4 Veterinary and
hygienic control1) 3.755 .093 .986 40.182 .000***
1) MSY= β(3.755)X3(Veterinary) 2) *** P<0.001
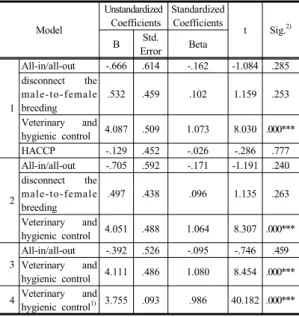
Table 7. MSY factor regression analysis result for Group 1
According to the result of the first regression analysis between groups, the regression analysis was performed again to find out in more detail which variables from <Group1> and <Group2> affect MSY.
In the end, veterinary and hygienic control had the greatest effect (3.755, P<0.001) after putting all-in/all-out, disconnect breeding, veterinary and hygienic control, and HACCP as variables, and then excluding HACCP (-0.129), disconnect breeding (0.497), and all-in/all-out (-0.392) in this order using the regression analysis (backward elimination method) result for MSY as the dependent variable.
Model
Unstandardized Coefficients
Standardized Coefficients
t Sig.2) B Std.
Error Beta
1
Pigsty classified breeding based on stage of growth
2.082 .948 .516 2.196 .034*
Distance between
each pigsty -.549 .812 -.114 -.676 .503 Thermo-humidity
and ventilation control
1.304 1.060 .323 1.230 .225
Number of raised
heads per pyeong 1.079 .957 .257 1.128 .266
2
Pigsty classified breeding based on stage of growth
2.027 .939 .503 2.159 .036*
Thermo-humidity and ventilation control
1.044 .981 .259 1.064 .293
Number of raised
heads per pyeong .933 .926 .222 1.008 .319
31)
Pigsty classified breeding based on stage of growth
2.425 .852 .602 2.847 .007*
* Thermo-humidity
and ventilation control
1.535 .852 .381 1.803 .078
1) MSY= β(2.425)X1(Classified breeding)+β (1.535)X3(Thermohumidityandventilationcontrol) 2) * P<0.05, ** P<0.01
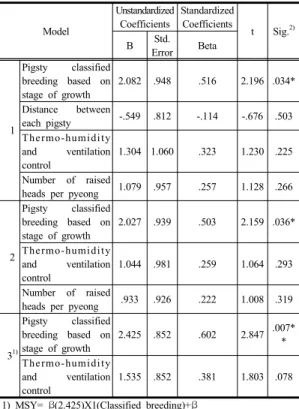
Table 8. MSY factor regression analysis result for Group 2
In <Group 2>, pigsty classified breeding based on stage of growth, distance between each pigsty, thermo-humidity and ventilation control, and number of raised heads per pyeong were added, and then according to the regression analysis result (R2=0.958)
for MSY as adependent variable, the distance between each pigsty(-0.549) and the number of raised heads per pyeong(0.933) were excluded in this order. Pigsty classified breeding based on stage of growth (2.425) and thermo-humidity and ventilation control (1.535) were the best ones; however pigsty classified breeding based on stage of growth (P<0.01) affected MSY more than thermo-humidity and ventilation control.
4. Conclusion
This research analyzed variables that affect MSY, which is the main index for hog productivity, according to management ability and ethic and the important propensity of hog management categories.
Study subjects included 55 hog farms, where the average age was 52 years and the average number of raised head on sow was 298 heads. This study researched MSY grade according to standards by dividing the management ability and ethic into 8 categories. Also, it performed factor analysis and regression analysis using MSY as the dependent variable by measuring the importance of factors from the hog management checklist (22 in total) using 5 indices.
MSY got the highest result when the number of raised heads on sow (standard above 301 heads;
MSY=19.8 heads) is high and piggery type is all and partial windowless (18.7 heads). The weaning-piglet stage (18.0 heads) in disease occurrence at different growth stages, veterinary (17.5 head) in cause of disease occurrence, and PED (15.0 head) in the most damaged disease are factors that decrease MSY. The management record got the best result when computational management using computers (20.6 heads) was used, and information acquisition route got the best grade when newspaper and magazine (18.7 heads) and internet (18.3 heads) were used.
According to the analysis results using the hog management checklist (22 items), this study found that the 4 groups (11 items) have the same quality factors.
<Group 4> of the other groups appeared as the necessary factor because it only included the wasting disease vaccination (P<0.01).
In the results of the regression analysis to find the most important factors for improving MSY between groups, in <Group 2> (P<0.01), the number of raised heads per pyeong, thermo-humidity and ventilation control, pigsty classified breeding based on stage of growth, and distance between each pigsty had statistically significant effects. Within these, the most important factors were pigsty classified breeding based on stage of growth (P<0.01), and then thermo-humidity and ventilation control. Also, the most important factor in <Group 1> was veterinary and hygienic control (P<0.01).
Management suggestions for each detailed item provides assistance for improving the productivity of hog farms and also can be used as data to suggest business management measures for improving the productivity of the hog industry. However, establishing individual management strategies and productivity improvement methods will vary according to differences in breeding environment of the individual hog farms, and must comprise the firm and individual will of farm managers.
This study’s results are based on collected information on the management condition and conscious research of hog farms. Its goal is to give necessary data for establishing the business management measure of each detailed factor. However, this research needs to continue to investigate the correlation between variables because there are other variables that affect the hog industry besides those used in this study.
References
[1] J. K. Lee, W. I. Song, K. M. Chang. 2011, A study on productivity improvement of swine farms using information of slaughter-hog disease check-up. J. Agri.
Management and Policy. 38:1032-1049
[2] S. E. Kim. 2006. The effect of consulting on productivity in pig farms. J. Agri. Management and Policy. 33:777-788
[3] G. C. Song, B. W. Yang, G. S. Hwang, H. K. Jung.
Effect on increase of productivity and technology acceptability in swine farming. J. Agri. Management and Policy. 29:492-505
[4] C. J. Yu. Research on evaluating the management ability of hog farmers. J. Agri. Management and Policy. 32:1-15 [5] H. S. Shin, J. B. Lee, Y.P. Jung, J. I. Lee. A case study
of management efficiency on hog farm. J. Agri.
Management and Policy. 36:664-690
[6] J. E. Roh. 2012. Analysis on the relative importance of factors influencing the managerial effectivity of pork industry. A master’s thesis. Konkuk university
[7] Ministry of Agriculture, Food and Rural Affairs, 2012.
Agricultural and livestock production cost survey.
http://www.mafra.go.kr
[8] Korea Pork Producers Association, 2012. National pig farm’s management survey. http://www.koreapork.or.kr
Hyun-ho Choi [Regular member]
•Feb. 2007 : Hankyoung Univ., abachelorofagriculture, MS
•Feb. 2010 : Hankyoung Univ., agricultural economics, PhD
•Mar. 2012 ∼ current : Sanhak LtD., Engineer
•Feb. 2005 ∼ current : National Institute of Animal Science, Researcher
<Research Interests>
Livestock Management, economics
Jeong-Seop Shin [Regular member]
•Aug. 2012 : Chung-Ang Univ., Industrial Economics, MS
•Mar. 2012 ∼ current : National Institute of Animal Science, Researcher
<Research Interests>
Information, food, safety
Dong-Kyun Suh [Regular member]
•Feb. 1992 : ChonbukUniv., Agricultural Economics, Phd.
•Jan. 2012 ∼ current : National Institute of Animal Science, Researcher
<Research Interests>
Technology Assessment
Dong-Won Cheon [Regular member]
•Mar. 1991 ∼ Jul. 2005 : Rural Development Administration, Researcher
•Feb. 2005 : Konkuk Univ., Agriculture Economics, Ph.D
•Mar. 2005 ∼ May. 2008 : Subtropical Livestock Research Institute, Senior Researcher
•May. 2008 ∼ current : National Institute of Animal Science, Senior Researcher
<Research Interests>
Information, food, economy