D I A B E T E S & M E T A B O L I S M J O U R N A L D I A B E T E S & M E T A B O L I S M J O U R N A L
This is an Open Access article distributed under the terms of the Creative Commons Attribution Non-Commercial License (https://creativecommons.org/licenses/by-nc/4.0/) which permits unrestricted non-commercial use, distribution, and reproduction in any medium, provided the original work is properly cited.
Enhancer-Gene Interaction Analyses Identified the Epidermal Growth Factor Receptor as a Susceptibility Gene for Type 2 Diabetes Mellitus
Yang Yang1,2,*, Shi Yao3,*, Jing-Miao Ding3, Wei Chen1, Yan Guo3
1Clinical Laboratory, The First Affiliated Hospital, Xi’an Jiaotong University, Xi’an,
2Xi’an Center for Disease Control and Prevention, Xi’an,
3Key Laboratory of Biomedical Information Engineering of Ministry of Education, and Biomedical Informatics & Genomics Center, School of Life Science and Technology, Xi’an Jiaotong University, Xi’an, China
Background: Genetic interactions are known to play an important role in the missing heritability problem for type 2 diabetes mellitus (T2DM). Interactions between enhancers and their target genes play important roles in gene regulation and disease pathogenesis. In the present study, we aimed to identify genetic interactions between enhancers and their target genes associated with T2DM.
Methods: We performed genetic interaction analyses of enhancers and protein-coding genes for T2DM in 2,696 T2DM patients and 3,548 controls of European ancestry. A linear regression model was used to identify single nucleotide polymorphism (SNP) pairs that could affect the expression of the protein-coding genes. Differential expression analyses were used to identify differen- tially expressed susceptibility genes in diabetic and nondiabetic subjects.
Results: We identified one SNP pair, rs4947941×rs7785013, significantly associated with T2DM (combined P=4.84×10⁻¹⁰). The SNP rs4947941 was annotated as an enhancer, and rs7785013 was located in the epidermal growth factor receptor (EGFR) gene.
This SNP pair was significantly associated with EGFR expression in the pancreas (P=0.033), and the minor allele “A” of rs7785013 decreased EGFR gene expression and the risk of T2DM with an increase in the dosage of “T” of rs4947941. EGFR expression was significantly upregulated in T2DM patients, which was consistent with the effect of rs4947941×rs7785013 on T2DM and EGFR expression. A functional validation study using the Mouse Genome Informatics (MGI) database showed that EGFR was associat- ed with diabetes-relevant phenotypes.
Conclusion: Genetic interaction analyses of enhancers and protein-coding genes suggested that EGFR may be a novel suscepti- bility gene for T2DM.
Keywords: Diabetes mellitus, type 2; Epistasis, genetic; ErbB receptors; Gene regulatory networks
Corresponding authors: Yan Guo https://orcid.org/0000-0002-7364-2392 Key Laboratory of Biomedical Information Engineering of Ministry of Education, and Biomedical Informatics & Genomics Center, School of Life Science and Technology, Xi’an Jiaotong University, Xi’an 710049, China
E-mail: [email protected]
Wei Chen https://orcid.org/0000-0002-7499-9836
Clinical Laboratory, The First Affiliated Hospital, Xi’an Jiaotong University, Xi’an 710004, China
E-mail: [email protected]
INTRODUCTION
Type 2 diabetes mellitus (T2DM) is a metabolic disorder char-
acterized by insulin resistance and hyperglycemia. There is compelling evidence that genetic factors have a strong influ- ence on the risk of T2DM [1]. Over the last decade, catalyzed https://doi.org/10.4093/dmj.2019.0204
pISSN 2233-6079 · eISSN 2233-6087
by the ability to perform genome-wide association studies (GWASs) with ever larger samples, more than 400 robust sus- ceptibility variants for T2DM have been identified [2-5], to- gether with associated credible sets. The majority of these stud- ies searched for simple additive, cumulative, and independent effects, primarily based on single-locus analyses. The joint ef- fect of identified variants explains approximately 10% of ob- served T2DM heritability [5,6].
Multiple hypotheses have been put forward to explain the well-known “missing heritability” problem, which refers to a phenomenon whereby single genetic variations cannot ac- count for much of the heritability of phenotypes. These include epigenetics, rarer variants with larger effects, and limitations of GWASs [7]. Genetic interactions can affect heritability calcula- tions, and lack of knowledge of genetic interactions is believed to be an important cause of the missing heritability [8]. Studies have identified several epistatic mechanisms at the onset of T2DM. For instance, interactions among RAS-related genes were associated with T2DM susceptibility in a Chinese popu- lation, although the main effects of the individual loci may not be observed [9]. However, interaction analyses using single nucleotide polymorphisms (SNPs) in the whole genome usu- ally suffer from the problem of very stringent significance [10].
To solve this problem, the majority of previous hypothesis- driven studies have restricted the search for interactions on the basis of existing biological knowledge, such as candidate genes and protein–protein interactions, or statistical features, such as marginal effects and known GWAS hits [10]. However, focus- ing only on interactions of SNPs with known associated loci or candidate genes may miss SNP interactions that expose no as- sociation individually but in combination contribute to disease susceptibility [11]. Therefore, it is important to solve the low power of the genome-wide epistasis analyses problem with a method that does not depend on known related loci.
A major goal in human genetics research is to understand genetic contributions to complex diseases, specifically the mo- lecular mechanisms by which common DNA variants influ- ence disease etiology. The functional relevance of most discov- ered loci, including those that have been the most reproducibly associated, remains unclear. Readily available data from the Encyclopedia of DNA Elements (ENCODE) [12] and the Roadmap Epigenomics Project [13] have made it possible to investigate regulatory elements in noncoding regions. A num- ber of studies demonstrated that disease- and trait-associated genetic variants were enriched in regulatory elements, mostly
enhancers [14]. Distant enhancers located at considerable ge- nomic distances from gene promoters can be brought into close spatial proximity through specific chromosomal interac- tions, which are essential for the control of spatiotemporal gene expression [15]. Direct interactions between enhancers and promoters are central to dominant models of enhancer function [15]. In strong support of these models, the interac- tion between enhancers and their target genes can induce gene transcription, even in the absence of a key transcriptional acti- vator [16]. Considering the important roles of enhancers in ge- netic predisposition to diseases, analyzing genomic interac- tions between genes and surrounding enhancers is a great knowledge-based method to solve the low power of the ge- nome-wide epistasis analysis problem.
In this study, we performed genetic interaction analyses of protein-coding genes and surrounding enhancers to identify variations that may play a role in the risk of T2DM. By consid- ering statistically interacting SNPs, we identified a novel sus- ceptibility gene, the epidermal growth factor receptor (EGFR), for T2DM. Our results provide new insights into the genetic architecture of T2DM.
METHODS
Subjects
The basic characteristics of the samples used in this project are presented in Table 1. The discovery data were obtained from the Gene Environment Association Studies (GENEVA [17], http://www.genevastudy.org/). We used a subset of GENEVA data on diabetic and nondiabetic subjects from a case-control study of T2DM nested within cohorts of the Nurses’ Health Study (https://www.nurseshealthstudy.org) and the Health Professionals’ Follow-up Study (https://sites.sph.harvard.edu/
hpfs/), two well-characterized cohort studies, which include stored blood and DNA samples, as well as detailed information on dietary and lifestyle variables of the participants. The sam- ples were genotyped using the Affymetrix Genome-Wide Hu- man SNP Array 6.0 (Thermo Fisher Scientific, Waltham, MA, USA).
All the subjects in this study were reported to be of Europe- an ancestry. After selection, 2,558 diabetic and 2,983 nondia- betic subjects were available for analyses (dbGaP: phs000091.
v2.p1). A replication sample was derived from the Biobank Program of the Institute of Personalized Medicine (IPM) at Mount Sinai Medical Center. The primary sample consisted of
2,867 self-identified African-Americans, European-Ameri- cans, and Hispanics. The samples were genotyped using the Affymetrix 6.0 chip. All the individuals included in the replica- tion study were reported to be of European ancestry. After se- lection, 138 diabetic and 565 nondiabetic subjects were avail- able for analyses (dbGaP: phs000388.v1.p1).
Acquisition of SNP pairs and SNP pruning
SNP pairs were selected between the protein-coding genes and enhancers around each gene. We used gene annotations from GENCODEv19 (https://www.gencodegenes.org). Only genes annotated from chromosome 1–22 were used, which resulted in a total of 19,430 coding genes. The SNPs of the protein-cod- ing genes were limited to SNPs within 2 kb regions around the genes. Enhancers were identified by the presence of active epi- genetic histone modifications, such as H3K4me1, H3K4me3, and H3K27ac. To annotate the enhancer regions, we used pub- licly available ChIP-seq datasets on pancreatic islets from the Roadmap Project (http://www.roadmapepigenomics.org/).
Enhancer regions located within 2 kb of the transcription start sites of the protein-coding genes were removed. The SNPs in- tersected with at least one broad peak of H3K4me1, H3K4me3, and H3K27ac in pancreatic islets annotated as enhancers. En- hancers were further assigned to genes within 250 kb of the gene.
We filtered individuals in the discovery and replication data by an initial scan of individual relatedness. We estimated the genetic relationship matrix of all individuals from all the auto- somal SNPs in the GENEVA and IPM data separately, using a tool for genome-wide complex trait analysis [18] and excluded one of each pair of individuals with an estimated genetic rela- tionship of more than 0.025. Using this approach, 633 and 117 individuals were removed from the GENEVA and IPM datas- ets, respectively, to achieve unrelatedness. Quality control in the discovery data was then performed using the whole ge-
nome association analysis toolset, PLINK [19], according to the following criteria: individual missing rate <5%, SNP call rate >99%, minor allele frequency (MAF) >5%, and Hardy- Weinberg equilibrium P>0.001. A pruned subset of SNPs was further generated using 0.6 (r2) as the pairwise linkage disequi- librium (LD) threshold.
SNP×SNP interaction analyses
For each protein-coding gene, we first carried out interaction analyses of the SNPs of the gene and SNPs of the surrounding enhancers in the discovery sample. After SNP quality control and LD-based SNP pruning, 13,642 protein-coding genes with usable SNPs were used in the analysis. Finally, 1,576,465 SNP pairs of protein-coding genes and surrounding enhancers were included in the interaction analyses. The number of enhancers of protein-coding genes ranged from 1 to 99. We then per- formed SNP×SNP interaction analyses in PLINK for the se- lected SNP pairs in the discovery dataset, which fits a logistic regression model in the following equation: Y=β0+β1×SNP1+ β2×SNP2+β3×SNP1×SNP2+β4×Cov1+ … +βn+3×Covn+e.
The odds ratios (ORs) for the interaction were represented by the term exp(β3). Sex, age, and the first 10 principal compo- nents were used as potential covariates in the interaction anal- yses. The principal components were measured using genome- wide complex trait analysis software [18]. To test for associa- tions in the replication samples, we selected SNP pairs signifi- cantly associated with T2DM (P<5×10⁻⁵).
As any imbalance between the number of diabetic and non- diabetic subjects in the replication data would affect the results, we used boosting corrections to deal with the imbalance in the replication dataset in accordance with the method of Bosco [20]. First, we divided the nondiabetic group into five overlap- ping subgroups, each of which was the same size as the diabetic group. We then combined each nondiabetic subgroup with the diabetic group to form a balanced pair and selected a set of Table 1. Basic characteristics of subjects
Characteristic Discovery GENEVA Replication IPM
Case Control Total Case Control Total
Sample size 2,558 2,983 5,541 138 565 703
Male/Female 1,109/1,449 1,275/1,708 2,384/3,157 101/37 370/195 471/232
Age, yr 57.36±7.71 57.12±7.66 57.23±7.69 58.71±15.32 64.83±10.31 59.91±14.67
Values are presented as mean±standard deviation.
GENEVA, Gene Environment Association Studies initiative in Type 2 Diabetes; IPM, Biobank Program of the Institute of Personalized Medi- cine.
phenotype-associated SNPs (P<0.01), which were considered dominant SNPs for simplicity. We assigned each subgroup confidence scores according to the frequencies of dominant loci and obtained each sample’s confidence score by averaging the confidence scores of all the subgroups where it appeared.
Finally, we normalized the confidence score of the sample and performed weighted logistic regression.
We used METAL software [21] to combine the results of the SNP×SNP analyses from the different populations using a sample-size weighted model. After adjusting for multiple com- parisons by the Bonferroni correction, the significance thresh- old was set at P<3.17×10⁻⁸ (0.05/1,576,465). We also conduct- ed genetic association analyses of the identified SNPs and T2DM in two samples using the same covariate adjustments as in the epistasis analyses to check whether the individual SNPs involved main effects.
Functional annotation
We further annotated the regions surrounding identified SNP pairs using Hi-C interaction data and topologically associating domain (TAD) data. The Hi-C interaction data in multiple available cell lines were downloaded from the 4DGenome Da- tabase [22]. TADs in the GM12878 cell line were downloaded from the Gene Expression Omnibus (GEO) data GSE63525 (https://www.ncbi.nlm.nih.gov/geo/query/acc.cgi?acc=
GSE63525) [23], and the DNA sequences physically interacted with each other more frequently within a TAD [24-26]. To check whether the identified SNPs pairs were located in the same TAD-like domain in human pancreatic islets [27], we used TAD-like domains identified using promoter capture Hi-C in pancreatic islets via a directionality index score [25].
Differential expression analyses
We examined whether the interaction effect of the identified SNP pairs affected the expression of their target genes using a linear regression model and data on the expression levels of target genes in pancreas samples from subjects in the GTEx Pi- lot Project [28].
To check whether the identified susceptibility genes were differentially expressed in diabetic and nondiabetic subjects, we used four GEO datasets, GSE76894, GSE25724, GSE12643, and GSE9006. GSE76894 included the gene expression profiles of 84 nondiabetic and 19 T2DM islets isolated from pancreases unsuitable for transplantation [29]. The organ donors were ob- tained in Pisa with the approval of the local ethics committees.
We then performed a microarray analysis of the GSE25724 da- taset to evaluate differences in the transcriptomes of the T2DM and nondiabetic human islet samples. Human islets were iso- lated from seven nondiabetic and six T2DM organ donors by collagenase digestion, followed by density gradient purification [30]. In the GSE12643 dataset, transcript levels in myotubes from 10 obese patients with T2DM and 10 healthy control sub- jects matched according to age and body mass index were ex- amined [31]. In the GSE9006 dataset, to evaluate differences in the transcriptome, gene expression profiles of peripheral blood mononuclear cells from 24 healthy volunteers, 43 newly diag- nosed type 1 diabetes mellitus patients, and 12 newly diag- nosed T2DM patients were analyzed [32]. Only gene expres- sion profiles from healthy and T2DM subjects were included in the study. In each GEO dataset, we performed differential expression analyses of the identified susceptibility genes using publicly available preprocessed series matrix files.
RESULTS
SNP×SNP interaction analyses
We first carried out interaction analyses of the discovery sam- ple and selected the top 65 SNP pairs significantly associated with T2DM (P<5×10⁻⁵) to test for associations in the replica- tion sample (Supplementary Table 1) [33]. Combining the re- sults from the two datasets, only one SNP pair, rs4947941×
rs7785013, was significantly associated with T2DM after mul- tiple testing corrections (combined P=4.84×10⁻¹⁰) (Table 2).
Rs4947941 and rs7785013 were in relatively low LD with each other, with an r2 of 0.011 and 0.005 in GENEVA and IPM, re- spectively. The directions of the effect of this SNP pair were congruent in the two datasets. The interaction OR was esti- mated to be 0.91 (95% confidence interval [CI], 0.88 to 0.95) in the discovery data and 0.78 (95% CI, 0.70 to 0.86) in the repli- cation data. This indicated that the effect of the minor allele of SNP rs4947941 (T-allele, MAFGENEVA=0.443, MAFIPM=0.424) decreased 0.91-fold (interaction OR value) and 0.78-fold in T2DM patients for each copy of the minor allele of rs7785013 (A-allele, MAFGENEVA=0.158, MAFIPM=0.137). However, the single SNP association analysis of these two SNPs revealed no significant association in either sample (P>0.05) (Table 2).
Next, we checked whether the effect of the minor allele “A” of rs7785013 on T2DM differed among individuals carrying dif- ferent genotypes of rs4947941 using the ORs. As shown in Fig.
1, in the GENEVA dataset, the minor allele “A” of rs7785013
was increased 1.10-fold in T2DM subjects carrying “CC” of rs4947941 and decreased 0.99-fold and 0.93-fold in T2DM subjects carrying “TC” and “TT” of rs4947941, respectively.
Consistent with these findings, in the replication data derived from the IPM, the minor allele “A” of rs7785013 was increased 1.30-fold in T2DM subjects carrying “CC” of rs4947941 and decreased 0.97-fold and 0.81-fold in T2DM subjects carrying
“TC” and “TT” of rs4947941, respectively. Therefore, the mi- nor allele “A” of rs7785013 reduced the risk of T2DM with an increase in the dosage of “T” of rs4947941.
Functional annotation
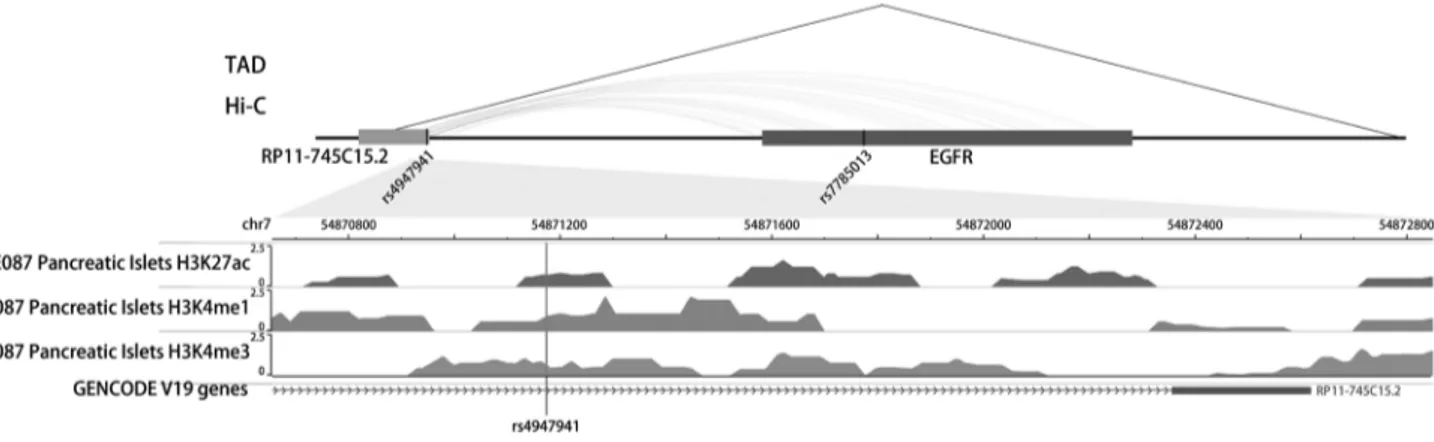
The SNP rs4947941 was located in RP11-745C15.2 and over- lapped with many enhancer marks, including H3k4me1, H3k- 4me3, and H3k27ac (Fig. 2). The SNP rs7785013 was located in Table 2. The interaction SNP pairs identified for type 2 diabetes mellitus
SNP pair Chr Positiona Geneb Allelec
GENEVA IPM
Combined P valued
MAF CR OR
(95% CI) P value MAF CR OR
(95% CI) P value rs4947941 7 54871175 RP11-
745C15.2 T/C 0.443 1 1.00
(0.98–1.02) 0.824 0.424 1 0.97
(0.92–1.02) 0.831 0.911 rs7785013 7 55152667 EGFR A/G 0.158 0.999 1.00
(0.98–1.03) 0.830 0.137 0.999 0.98
(0.91–1.05) 0.977 0.998 rs494794
×rs7785013 - - - - - - 0.91
(0.88–0.95) 9.41×10⁻⁷ - - 0.78
(0.70–0.86) 1.73×10⁻⁶ 4.84×10⁻¹⁰ SNP, single nucleotide polymorphism; Chr, chromosome; GENEVA, Gene Environment Association Studies initiative in Type 2 Diabetes; IPM, Biobank Program of the Institute of Personalized Medicine; MAF, minor allele frequency; CR, call rate; OR, odds ratio; CI, confidence interval;
EGFR, epidermal growth factor receptor.
aPosition was relative to the hg19 version of the human genome, bThe physical location of identified SNP, cThe former allele represents the minor allele, dMeta-analyses results by using two genome-wide association study samples.
the intron region of the protein-coding EGFR. The published Hi-C datasets showed that the rs4947941 frequently interacted with the EGFR. Thus, the region surrounding rs4947941 tend- ed to be closer in space to the EGFR (Fig. 2). The TAD annota- tion results showed that these two SNPs were located in the same TAD region in the GM12878 cell line (Chr7: 54830000- 55330000) (Fig. 2) and TAD-like domain in human pancreatic islets (Chr7: 54824893-55497476).
Differential expression analyses
Analyses of the interaction effect of rs4947941×rs7785013 on EGFR expression showed that this SNP pair was significantly associated with EGFR expression in the pancreas (P=0.033).
As shown in Fig. 3, the minor allele “A” of rs7785013 was posi- tively associated with the EGFR expression in subjects carrying Fig. 1. Association of the minor allele “A” of rs7785013 with type 2 diabetes mellitus in subjects carrying different genotypes of rs4947941 in the Gene Environment Association Studies (GENEVA) and Institute of Personalized Medicine (IPM) datasets. The odds ratios (ORs) of the association analyses results are shown in the y-axis. TT, subjects carrying “TT” of rs4947941; TC, sub- jects carrying “TC” of rs4947941; CC, subjects carrying “CC” of rs4947941.
1.3 1.2 1.1 1.0 0.9 0.8
OR for the minor allele A of rs7785013
(n=1,095)TT TC (n=2,724) rs4947941 GENEVA
(n=1,722)CC TT
(n=134) TC
(n=328) rs4947941
IPM
(n=241)CC
“CC” and “TC” of rs4947941 but negatively associated with EGFR expression in subjects carrying “TT” of rs4947941.
Therefore, the minor allele “A” of rs7785013 decreased the gene expression of the EGFR with an increasing dosage of “T” of rs4947941.
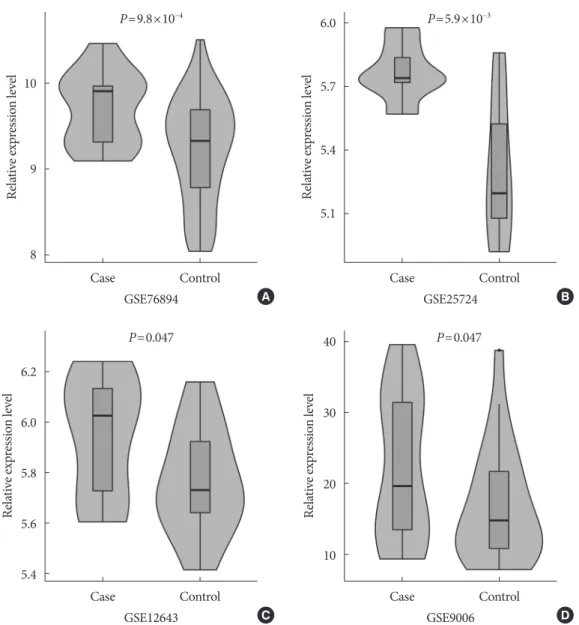
In a one-tailed t-test, we examined whether the EGFR was differentially expressed in diabetic and nondiabetic subjects in the four GEO datasets. The results showed that EGFR was sig- nificantly up-regulated in diabetic samples in GSE76894
(P=9.8×10⁻⁴) (Fig. 4A), GSE25724 (P=5.9×10⁻³) (Fig. 4B), GSE12643 (P=0.047) (Fig. 4C), and GSE9006 (P=0.047) (Fig.
4D). It is worth noting that these results were consistent with the effect of the SNP interaction on T2DM and EGFR expression.
Functional validation in the Mouse Genome Informatics database
To investigate the function of the EGFR, we used the Mouse Ge- nome Informatics (MGI) database [34-36], which contains inte- grated genetic, genomic, and biological data aimed at facilitating the study of human health and disease. The results revealed that the EGFR was involved in multiple phenotypes associated with T2DM, including disorganized pancreatic islets, abnormal pan- creatic beta cell morphology, abnormal pancreas morphology, and a small pancreas in murine models (http://www.informat- ics.jax.org/marker/phenotypes/MGI:95294) [37].
DISCUSSION
As noted earlier, multiple hypotheses have been put forward to explain the well-known “missing heritability” problem. Epi- genetics and rarer variants with larger effects are among the reasons advanced to explain the limitations of GWASs [7]. In the previous studies, we reported a method that integrating epigenetic features for predicting SNPs associated with T2DM and other complex disorders [38,39]. In this study, considering the important role of the interaction between an enhancer and Fig. 2. Epigenetic annotation for the region surrounding rs4947941 and rs7785013. The topologically associating domain (TAD) data in the GM12878 cell line were downloaded from the Gene Expression Omnibus (GEO) data, GSE63525. TAD-like domains were identified using promoter capture Hi-C in human pancreatic islets. Chromatin interaction data in multiple cell lines were downloaded from the 4DGenome Database. Active histone modifications, including H3k4me1, H3k4me3, and H3k27ac, in pan- creatic islets were obtained from the Roadmap Project using the WashU EpiGenome Browser. EGFR, epidermal growth factor re- ceptor.
Fig. 3. Association of the minor allele “A” of rs7785013 with the expression of the epidermal growth factor receptor (EGFR) in the pancreas of subjects carrying different genotypes of rs4947941 in the GTEx Pilot Project. The beta values of the as- sociation analyses results are shown in the y-axis. CC, subjects carrying “CC” of rs4947941; TC, subjects carrying “TC” of rs4947941; TT, subjects carrying “TT” of rs4947941.
0.3 0.2 0.1 0
−0.1 Effect for the minor allele A of rs7785013 −0.2
(n=62)CC TC (n=85) rs4947941
P=0.033
(n=32)TT
its target gene in gene regulation and disease pathogenesis, we performed genetic interaction analyses of variants between en- hancers and protein-coding genes to identify susceptibility loci associated with T2DM.
We identified one significant interaction pair, rs4947941×
rs7785013, which was associated with T2DM after multiple testing corrections. Previous GWASs have not reported the re- lationships between these two SNPs and T2DM or other disor- ders. In the present study, rs4947941 overlapped with many enhancer marks, and rs7785013 was located in the intron re- gion of the EGFR. The annotation results showed that these two SNPs were located in the same TAD region. Furthermore,
the region surrounding rs4947941 tended to be closer in space to the EGFR. Thus, the EGFR may serve as a susceptibility gene for T2DM.
The EGFR encodes a type of transmembrane glycoprotein, which is a member of the protein kinase superfamily. Prior to the GWAS catalog [40], no previous GWASs reported the rela- tionship between EGFR polymorphisms and T2DM. In the present study, we detected associations between all EGFR poly- morphisms and T2DM in two GWAS datasets, and no signifi- cant association results were obtained after multiple testing corrections (Supplementary Table 2) [33]. A previous study re- vealed that inhibition of EGFR tyrosine kinase activity amelio- 10
9
8
6.2 6.0 5.8 5.6 5.4
6.0
5.7
5.4
5.1
40
30
20
10
Relative expression levelRelative expression level Relative expression levelRelative expression level
Case
Case
Case
Case Control
Control
Control
Control P=9.8×10⁻⁴
P=0.047
P=5.9×10⁻³
P=0.047 GSE76894
GSE12643
GSE25724
GSE9006
Fig. 4. The results of the differential expression analyses of the epidermal growth factor receptor (EGFR) in diabetic and nondia- betic subjects in the (A) GSE76894, (B) GSE25724, (C) GSE12643, and (D) GSE9006 datasets.
A
C
B
D
rated insulin resistance [41]. In the present study, differential expression analyses using four GEO datasets confirmed that EGFR may be a novel gene for the risk of T2DM. Furthermore, the EGFR was significantly up-regulated in diabetic samples.
In parallel with our study, recent research integrated epig- enomics and TAD data and discovered T2DM-associated en- hancer-promoter SNP pairs from imputed data where neither SNP achieved independent genome-wide significance [42].
Manduchi et al. [42] reported that one enhancer-promoter SNP pair, rs7991210-rs3742250, was significantly associated with T2DM in pancreatic islets after main effect filtering (com- bined P=2.16×10⁻⁹). In our data, we attempted to validate this epistasis effect of the SNP pair, rs7991210-rs3742250. As the promoter SNP, rs3742250, was not included in the discovery data, we used two other SNPs that were in LD with rs3742250 (D’>0.75) as surrogates using Phase 3 data from the 1000 Ge- nomes project as a reference panel [43]. Combining the results of the two datasets, we found that these two SNP pairs were significantly associated with T2DM (P<0.05) (Supplementary Table 3) [33]. In addition, our approach did not restrict the analysis to the promoter region of the gene. Lee et al. [44] de- tected dynamic enhancer contacts throughout the gene bodies that tracked with elongating RNA polymerase II and the lead- ing edge of RNA synthesis. Thus, we considered all enhancer- gene interactions, an approach that could yield more interest- ing results.
Some limitations of the current study should be addressed.
The genetic susceptibility and etiology of T2DM may differ among populations of distinct ancestral origin. In the present study, most of the genotype data in the dbGaP database were based on Europeans, and only subjects who reported European ancestry were included in the epistasis analyses. Further stud- ies are recommended to investigate the association between the rs4947941–rs7785013 interaction and T2DM in different ethnic groups. The sample size may be an additional limitation.
We identified only one significant SNP pair for T2DM after multiple corrections, which was far fewer than we excepted. It is possible that the sample size was not large enough to obtain an accurate estimate. The Bonferroni correction employed to reduce type I errors may have increased the probability of false negatives. Consequently, a further study with a larger sample size is needed to validate our results.
In summary, we performed genetic interaction analyses of enhancers and protein-coding genes for T2DM. We identified one SNP pair, rs4947941×rs7785013, that was significantly as-
sociated with T2DM. Further annotation, differential expres- sion, and functional validation studies suggested that the EGFR may be a susceptibility gene for T2DM.
SUPPLEMENTARY MATERIALS
Supplementary materials related to this article can be found online at https://doi.org/10.4093/dmj.2019.0204.
CONFLICTS OF INTEREST
No potential conflict of interest relevant to this article was re- ported.
AUTHOR CONTRIBUTIONS
Conception or design: Y.Y., S.Y., J.M.D., W.C., Y.G.
Acquisition, analysis, or interpretation of data: S.Y., J.M.D.
Drafting the work or revising: S.Y., Y.G.
Final approval of the manuscript: Y.Y., S.Y., J.M.D., W.C., Y.G.
ORCID
Yang Yang https://orcid.org/0000-0001-5909-4660 Shi Yao https://orcid.org/0000-0002-4574-8106 Yan Guo https://orcid.org/0000-0002-7364-2392 Wei Chen https://orcid.org/0000-0002-7499-9836
FUNDING
This study was supported by the National Natural Science Foundation of China (31871264, 81872490), Innovative Talent Promotion Plan of Shaanxi Province for Young Sci-Tech New Star (2018KJXX-010), Natural Science Foundation of Zhejiang Province (LGF18C060002, LWY20H060001), Major Science and Technology Projects in Xiaoshan District (2018224), Nat- ural Science Basic Research Program Shaanxi Province (2018JQ3058) and the Fundamental Research Fund for Cen- tral Universities. This study was also supported by the High Performance Computing Platform of Xi’an Jiaotong University and the China Scholarship Council.
ACKNOWLEDGMENTS
We acknowledge use of data from the GENEVA consortium
and IPM Biobank Project. In performing the current study, we did not collaborate with the investigators of these projects.
Therefore, our study does not necessarily reflect their opinions.
The datasets were obtained through dbGaP authorized access (accession numbers: phs000091.v2.p1 and phs000388.v1.p1).
REFERENCES
1. Willemsen G, Ward KJ, Bell CG, Christensen K, Bowden J, Dalgard C, et al. The concordance and heritability of type 2 dia- betes in 34,166 twin pairs from international twin registers: the discordant twin (DISCOTWIN) consortium. Twin Res Hum Genet 2015;18:762-71.
2. Scott RA, Scott LJ, Magi R, Marullo L, Gaulton KJ, Kaakinen M, et al. An expanded genome-wide association study of type 2 diabetes in Europeans. Diabetes 2017;66:2888-902.
3. Xue A, Wu Y, Zhu Z, Zhang F, Kemper KE, Zheng Z, et al. Ge- nome-wide association analyses identify 143 risk variants and putative regulatory mechanisms for type 2 diabetes. Nat Com- mun 2018;9:2941.
4. Mahajan A, Taliun D, Thurner M, Robertson NR, Torres JM, Rayner NW, et al. Fine-mapping type 2 diabetes loci to single- variant resolution using high-density imputation and islet-spe- cific epigenome maps. Nat Genet 2018;50:1505-13.
5. Fuchsberger C, Flannick J, Teslovich TM, Mahajan A, Agarwa- la V, Gaulton KJ, et al. The genetic architecture of type 2 diabe- tes. Nature 2016;536:41-7.
6. DIAbetes Genetics Replication And Meta-analysis (DIA- GRAM) Consortium; Asian Genetic Epidemiology Network Type 2 Diabetes (AGEN-T2D) Consortium; South Asian Type 2 Diabetes (SAT2D) Consortium; Mexican American Type 2 Diabetes (MAT2D) Consortium; Type 2 Diabetes Genetic Ex- ploration by Nex-generation sequencing in muylti-Ethnic Sam- ples (T2D-GENES) Consortium, Mahajan A, et al. Genome- wide trans-ancestry meta-analysis provides insight into the ge- netic architecture of type 2 diabetes susceptibility. Nat Genet 2014; 46:234-44.
7. Manolio TA, Collins FS, Cox NJ, Goldstein DB, Hindorff LA, Hunter DJ, et al. Finding the missing heritability of complex diseases. Nature 2009;461:747-53.
8. Zuk O, Hechter E, Sunyaev SR, Lander ES. The mystery of missing heritability: genetic interactions create phantom heri- tability. Proc Natl Acad Sci U S A 2012;109:1193-8.
9. Yang JK, Zhou JB, Xin Z, Zhao L, Yu M, Feng JP, et al. Interac- tions among related genes of renin-angiotensin system associ-
ated with type 2 diabetes. Diabetes Care 2010;33: 2271-3.
10. Wei WH, Hemani G, Haley CS. Detecting epistasis in human complex traits. Nat Rev Genet 2014;15:722-33.
11. Shen J, Li Z, Song Z, Chen J, Shi Y. Genome-wide two-locus in- teraction analysis identifies multiple epistatic SNP pairs that confer risk of prostate cancer: a cross-population study. Int J Cancer 2017;140:2075-84.
12. ENCODE Project Consortium. An integrated encyclopedia of DNA elements in the human genome. Nature 2012;489:57-74.
13. Roadmap Epigenomics Consortium, Kundaje A, Meuleman W, Ernst J, Bilenky M, Yen A, et al. Integrative analysis of 111 ref- erence human epigenomes. Nature 2015;518:317-30.
14. Maurano MT, Humbert R, Rynes E, Thurman RE, Haugen E, Wang H, et al. Systematic localization of common disease-as- sociated variation in regulatory DNA. Science 2012;337:1190- 5.
15. Bulger M, Groudine M. Functional and mechanistic diversity of distal transcription enhancers. Cell 2011;144:327-39.
16. Deng W, Lee J, Wang H, Miller J, Reik A, Gregory PD, et al.
Controlling long-range genomic interactions at a native locus by targeted tethering of a looping factor. Cell 2012; 149:1233- 44.
17. Cornelis MC, Agrawal A, Cole JW, Hansel NN, Barnes KC, Beaty TH, et al. The Gene, Environment Association Studies consortium (GENEVA): maximizing the knowledge obtained from GWAS by collaboration across studies of multiple condi- tions. Genet Epidemiol 2010;34:364-72.
18. Yang J, Lee SH, Goddard ME, Visscher PM. GCTA: a tool for genome-wide complex trait analysis. Am J Hum Genet 2011;
88:76-82.
19. Purcell S, Neale B, Todd-Brown K, Thomas L, Ferreira MA, Bender D, et al. PLINK: a tool set for whole-genome associa- tion and population-based linkage analyses. Am J Hum Genet 2007;81:559-75.
20. Bao F, Deng Y, Zhao Y, Suo J, Dai Q. Bosco: boosting correc- tions for genome-wide association studies with imbalanced samples. IEEE Trans Nanobioscience 2017;16:69-77.
21. Willer CJ, Li Y, Abecasis GR. METAL: fast and efficient meta- analysis of genomewide association scans. Bioinformatics 2010;26:2190-1.
22. Teng L, He B, Wang J, Tan K. 4DGenome: a comprehensive da- tabase of chromatin interactions. Bioinformatics 2015;31:2560- 4.
23. Rao SS, Huntley MH, Durand NC, Stamenova EK, Bochkov ID, Robinson JT, et al. A 3D map of the human genome at kilo-
base resolution reveals principles of chromatin looping. Cell 2014;159: 1665-80.
24. Pombo A, Dillon N. Three-dimensional genome architecture:
players and mechanisms. Nat Rev Mol Cell Biol 2015;16:245- 57.
25. Dixon JR, Selvaraj S, Yue F, Kim A, Li Y, Shen Y, et al. Topologi- cal domains in mammalian genomes identified by analysis of chromatin interactions. Nature 2012;485: 376-80.
26. Nora EP, Lajoie BR, Schulz EG, Giorgetti L, Okamoto I, Ser- vant N, et al. Spatial partitioning of the regulatory landscape of the X-inactivation centre. Nature 2012;485:381-5.
27. Miguel-Escalada I, Bonas-Guarch S, Cebola I, Ponsa-Cobas J, Mendieta-Esteban J, Atla G, et al. Human pancreatic islet three-dimensional chromatin architecture provides insights into the genetics of type 2 diabetes. Nat Genet 2019;51: 1137- 48.
28. GTEx Consortium. Human genomics. The Genotype-Tissue Expression (GTEx) pilot analysis: multitissue gene regulation in humans. Science 2015;348:648-60.
29. Solimena M, Schulte AM, Marselli L, Ehehalt F, Richter D, Kleeberg M, et al. Systems biology of the IMIDIA biobank from organ donors and pancreatectomised patients defines a novel transcriptomic signature of islets from individuals with type 2 diabetes. Diabetologia 2018;61:641-57.
30. Dominguez V, Raimondi C, Somanath S, Bugliani M, Loder MK, Edling CE, et al. Class II phosphoinositide 3-kinase regu- lates exocytosis of insulin granules in pancreatic beta cells. J Biol Chem 2011; 286:4216-25.
31. Frederiksen CM, Hojlund K, Hansen L, Oakeley EJ, Hem- mings B, Abdallah BM, et al. Transcriptional profiling of myo- tubes from patients with type 2 diabetes: no evidence for a pri- mary defect in oxidative phosphorylation genes. Diabetologia 2008;51:2068-77.
32. Kaizer EC, Glaser CL, Chaussabel D, Banchereau J, Pascual V, White PC. Gene expression in peripheral blood mononuclear cells from children with diabetes. J Clin Endocrinol Metab 2007;92:3705-11.
33. Shi Y: Enhancer-gene interaction analyses identified EGFR as a susceptibility gene for type 2 diabetes supplementary files, 2019.
Available from: https://figshare.com/articles/Enhancer-Gene_
Interaction_Analyses_Identified_EGFR_as_a_Susceptibility_
Gene_for_Type_2_Diabetes_Supplementary_Files/ 9757391/1 (cited 2020 May 19).
34. Smith CL, Blake JA, Kadin JA, Richardson JE, Bult CJ; Mouse Genome Database Group. Mouse Genome Database (MGD)- 2018: knowledgebase for the laboratory mouse. Nucleic Acids Res 2018;46:D836-42.
35. Finger JH, Smith CM, Hayamizu TF, McCright IJ, Xu J, Law M, et al. The mouse Gene Expression Database (GXD): 2017 up- date. Nucleic Acids Res 2017;45: D730-6.
36. Bult CJ, Krupke DM, Begley DA, Richardson JE, Neuhauser SB, Sundberg JP, et al. Mouse Tumor Biology (MTB): a data- base of mouse models for human cancer. Nucleic Acids Res 2015;43:D818-24.
37. Miettinen PJ, Huotari M, Koivisto T, Ustinov J, Palgi J, Rasi- lainen S, et al. Impaired migration and delayed differentiation of pancreatic islet cells in mice lacking EGF-receptors. Devel- opment 2000;127:2617-27.
38. Yao S, Guo Y, Dong SS, Hao RH, Chen XF, Chen YX, et al.
Regulatory element-based prediction identifies new suscepti- bility regulatory variants for osteoporosis. Hum Genet 2017;
136:963-74.
39. Dong SS, Guo Y, Yao S, Chen YX, He MN, Zhang YJ, et al. In- tegrating regulatory features data for prediction of functional disease-associated SNPs. Brief Bioinform 2019;20:26-32.
40. Welter D, MacArthur J, Morales J, Burdett T, Hall P, Junkins H, et al. The NHGRI GWAS catalog, a curated resource of SNP- trait associations. Nucleic Acids Res 2014;42:D1001-6.
41. Li Z, Li Y, Overstreet JM, Chung S, Niu A, Fan X, et al. Inhibi- tion of epidermal growth factor receptor activation is associat- ed with improved diabetic nephropathy and insulin resistance in type 2 diabetes. Diabetes 2018;67:1847-57.
42. Manduchi E, Williams SM, Chesi A, Johnson ME, Wells AD, Grant SFA, et al. Leveraging epigenomics and contactomics data to investigate SNP pairs in GWAS. Hum Genet 2018; 137:413- 25.
43. 1000 Genomes Project Consortium, Auton A, Brooks LD, Durbin RM, Garrison EP, Kang HM, et al. A global reference for human genetic variation. Nature 2015;526:68-74.
44. Lee K, Hsiung CC, Huang P, Raj A, Blobel GA. Dynamic en- hancer-gene body contacts during transcription elongation.
Genes Dev 2015;29:1992-7.
Supplementary Table 1. Top 65 associated SNP pairs
SNP1 SNP2 GENEVA IPM Combined
P valuea
OR P value OR P value
rs4947941 rs7785013 0.914 9.41E-07 0.777 1.73E-06 4.84E-10
rs729715 rs797518 1.168 1.37E-06 1.281 2.48E-02 1.15E-07
rs12668947 rs10240204 0.867 2.94E-06 0.848 7.46E-02 5.67E-07
rs17193049 rs11624333 1.140 2.27E-05 1.347 4.49E-03 7.65E-07
rs7108496 rs4298915 0.868 6.96E-07 0.973 6.96E-01 1.54E-06
rs16854403 rs7652606 1.186 1.72E-06 NA NA 1.72E-06
rs17377867 rs2289843 0.852 9.02E-06 0.892 2.25E-01 4.45E-06
rs12481033 rs3843773 1.121 3.91E-05 1.166 4.07E-02 5.10E-06
rs2754820 rs13200680 0.851 1.75E-05 0.857 1.44E-01 5.74E-06
rs2741366 rs6022643 0.875 4.22E-07 1.067 4.63E-01 6.21E-06
rs895394 rs660721 1.064 6.54E-06 NA NA 6.54E-06
rs17193049 rs17828907 1.148 6.66E-06 NA NA 6.66E-06
rs9484785 rs12528289 0.925 3.21E-05 0.917 8.07E-02 6.70E-06
rs4978374 rs2439649 0.937 3.59E-05 0.929 7.72E-02 7.27E-06
rs9676784 rs12608562 1.089 1.69E-05 1.054 2.66E-01 9.60E-06
rs6856354 rs11100039 1.097 2.71E-06 1.001 9.89E-01 9.68E-06
rs1078868 rs619429 0.934 1.25E-05 NA NA 1.25E-05
rs4472929 rs11021956 1.114 2.08E-05 1.101 2.92E-01 1.28E-05
rs2371864 rs2036072 1.075 1.35E-05 NA NA 1.35E-05
rs12554508 rs10974470 1.091 1.42E-05 NA NA 1.42E-05
rs12928191 rs7201173 1.145 4.16E-06 0.995 9.50E-01 1.60E-05
rs13270346 rs17740942 1.099 1.66E-05 NA NA 1.66E-05
rs4376484 rs7015740 0.939 1.72E-05 NA NA 1.72E-05
rs17149180 rs17819187 1.195 2.86E-05 1.102 2.98E-01 1.78E-05
rs7494050 rs12101174 0.897 2.04E-05 NA NA 2.04E-05
rs16875546 rs2281449 1.130 1.00E-05 1.022 7.77E-01 2.08E-05
rs12429883 rs3794376 0.914 2.84E-05 0.945 3.67E-01 2.18E-05
rs658854 rs6134038 0.932 2.43E-05 0.969 4.78E-01 2.50E-05
rs4833421 rs29319 0.914 4.14E-05 0.937 3.06E-01 2.61E-05
rs2684289 rs9283561 1.133 3.01E-05 NA NA 3.01E-05
rs7552202 rs2805452 0.934 3.08E-05 NA NA 3.08E-05
rs12545416 rs6988366 1.069 1.11E-05 1.002 9.52E-01 3.19E-05
rs917880 rs7788786 1.092 3.38E-05 NA NA 3.38E-05
rs6808352 rs2686315 1.141 3.41E-05 NA NA 3.41E-05
rs10505743 rs4764187 0.873 4.19E-05 NA NA 4.19E-05
rs12128325 rs1002480 1.076 2.90E-05 1.022 6.45E-01 4.25E-05
rs11062544 rs10491966 0.876 4.39E-06 1.069 3.93E-01 5.37E-05
rs12595780 rs10520750 0.918 1.30E-05 1.015 7.91E-01 5.84E-05
(Continued to the next page)
SNP1 SNP2 GENEVA IPM Combined P valuea
OR P value OR P value
rs251412 rs875214 1.167 3.55E-05 1.033 7.26E-01 6.00E-05
rs17813455 rs10879039 1.085 4.29E-05 1.024 6.57E-01 6.25E-05
rs17610159 rs997264 0.837 3.07E-05 0.962 8.38E-01 6.46E-05
rs41377246 rs4951095 0.907 1.93E-05 1.006 9.28E-01 6.49E-05
rs1528198 rs13325751 0.909 3.64E-05 0.992 9.12E-01 8.60E-05
rs2815122 rs11961538 1.068 4.59E-06 0.951 2.37E-01 8.85E-05
rs17825727 rs2929576 0.879 1.99E-05 1.033 7.44E-01 9.28E-05
rs10869704 rs927632 1.079 1.98E-05 0.981 7.03E-01 9.96E-05
rs1055640 rs10742177 0.924 1.85E-06 1.087 7.23E-02 1.01E-04
rs2035546 rs7973136 0.924 2.57E-05 1.014 7.81E-01 1.08E-04
rs10977624 rs7049205 1.107 2.41E-05 0.980 7.42E-01 1.10E-04
rs11087123 rs1233744 0.928 5.64E-05 0.992 8.60E-01 1.17E-04
rs6112589 rs200184 0.928 2.92E-05 1.014 7.68E-01 1.24E-04
rs12149938 rs12446064 0.909 3.79E-05 1.012 8.77E-01 1.29E-04
rs1316257 rs10803338 1.083 2.10E-05 0.972 5.46E-01 1.42E-04
rs11914507 rs10490792 0.840 3.39E-06 1.229 7.77E-02 1.54E-04
rs221293 rs9654709 1.073 2.54E-05 0.970 5.09E-01 1.80E-04
rs12360734 rs11234251 0.889 4.95E-05 1.023 7.61E-01 1.99E-04
rs17698379 rs4234669 0.902 2.68E-06 1.139 3.09E-02 2.17E-04
rs9881055 rs4858379 1.099 2.11E-05 0.944 3.20E-01 2.40E-04
rs10452272 rs17054576 0.915 4.22E-05 1.037 5.40E-01 2.60E-04
rs9844784 rs4234669 0.909 5.88E-06 1.117 5.65E-02 2.86E-04
rs7973972 rs2082529 0.880 3.11E-05 1.119 7.92E-02 8.54E-04
rs7973972 rs12823670 0.880 4.10E-05 1.130 5.62E-02 1.27E-03
rs4904516 rs10132162 0.928 4.12E-05 1.111 2.30E-02 1.93E-03
rs428321 rs7652606 1.171 4.15E-05 0.779 2.23E-02 1.97E-03
rs10508964 rs11815205 0.906 1.28E-05 1.202 2.14E-03 2.07E-03
SNP, single nucleotide polymorphism; GENEVA, Gene Environment Association Studies initiative in Type 2 Diabetes; IPM, Biobank Program of the Institute of Personalized Medicine; OR, odds ratio; NA, not available.
aMeta-analyses results by using two genome-wide association study samples.
Supplementary Table 1. Continued
Supplementary Table 2. The association between all EGFR polymorphisms and T2DM
SNP GENEVA IPM Combined
P valuea
OR P value OR P value
rs10244108 0.976 0.016 0.942 0.028 0.003
rs2110290 1.022 0.026 1.052 0.070 0.007
rs12671550 1.020 0.043 1.065 0.028 0.008
rs11487218 0.980 0.040 0.953 0.075 0.011
rs845558 1.021 0.032 1.028 0.291 0.018
rs6978771 1.023 0.038 1.026 0.375 0.024
rs12668421 1.021 0.051 1.029 0.312 0.030
rs6947594 1.028 0.049 1.028 0.458 0.035
rs12666347 1.014 0.171 1.066 0.020 0.038
rs7796139 0.983 0.117 0.951 0.084 0.040
rs13234622 1.014 0.154 1.054 0.049 0.045
rs9642391 NA NA 0.949 0.051 0.051
rs6593210 NA NA 0.947 0.051 0.051
rs10234806 0.988 0.286 0.923 0.005 0.052
rs17172446 0.977 0.043 0.999 0.966 0.055
rs883117 0.963 0.054 0.988 0.794 0.057
rs4947986 1.018 0.093 1.024 0.429 0.064
rs1107616 NA NA 1.062 0.068 0.068
rs845552 1.012 0.188 1.043 0.089 0.070
rs17746476 0.966 0.071 0.988 0.794 0.074
rs11975042 0.966 0.070 0.988 0.806 0.074
rs2877260 0.986 0.184 0.956 0.126 0.078
rs11238349 NA NA 1.046 0.097 0.097
rs845559 1.021 0.117 NA NA 0.117
rs10488143 0.984 0.440 0.884 0.015 0.123
rs6954351 0.989 0.396 0.929 0.032 0.129
rs6593211 NA NA 1.047 0.130 0.130
rs1107617 0.972 0.081 1.020 0.627 0.139
rs4947984 0.987 0.487 0.900 0.014 0.139
rs17518446 0.989 0.450 0.938 0.106 0.210
rs7786831 0.992 0.609 0.913 0.023 0.213
rs7801956 0.980 0.221 NA NA 0.221
rs6948867 NA NA 1.036 0.278 0.278
rs763317 0.991 0.363 0.983 0.508 0.280
rs11977660 1.010 0.294 NA NA 0.294
rs35891645 0.982 0.137 1.039 0.234 0.316
rs11976696 0.979 0.063 1.074 0.023 0.322
rs17172432 1.014 0.247 0.990 0.752 0.325
(Continued to the next page)
SNP GENEVA IPM Combined P valuea
OR P value OR P value
rs2241055 0.998 0.856 0.943 0.018 0.335
rs917880 0.991 0.342 NA NA 0.342
rs10488140 1.013 0.312 0.999 0.976 0.346
rs10280515 1.028 0.130 0.932 0.140 0.352
rs7809332 0.986 0.219 1.022 0.490 0.355
rs4947963 1.008 0.453 1.018 0.522 0.357
rs11760524 1.011 0.420 1.015 0.640 0.359
rs7804688 1.013 0.403 1.013 0.731 0.366
rs7783970 0.995 0.570 0.972 0.272 0.366
rs11770506 1.008 0.455 1.015 0.578 0.374
rs13244925 0.994 0.519 0.981 0.460 0.393
rs12534147 1.010 0.285 0.987 0.612 0.402
rs759169 0.989 0.416 NA NA 0.416
rs12535328 1.010 0.316 0.986 0.594 0.443
rs12718947 1.008 0.466 NA NA 0.466
rs35699152 0.987 0.278 1.032 0.326 0.488
rs3823585 1.005 0.625 1.018 0.496 0.491
rs883118 1.007 0.495 NA NA 0.495
rs17746482 0.989 0.460 1.004 0.922 0.507
rs1558544 1.007 0.540 1.006 0.835 0.517
rs10229932 0.992 0.617 0.979 0.617 0.523
rs759166 0.986 0.230 1.049 0.139 0.526
rs759162 1.006 0.563 1.008 0.804 0.530
rs1997083 0.980 0.143 1.103 0.024 0.534
rs980653 0.996 0.758 0.970 0.368 0.554
rs10277413 1.003 0.730 0.937 0.009 0.581
rs12718939 0.983 0.083 1.102 0.001 0.595
rs2072454 1.000 0.992 0.962 0.122 0.597
rs11771471 1.001 0.934 1.035 0.207 0.616
rs2075109 1.000 0.964 0.960 0.110 0.621
rs17586344 0.987 0.299 1.064 0.132 0.637
rs2740764 1.005 0.642 NA NA 0.642
rs2075110 1.001 0.930 0.960 0.109 0.649
rs17586365 1.006 0.658 NA NA 0.658
rs6960438 0.988 0.295 1.058 0.082 0.687
rs2877261 1.000 0.999 1.032 0.248 0.698
rs10488142 1.009 0.552 0.979 0.558 0.717
rs11536635 1.004 0.719 NA NA 0.719
(Continued to the next page) Supplementary Table 2. Continued
SNP GENEVA IPM Combined P valuea
OR P value OR P value
rs11982525 0.993 0.568 1.021 0.551 0.735
rs12538489 1.014 0.306 0.934 0.061 0.737
rs7795743 0.999 0.912 1.036 0.196 0.742
rs41324647 0.985 0.315 1.096 0.055 0.763
rs11506105 1.004 0.665 0.989 0.677 0.788
rs759167 0.992 0.465 1.043 0.167 0.823
rs12535226 1.007 0.461 0.964 0.135 0.847
rs729969 1.010 0.463 0.943 0.127 0.857
rs11767730 1.006 0.588 0.974 0.324 0.858
rs7809028 0.991 0.546 1.056 0.237 0.864
rs6970262 1.003 0.769 0.967 0.185 0.866
rs1525643 1.007 0.504 0.964 0.164 0.871
rs4140770 0.995 0.585 1.030 0.272 0.884
rs7795728 0.999 0.889 NA NA 0.889
rs1534130 1.002 0.894 NA NA 0.894
rs11768038 1.004 0.726 0.964 0.169 0.895
rs7781264 1.002 0.826 0.973 0.327 0.903
rs17172438 1.006 0.623 0.959 0.238 0.947
rs759170 1.004 0.761 0.975 0.493 0.954
rs7785013 1.003 0.830 0.975 0.491 0.977
rs2293347 0.994 0.692 1.058 0.246 0.987
rs940806 1.004 0.680 0.971 0.238 0.994
rs868254 1.003 0.773 0.979 0.424 0.998
EGFR, epidermal growth factor receptor; T2DM, type 2 diabetes mellitus; SNP, single nucleotide polymorphism; GENEVA, Gene Environment Association Studies initiative in Type 2 Diabetes; IPM, Biobank Program of the Institute of Personalized Medicine; OR, odds ratio; NA, not available.
aMeta-analyses results by using two genome-wide association study samples.
Supplementary Table 2. Continued
Supplementary Table 3. The interaction effects of the previously identified SNP pairs
SNP1 SNP2 D’ GENEVA IPM Combined
P valuea OR (95% CI) P value OR (95% CI) P value
rs7991210 rs4772265 0.96 0.95 (0.92–0.98) 0.0018 0.96 (0.88–1.06) 0.43 1.01×10⁻⁵
rs4772268 0.76 1.05 (1.02–1.08) 0.0038 0.92 (0.84–1.00) 0.04 4.26×10⁻⁵ SNP, single nucleotide polymorphism; SNP2, SNPs that in linkage disequilibrium (LD) with previously identified promoter SNP (rs3742250);
D’, coefficient of LD between SNP2 and rs3742250 in 1000 Genomes Phase 3; GENEVA, Gene Environment Association Studies initiative in Type 2 Diabetes; IPM, Biobank Program of the Institute of Personalized Medicine; OR, odds ratio; CI, confidence interval.
aMeta-analyses results by using two genome-wide association study samples.