Copyright © 2016 The Korean Society for Bone and Mineral Research
This is an Open Access article distributed under the terms of the Creative Commons Attribution Non-Commercial Li- cense (http://creativecommons.org/licenses/by-nc/3.0/) which permits unrestricted non-commercial use, distribu- tion, and reproduction in any medium, provided the original work is properly cited.
pISSN 2287-6375 eISSN 2287-7029
The Association between Muscle Mass Deficits Estimated from Bioelectrical Impedance Analysis and Lumbar Spine Bone Mineral Density in Korean Adults
Hye-Yeon Jang1, Hee-Jeong Choi2, Kye-Bong Lee1, Sul-Bit Cho1, In Jae Im1, Hee Jin Kim1
1Department of Family Medicine, Eulji University Hospital, Daejeon;
2Department of Family Medicine, Eulji University School of Medicine, Daejeon, Korea
Background: Bone mineral density (BMD) is influenced by many factors. Despite the re- ported association between body components and BMD, most of these studies investi- gated the relationship between absolute muscle mass or fat mass and BMD in post- menopausal women or elderly subjects. The aim of this study is to investigate the asso- ciation between muscle mass deficits (MMD) estimated from bioelectrical impedance analysis (BIA) and lumbar spinal BMD in Korean adults 20 to 49 years of age. Methods:
This cross-sectional study included 1,765 men and women who visited a health promo- tion center for a routine checkup. The lumbar spinal BMD was measured by dual energy X-ray absorptiometry. Body composition analysis was performed using BIA. Results: The mean age of the subjects was 40.2±6.3 years. Ten thousand subjects (56.7%) were males and 126 subjects (7.1%) belonged to the low BMD (Z-score ≤-2.0). MMD had the strongest influence on BMD after adjusting for all covariates. The adjusted odds ratio of Group 3 (MDD >2.6 kg) for low BMD was 2.74 (95% CI, 1.46-5.15) after adjusting for age, gender, body mass index, height, and smoking. Conclusions: MMD estimated by BIA showed a significant association with BMD and could be regarded as an independent risk factor for low BMD in adults 20 to 49 years of age. These findings support that inter- ventions such as physical activity or lifestyle changes may simultaneously modify both muscle and bone health in this age group.
Key Words: Body mass index, Bone density, Muscles, Osteoporosis
INTRODUCTION
Osteoporosis is a disease of aging and there is a growing emphasis on preven- tion. Osteoporosis is a global public health problem that affects an enormous num- ber of people and its prevalence will increase as the population ages. The conse- quences of osteoporosis include fractures and re-fractures, poor quality of life, ex- cess mortality and morbidity, and large economic burden.
Factors maximizing peak bone mass during the growing period and delaying and slowing bone loss during menopause and old age may reduce fracture risk.
Bone mineral density (BMD) is influenced by many factors such as age, gender, race, body weight or body mass index (BMI), lifestyle habits, hormonal status, and Corresponding author
Hee-Jeong Choi
Department of Family Medicine, Eulji University Hospital, 95 Dunsanseo-ro, Seo-gu, Daejeon 35233, Korea
Tel: +82-42-611-3231 Fax: +82-42-611-3776 E-mail: [email protected] Received: April 27, 2016 Revised: May 14, 2016 Accepted: May 14, 2016
No potential conflict of interest relevant to this article was reported.
Original Article
medical conditions or treatments. Among them, body weight or BMI is highly related to BMD.[1-3] BMI also ex- plains approximately 20% of the variance in BMD, which is one of the best determinants of BMD.[4]
On the other hand, the relative contribution of lean mass and fat mass to BMD remains a contentious issue. Previous studies demonstrated significant associations between body components and BMD, and some of these associa- tions were age specific. Lean mass was the main predictor of BMD in young and premenopausal women,[5,6] where- as fat mass predicted BMD better than lean mass in elderly or postmenopausal women.[7,8]
Despite the reported association between body compo- nents and BMD, most of these studies investigated the re- lationship between absolute muscle mass or fat mass and BMD in postmenopausal women or elderly subjects. The aim of this study is to investigate the association between muscle mass deficits (MMD) that are estimated from bio- electrical impedance analysis (BIA) and lumbar spinal BMD in Korean adults 20 to 49 years of age.
METHODS
1. SubjectsData was gathered from 2,073 adults (1,010 males and 1,063 females) aged 20 to 49 years who had visited a health promotion center for periodic health examination between May 2012 and August 2012 at Eulji University Hospital.
Among these subjects, we excluded subjects who met one of the following conditions: previous or current history of various types of cancer (n=32); hysterectomy (n=65); or a history of taking oral pills or hormone therapy (n=211).
After these exclusions, 1,765 subjects (1,000 males and 675 females) were analyzed in the present study. This study was approved by the institutional review board of Eulji University Hospital.
2. Data collection and anthropometric measurements
All subjects completed a self-reported questionnaire re- garding lifestyle related information, which includes ciga- rette smoking, alcohol consumption, and regular exercise habits. A detailed medical history and current medication use were collected through medical interviews. Alcohol consumption was defined as more than four drinks per
day or more than eight drinks per week for women, and more than five drinks per day and more than fifteen drinks per week for men.[9] A smoker was defined as a current smoker or an ex-smoker who had stopped within the last six months. Regular exercise was defined as twenty minutes or more per session at three times per week with high in- tensity exercise or thirty minutes or more per session at five times per week with low and moderate intensity exercise.
Height, weight and waist circumference were measured in subjects wearing a light robe and no shoes. BMI was cal- culated as the body weight (kg) divided by the height squar- ed (m2). Blood samples were collected after an overnight fast (>12 hr) and analyzed within three hours after the sampling. Blood chemistry was measured by an enzymatic technique using an ADVIA 2400 analyzer (Siemens Health- care Diagnostics, Deerfield, IL, USA). Serum 25-hydroxy-vi- tamin D (25-[OH]D) levels were measured by chemilumi- nescent immunoassay using a LIAISON analyzer (DiaSorin, Saluggia, Italy).
The lumbar spinal BMD was measured by dual energy X- ray absorptiometry (DXA; Lunar Prodigy, GE Lunar Corp., Madison, WI, USA). The BMD values were calculated as the means of measured values from L1-L4 except for the verte- brae affected by structural change due to collapse, surgery or degenerative disease, or internal artifacts. A vertebra was also excluded from the analysis if its T-score was more than 1 SD greater or less than that of the adjacent vertebra.
The low BMD was defined as Z-score ≤-2.0.[10]
BIA was performed using InBody 720 (Biospace Co., Ltd, Seoul, Korea) after voiding before the measurement. The subject stood on the footplate in their bare feet and held both hand electrodes. The screen automatically displays measurements of lean body mass (kg), skeletal muscle mass (kg), body fat mass (kg), and body fat percentage (%).
The control of results’ validity was done according to de- vice specifications using the impedance values from the measurements at six frequencies displayed on the result sheet and invalid measurements were excluded from anal- ysis.[11] The MMD, which is the difference between the ac- tual muscle mass and the optimal muscle mass, is the rec- ommended change in muscle mass and is expressed as the muscle control (kg) on the results sheet.
3. Statistics
The subjects were divided into three groups according
to the tertile of the MMD. Groups 1, 2, and 3 were defined as MMD=0 kg (no muscle deficit group), MMD ≤2.6 kg and MMD >2.6 kg, respectively. To compare the differenc- es between the three groups, we used analysis of variance (ANOVA) with Scheffé's post-hoc test and chi-square tests for continuous and categorical variables, respectively. Mul- tivariate linear regression analysis was performed to iden- tify the major determinants of the lumbar spine BMD. In this model, the independent variables were those that had a significant relationship with the lumbar spine BMD in the partial correlation analysis. Weight, waist circumference and body fat mass were omitted because of interclass cor- relation with BMI. Logistic regression analyses were used to estimate the odds ratios for low BMD in each group. Fi- nally, analysis of covariance (ANCOVA) was performed to compare the mean values of lumbar spine BMD between groups after adjusting for covariates. All statistical analyses were performed using SPSS statistical software (version 18.0; SPSS Inc., Chicago, IL, USA). A probability value of P<0.05 was considered significant.
RESULTS
1. General characteristics between MMD groups The mean ages of the 1,000 males (56.7%) and 765 fe-
males (43.3%) were 40.3±5.9 years and 40.0±6.6 years, respectively. One hundred twenty-six subjects (7.1%) be- longed to the low BMD group. The mean MMD of Groups 2 and 3 were 1.3±0.7 kg and 5.0±1.9 kg, respectively (P<
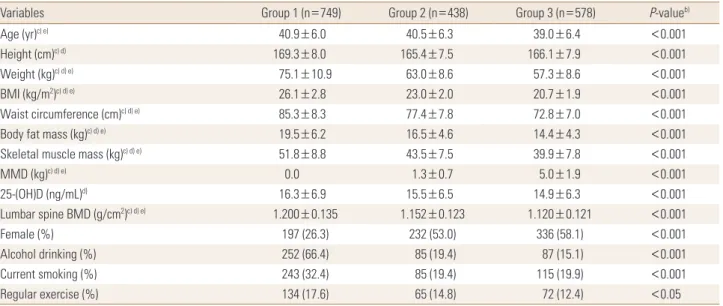
0.001). Weight, BMI, waist circumference, body fat mass, skeletal muscle mass, and lumbar spine BMD were signifi- cantly different between the three groups (P<0.001), and values decreased with increasing MMD. Serum 25-(OH)D levels showed significant difference only in Groups 1 and 3 (P<0.001), and a higher level in Group 1 (Table 1).
2. Major determinants of lumbar spine BMD Lumbar spine BMD had a significant positive correlation
Table 1. General characteristics between muscle mass deficits groupsa)
Variables Group 1 (n=749) Group 2 (n=438) Group 3 (n=578) P-valueb)
Age (yr)c) e) 40.9±6.0 40.5±6.3 39.0±6.4 <0.001
Height (cm)c) d) 169.3±8.0 165.4±7.5 166.1±7.9 <0.001
Weight (kg)c) d) e) 75.1±10.9 63.0±8.6 57.3±8.6 <0.001
BMI (kg/m2)c) d) e) 26.1±2.8 23.0±2.0 20.7±1.9 <0.001
Waist circumference (cm)c) d) e) 85.3±8.3 77.4±7.8 72.8±7.0 <0.001
Body fat mass (kg)c) d) e) 19.5±6.2 16.5±4.6 14.4±4.3 <0.001
Skeletal muscle mass (kg)c) d) e) 51.8±8.8 43.5±7.5 39.9±7.8 <0.001
MMD (kg)c) d) e) 0.0 1.3±0.7 5.0±1.9 <0.001
25-(OH)D (ng/mL)d) 16.3±6.9 15.5±6.5 14.9±6.3 <0.001
Lumbar spine BMD (g/cm2)c) d) e) 1.200±0.135 1.152±0.123 1.120±0.121 <0.001
Female (%) 197 (26.3) 232 (53.0) 336 (58.1) <0.001
Alcohol drinking (%) 252 (66.4) 85 (19.4) 87 (15.1) <0.001
Current smoking (%) 243 (32.4) 85 (19.4) 115 (19.9) <0.001
Regular exercise (%) 134 (17.6) 65 (14.8) 72 (12.4) <0.05
Data are shown as the mean±standard deviation for continuous variables and n (%) for categorical variables.
a)Group 1 is defined as MMD=0 kg, Group 2 is defined as 0 kg<MMD≤2.6 kg, Group 3 is defined as MMD >2.6 kg. b)P-value by ANOVA for continu- ous variables and by Chai-square tests for categorical variables. c)P<0.001 between Group 1 and Group 2. d)P<0.001 between Group 1 and Group 3.
e)P<0.001 between Group 2 and Group 3 by Scheffé's post-hoc test.
MMD, muscle mass deficit; BMD, bone mineral density; BMI, body mass index; 25-(OH)D, 25-hydroxy-vitamin D.
Table 2. Multivariate regression analyses with lumbar spine bone mineral density as a dependent variable
R2 B SE Beta P-valuea )
(Constant) 0.103 0.361 0.105 0.001
MMD -0.009 0.002 -0.170 <0.001
BMI 0.007 0.001 0.165 <0.001
Smoking -0.016 0.008 -0.054 0.036
Height 0.004 0.001 0.223 <0.001
Gender 0.059 0.010 0.220 <0.001
a)Adjusted for age, gender, height, MMD, BMI, skeletal muscle mass, serum 25-hydroxy-vitamin D, smoking, alcohol drinking, regular exercise, and seasons.
MMD, muscle mass deficit; BMI, body mass index; SE, standard error.
with weight, skeletal muscle mass, BMI, waist circumfer- ence, body fat mass, and height after adjusting for age and gender (P<0.001). In contrast, MMD was negatively corre- lated with the lumbar spine BMD (P<0.001) (data not shown).
Table 2 shows that MMD had the strongest influence on the lumbar spine BMD when age, gender, and all other variables were included in the regression model. Moreover, BMI, smoking status, height, and gender were significantly associated with the lumbar spine BMD. Together, these variables explain up to 10.3% of the variation in the lum- bar spine BMD.
3. Odds ratios (95% CI) for low BMD according to the MMD groups
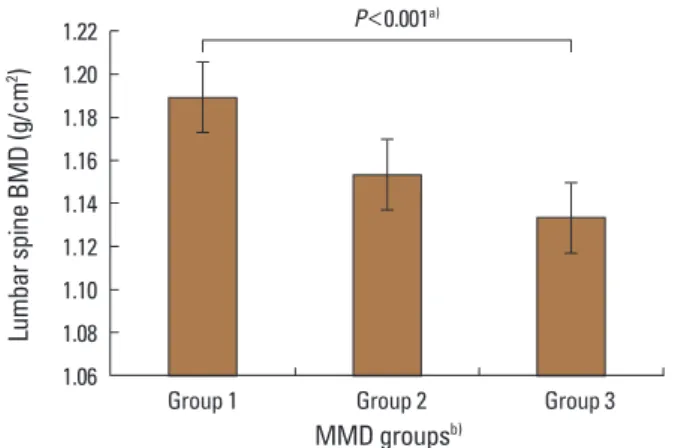
Table 3 shows the odds ratios for low BMD according to the MMD groups. The adjusted odds ratio of Group 3 for low BMD was 2.74 (95% CI, 1.46-5.15) after adjusting for age, gender, BMI, height, and smoking. This association was similar after adjusting for all other covariates including serum 25-(OH)D levels (OR 2.75; 95% CI, 1.45-5.12). The es- timated means of lumbar spine BMD decreased with in- creasing MMD after adjusting for age, gender, smoking and BMI (P<0.001) (Fig. 1).
DISCUSSION
Bone mass is an important determinant of fracture risk in the elderly. Absolute bone mass is the sum of the cumu- lative rates of bone formation and bone loss. Therefore, strategies for accruing as much bone mass as possible over the first thirty years of life and slowing the rate of age-re- lated bone loss are the first step for achieving optimal bone health and minimizing one’s risk of osteoporotic fracture.
Throughout life, BMD is influenced by many factors such
as age, body weight or BMI, lifestyle habits, hormonal sta- tus, and medical conditions or treatments. Among them, body weight or BMI is highly related to BMD in various pop- ulations [1-3,12] and maintaining a healthy body weight is important for bone health throughout life.
Body weight is largely made up of two components: fat mass and lean mass. The relative contribution of these two components to the variation in BMD remains a contentious issue. Previous studies have demonstrated significant as- sociations between body components and BMD, and some of these associations were age specific. Lean mass was the main predictor of BMD in young and premenopausal wom- en,[5,6] whereas fat mass predicted BMD better than lean mass in older or postmenopausal women.[7,8] Despite the reported association between body components and BMD, most of these studies investigated the relationship between absolute muscle mass or fat mass measured by DXA and BMD in postmenopausal women or elderly subjects. How- ever, these results have limitations for use in clinical practice.
We investigated the relationship between muscle and BMD using MMD estimated from BIA. BIA is a less expen- sive, timesaving, convenient, and easily accessible modali- ty in an outpatient clinic setting when compared with oth- er modalities. BIA is based on the capacity of hydrated tis- sues, which assumes that total body water is constant. From total body water, validated equations allow the calculation of fat free mass and fat mass.[13] For the analysis of the body composition, BIA has been shown to have good cor- Table 3. Odds ratios (95% confidence interval) for low bone mineral
density (Z-score ≤-2.0) according to muscle mass deficits groupsa) Group 1 (n=749) Group 2 (n=438) Group 3 (n=578) Model 1b) 1 1.81 (1.12-2.92) 1.85 (1.20-2.86) Model 2c) 1 1.57 (0.89-2.75) 2.74 (1.46-5.15) Model 3d) 1 1.54 (0.88-2.72) 2.7 (1.45-5.12)
a)Group 1 is defined as MMD=0 kg, Group 2 is defined as 0 kg <MMD
≤2.6 kg, Group 3 is defined as MMD >2.6 kg. b)Unadjusted. c)Adjusted for age, gender, BMI, height, and smoking. d)Adjusted for age, gender, BMI, height, smoking, MMD, serum 25-hydroxy-vitamin D, alcohol drink- ing, regular exercise, and seasons.
MMD, muscle mass deficit; BMI, body mass index.
Fig. 1. Adjusted mean values of lumbar spinal BMD according to MMD groups. Bars mean standard errors. a)Adjusted for age, gender, smok- ing, and BMI. b)Group 1 is defined as MMD=0 kg, Group 2 is defined as 0 kg<MMD≤2.6 kg, Group 3 is defined as MMD>2.6 kg. BMD, bone mineral density; MMD, muscle mass deficit.
1.22 1.20 1.18 1.16 1.14 1.12 1.10 1.08 1.06 Lumbar spine BMD (g/cm2)
Group 1 Group 2 Group 3
MMD groupsb) P<0.001a)
relation with DXA.[14] MMD is the difference between the actual muscle mass and the optimal muscle mass, which is estimated from target weight, and the recommended change in muscle mass. MMD is displayed as muscle control (kg) on the results sheet. Thus, the results are easily applicable to clinical practice.
In this study, MMD, BMI, smoking status, height, and gen- der were major independent variables associated with lum- bar spine BMD in adults aged 20 to 49 years and MMD, not absolute skeletal muscle mass, had the strongest influence on the lumbar spine BMD after adjusting for all covariates.
In addition, adjusted means of lumbar spine BMD decreas- ed progressively with increasing MMD. These results sug- gest that MMD estimated from BIA might be used as a screen- ing tool in a clinical setting to identify people with risk of low BMD. Furthermore, as BMD and MMD are negatively related, interventions intended to improve muscle mass would concurrently improve BMD.
Changes in muscle and bone mass brought about by ex- ercise or aging are also tightly correlated in both human and experimental animal models.[15] It has been widely assumed that the coordination of muscle and bone mass occurs through muscle force-generated mechanical signals, which transduce anabolic activity in the adjacent bone.[16]
The shared mesodermal origin of muscle and bone pres- ents the additional possibility that common molecule net- works serve to coordinate their mass.[17-20] Many of the studies suggest a dominant role of muscle over bone in synchronizing the mass of these two tissues, at least in post- natal life.[14]
Our study has several limitations. First, we could not ver- ify the causality between MMD and lumbar spine BMD in this cross-sectional study. Second, we cannot rule out se- lection bias in our subjects who had visited a health pro- motion center. Therefore, study subjects may not represent the entire Korean population. Third, detailed assessment of current and past activities of subjects could not be con- firmed. Finally, analyses performed only on lumbar spine BMD data, could have biased the results as the proportions of trabecular and cortical components are different accord- ing to the measured bone. Despite such limitations, our study is the first to show the consistently significant asso- ciation between MMD, as assessed by BIA, with lumbar spine BMD emphasizing the importance of MMD on low BMD.
In conclusion, MMD estimated by BIA showed a signifi- cant association with lumbar spine BMD and could be re- garded as an independent risk factor for low BMD in Kore- an adults 20 to 49 years of age. These findings support that interventions such as physical activity or lifestyle changes may simultaneously modify both muscle and bone health in this age group.
REFERENCES
1. Felson DT, Zhang Y, Hannan MT, et al. Effects of weight and body mass index on bone mineral density in men and wo- men: the Framingham study. J Bone Miner Res 1993;8:567- 73.
2. Gourlay ML, Hammett-Stabler CA, Renner JB, et al. Associ- ations between body composition, hormonal and lifestyle factors, bone turnover, and BMD. J Bone Metab 2014;21:
61-8.
3. Kim SJ, Yang WG, Cho E, et al. Relationship between weight, body mass index and bone mineral density of lumbar spine in women. J Bone Metab 2012;19:95-102.
4. Nguyen TV, Center JR, Eisman JA. Osteoporosis in elderly men and women: effects of dietary calcium, physical ac- tivity, and body mass index. J Bone Miner Res 2000;15:322- 31.
5. Liu JM, Zhao HY, Ning G, et al. Relationship between body composition and bone mineral density in healthy young and premenopausal Chinese women. Osteoporos Int 2004;
15:238-42.
6. Li S, Wagner R, Holm K, et al. Relationship between soft tissue body composition and bone mass in perimenopaus- al women. Maturitas 2004;47:99-105.
7. Ijuin M, Douchi T, Matsuo T, et al. Difference in the effects of body composition on bone mineral density between pre- and postmenopausal women. Maturitas 2002;43:239- 44.
8. Douchi T, Oki T, Nakamura S, et al. The effect of body com- position on bone density in pre- and postmenopausal wo- men. Maturitas 1997;27:55-60.
9. National Institute on Alcohol Abuse and Alcoholism. Drink- ing levels defined. 2016 [cited by 2016 April 25]. Available from: http://www.niaaa.nih.gov/alcohol-health/overview- alcohol-consumption/moderate-binge-drinking
10. The International Society For Clinical Densitometry. 2015 Official Positions. [cited by 2016 Apr 24]. Available from:
https://iscd.app.box.com/v/op-iscd-2015-adult
11. Biospace Co Ltd. InBody 720: The precision body composi- tion analyzer: User's manual. 1996-2004 [cited by 2016 May 14]. Available from: http://www.bodyanalyse.no/docs/
720%20users%20manual.pdf
12. Kim CJ, Rhee EJ, Kim HMK, Hyun Sock, et al. Relationship between body composition and metabolic bone disease in Korean male adults. Korean J Bone Metab 2008;15:25- 32.
13. Thibault R, Pichard C. The evaluation of body composition:
a useful tool for clinical practice. Ann Nutr Metab 2012;60:
6-16.
14. Svendsen OL, Haarbo J, Heitmann BL, et al. Measurement of body fat in elderly subjects by dual-energy x-ray absorp- tiometry, bioelectrical impedance, and anthropometry.
Am J Clin Nutr 1991;53:1117-23.
15. DiGirolamo DJ, Kiel DP, Esser KA. Bone and skeletal mus- cle: neighbors with close ties. J Bone Miner Res 2013;28:
1509-18.
16. Frost HM. A 2003 update of bone physiology and Wolff's Law for clinicians. Angle Orthod 2004;74:3-15.
17. Schoenwolf GC, Bleyl SB, Brauer PR, et al. Development of the musculoskeletal system. In: Schoenwolf GC, Bleyl SB, Brauer PR, et al., editors. Larsen’s human embryology. 5th ed. Philadelphia, PA: Churchill Livingstone; 2009. p.172-96.
18. Kaji H. Linkage between muscle and bone: common cata- bolic signals resulting in osteoporosis and sarcopenia. Curr Opin Clin Nutr Metab Care 2013;16:272-7.
19. Ruschke K, Hiepen C, Becker J, et al. BMPs are mediators in tissue crosstalk of the regenerating musculoskeletal sys- tem. Cell Tissue Res 2012;347:521-44.
20. Mo C, Romero-Suarez S, Bonewald L, et al. Prostaglandin E2: from clinical applications to its potential role in bone- muscle crosstalk and myogenic differentiation. Recent Pat Biotechnol 2012;6:223-9.