서 론
용적변조 회전방사선치료(Volumetric modulated arc therapy, VMAT)는 겐트리 회전, MLC(Multileaf collimator) 움직임, 선량률이 연동되어 방사선이 조사되는 방법이며 정
상조직에 대한 선량을 최소화 하면서 치료부위에 매우 정교 하고 균일한 선량분포를 만들 수 있다. 또한 같은 선량을 전 달하기 위한 MU(Monitor Unit)이 세기변조 방사선치료에 비해 감소하여 빠른 시간에 선량전달이 가능한 장점을 가지 고 있다.1-3)
이와 같이 치료기의 복잡한 움직임이 많아지고 치료 시 선량이 세기변조 방사선치료에 비해 큰 VMAT 치료를 구현 하는데 있어서 치료장비가 계획된 치료계획을 얼마나 정확 하게 환자에게 구현해 낼 것 인지에 대한 평가, 즉 치료 전
본 논문은 2015년 10월 02일 접수하여 2015년 12월 09일 채택되었음.
책임저자 : 김세현, 서울아산병원 방사선종양학과 서울특별시 송파구 올림픽로43길 88 Tel : 02) 3010-4411
E-mail : [email protected]
용적변조회전 방사선치료에서 Portal Dosimetry를 이용한 선량평가의 재현성 분석
서울아산병원 방사선종양학과
목 적 :복잡하고 정교하게 계획된 용적변조회전 방사선치료(Volumetric Arc Therapy, VMAT)의 Portal Dosimetry를 이용한 치료 전 선량평가가 다양한 인자에 따라 재현성을 유지하는지 분석하고자 하였다.
대상 및 방법 : 실험에는 TrueBeam STxTM(Ver.1.5, Varian, USA), Portal dosimetry application(Ver.10, Varian)과 Portal Vision aS1000 Imager(Varian, USA)을 사용하였다. 두경부암 환자 2명, 전립샘암 환자 3명, 폐암 환자 1명, 자궁경부암 환자 1명, 총 7명의 환자에 대하여 Portal Dosimetry용 VMAT 전산화치료계획(Eclipse, Ver.10.0, Varian, USA)을 수립하였다. 오전 치료 전과 후 오후 치료 종료 후 각 4시간 간격을 두고 3 회씩 5일에 걸쳐 선량평가를 시행하였다. Gamma pass rate(GPR 3%, 3mm 95%신뢰구간)와 Beam 출력의 상관관계를 확인하기 위하여 선량평 가 시행 전 Beam 출력 을 물등가모형과 이온전리함(IBA dosimetry, Germany)을 이용하여 측정하였다. Electronic Portal Imaging Device(EPID) 상 태에 따른 GPR 의 변화를 확인하기 위하여 EPID의 영상 교정 (Dark field correction, Flood field correction) 전과 후로 나누어 선량평가를 시행하 였다. 또한 다엽콜리메이터(Multi Leaf Collimator) 상태에 따른 GPR의 변화를 확인하기 위해 다엽콜리메이터 Initialize 전과 후로 나누어 선량평가 를 시행하였다.
결 과 :Portal Dosimetry를 시행하여 얻은 모든 환자들의 각 시간대 별 GPR의 평균값은 97.11%, 96.09%, 95.37% 였고 최대 차이를 보인 환자 의 경우 각 시간대 별 GPR의 평균값은 95.73%, 94.20% 93.23% 였다. 선량평가 시점의 Beam 출력을 측정한 결과 각 시간대별 평균값은 100.45%, 100.46%, 100.59% 였다. EPID의 영상 교정(Dark field correction, Flood field correction)을 시행하기 전과 후의 대상 환자들의 GPR 의 평균값은 95.94 % , 96.01% 였다. 또한 다엽콜리메이터 의 Initialize 를 시행하기 전과 후의 대상 환자들의 GPR 의 평균값은 95.83% , 96.40%
였다.
결 론 :치료기 사용시간이 경과됨에 따라 대상 환자들의 GPR 평균값이 0.8% 감소함을 확인할 수 있었다. Beam 출력은 각 측정시점에 0.1% 오 차범위 안에서 일정한 상태를 유지하였다. EPID의 영상 교정 전, 후 의 선량평가 결과 GPR은 평균 0.1% 차이를 나타내었다. 다엽콜리메이터의 Initialize 전, 후의 선량평과 결과 Initialize 시행 후 GPR이 평균 0.6% 상승하였고 다엽콜리메이터 상태에 따라 GPR이 변화할 수 있다는 것을 확인 할 수 있었다. 복잡하고 정교하게 계획된 VMAT의 치료 전 선량평가 도구로서 재현성을 유지하며 Portal Dosimetry를 이용하기 위해서는 주기적인 장비의 점검뿐만 아니라, 선량평가에 영향을 미칠 수 있는 다양한 인자들에 대한 관리가 이뤄져야 할 것으로 판단된다.
핵심용어 :용적변조회전 방사선치료에서 Portal Dosimetry를 이용한 선량평가의 재현성 분석
김세현・배선명・서동린・강태영・백금문
선량평가(Pre-Treatment Dosimetrical QA)의 중요성이 증 가하게 되었다.4)
치료 전 선량평가는 기존의 방법들로 2D-array chamber 나, Film 등을 이용 하여 진행하는 방법들이 있으나 Portal Dosimetry를 이용한 치료 전 선량평가는 보다 Set-up 이 간 편하고, 측정에 소요되는 시간이 줄어들었으며, 얻어진 선 량분포의 해상도이 높아 분석이 용이하다는 장점을 가지고 있다.5-7)
Portal Dosimetry는 Phantom이나 Film을 설치하지 않고 도 Electronic Portal Image Device(EPID)를 통해 얻어지는 전기적인 신호를 변환하여 Portal Dosimetry application으 로 data를 얻게 되고 이에 따른 선량분포를 고해상도로 표 현하여 Gamma Pass rate(GPR)과 Dose Diffrence를 측정 할 수 있다.
따라서 본 연구에서는 Portal Dosimetry가 과연 여러 가 지 변수들 즉, 치료장비 사용시간 경과, 빔 출력, EPID calibrtaion, MLC Initialize 여부에 따른 Gamma Pass Rate(GPR, 3%, 3mm 95%신뢰구간)의 재현성을 분석하여 Portal Dosimetry를 이용한 치료 전 선량평가의 신뢰도를 확보하고자 한다.
대상 및 방법
1. 실험 재료
- TrueBeam STxTM(Varian Medical Systems, Palo Alto, Ver 1.5 USA)
- Portal Vision aS1000 Imager(Varian, USA) - Portal Dosimetry application(Ver.10, Varian) - Water Phantom and Ion Chamber(IBA Dosimetry,
Germany)
- 전산화치료계획시스템 (Eclipse treatment planning system Version 10.0, Varian, USA)
- Excel 2007 (Microsoft, USA)
- PASW Statistics (Ver.18.0.0, Polar Engineering and consulting)
2. 실험 방법
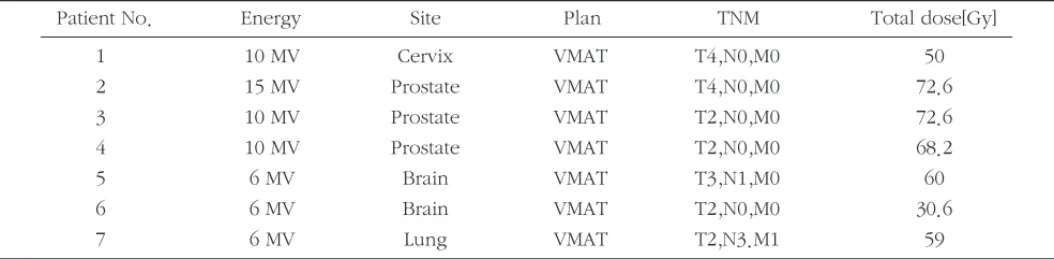
대상 환자로는 본원의 TrueBeam STxTM에서 대표적으로 VMAT 치료계획이 적용되는 두경부암 환자 2명, 전립샘암 Table 1. Information of each Patients
Patient No. Energy Site Plan TNM Total dose[Gy]
1 10 MV Cervix VMAT T4,N0,M0 50
2 15 MV Prostate VMAT T4,N0,M0 72.6
3 10 MV Prostate VMAT T2,N0,M0 72.6
4 10 MV Prostate VMAT T2,N0,M0 68.2
5 6 MV Brain VMAT T3,N1,M0 60
6 6 MV Brain VMAT T2,N0,M0 30.6
7 6 MV Lung VMAT T2,N3.M1 59
Table 2. Measured data of average Gamma pass rate with Time Interval
Patient No. Machine On After4hr After 8hr
1 98.2% 97.8% 97.0%
2 95.7% 94.2% 93.2%
3 95.3% 93.8% 92.4%
4 97.2% 95.9% 95.3%
5 99.3% 98.4% 97.6%
6 99.0% 98.4% 98.0%
7 96.4% 95.0% 94.1%
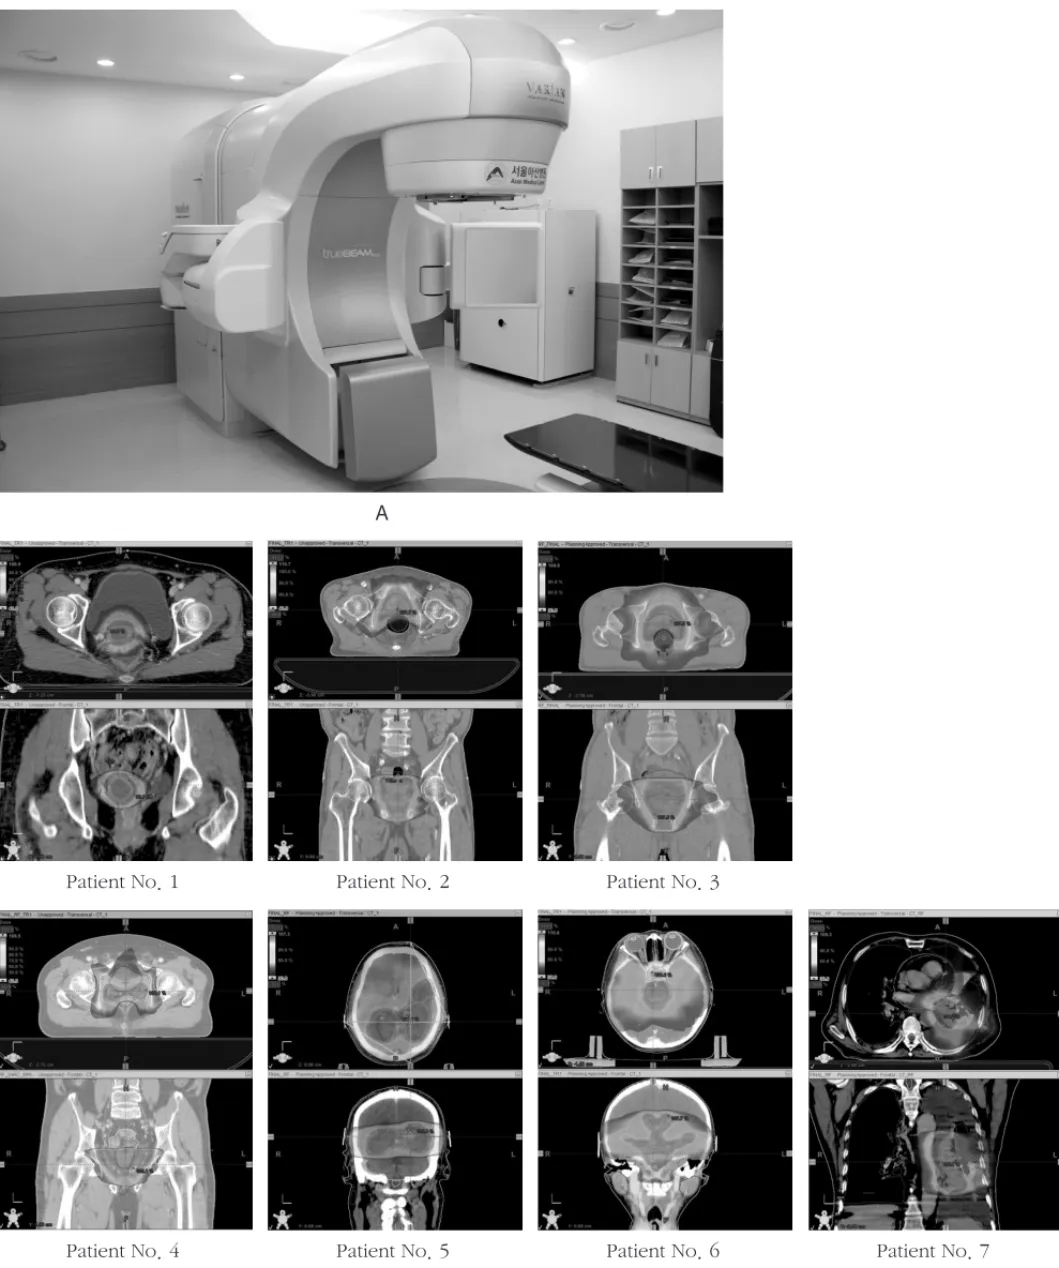
Fig 1. A : TrueBeamTM(Varian Medical Systems, Palo Alto, CA) B : Electronic Portal Imaging Device(EPID)
A
B
Patient No. 1 Patient No. 2 Patient No. 3
Patient No. 4 Patient No. 5 Patient No. 6 Patient No. 7
환자 3명, 폐암 환자 1명, 자궁경부암 환자 1명, 총 7명을 선 정 하 여 실 제 치 료 계 획 과 동 일 하 게 계 획 된 Portal Dosimetry용 VMAT 전산화치료계획(Eclipse, Ver.10.0, Varian, USA)을 수립하였다. [Table. 1] [Fig. 1]
치료시간의 경과함에 따라 Portal Dosimetry를 이용해 얻 어지는 Gamma Pass rate(GPR) 값의 변화를 측정하기 위하 여 치료기를 켜고 일일점검이 끝난 후, 오전 치료 종료 후, 오후 치료 종료 후 각 4시간 간격을 두고 3회씩 5일에 걸쳐 선량평가를 시행하였다. [Table. 2]
Beam 출력과 GPR의 상관관계를 확인하기 위하여 각 선 량평가 시행 전 VMAT 치료에 사용되는 Photon Energy 6MV, 15MV의 Beam 출력을 물 등가모형과 이온전리함 (IBA dosimetry, Germany)을 이용하여 측정하였다.
[Table. 3]
EPID 상태에 따른 GPR 의 변화를 확인하기 위하여 EPID의 영상 교정 (Dark field correction, Flood field correction, Dose Normalization) 전 후로 나누어 선량평가 를 시행하여 GPR을 구하였다. [Table. 4]
또한 MLC 상태에 따른 GPR의 변화를 확인하기 위해 MLC Initialize 전과 후로 나누어 선량평가를 시행하여 GPR 을 구하였다. [Table. 5]
3. 연구결과의 분석
Portal Dosimetry를 통해 얻어진 선량분포에 대하여 거리 상의 일치(distance-to-agreement, DTA)와 선량에 대한 차
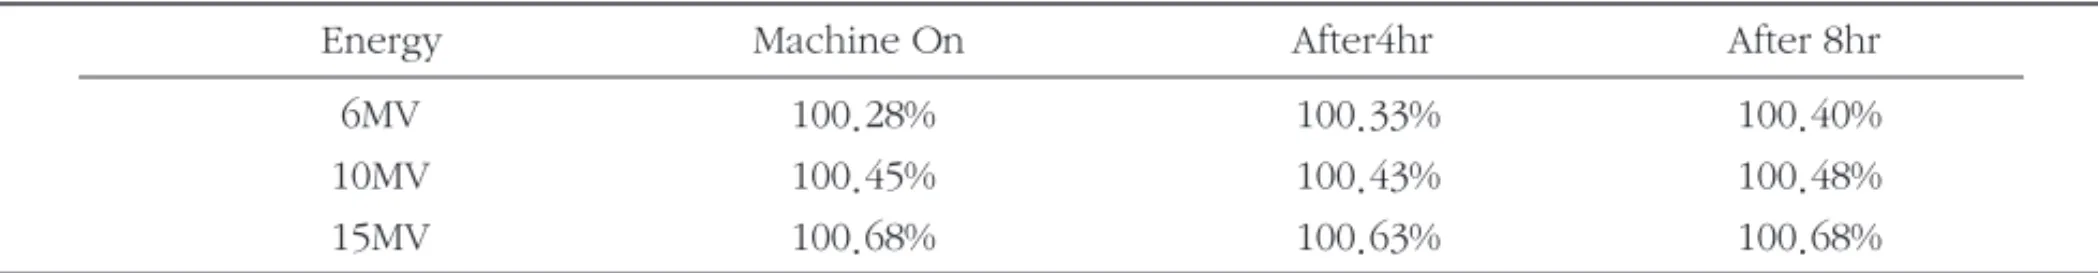
Table 3. Measured data of average Beam Output with Time Interval
Energy Machine On After4hr After 8hr
6MV 100.28% 100.33% 100.40%
10MV 100.45% 100.43% 100.48%
15MV 100.68% 100.63% 100.68%
Fig 2. Portal Dosimetry application(Varian Medical Systems)
이(dose difference, DD)를 분석하기 위해 이원화된 정량적 평가방법인 감마지수(Gamma index)를 이용하였다.9-10)
(Gamma index 3 mm, 3%). Microsoft office 2007 - EXCEL 프로그램을 이용하여 각 변수들, 치료장비 사용시간 경과, 빔 출력, EPID calibrtaion, MLC Initialize 여부에 따 른 감마지수의 평균을 구하여 비교 분석하였으며, 이에 따 른 통계적 유의성을 도출하기 위해 PASW Statistics를 이용
하여 P-value를 구하였다.
결 과
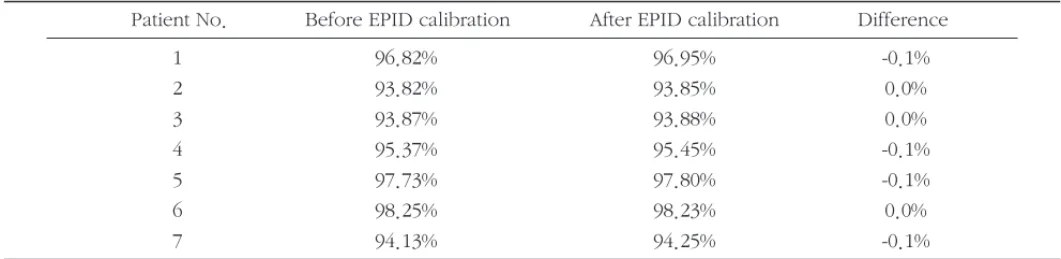
Portal Dosimetry를 시행하여 얻은 모든 대상 환자들의 치료장비 사용시간 경과에 따른 4시간 간격 간 시간대 별 Table 4. Measured data of average Gamma pass rate with EPID calibration
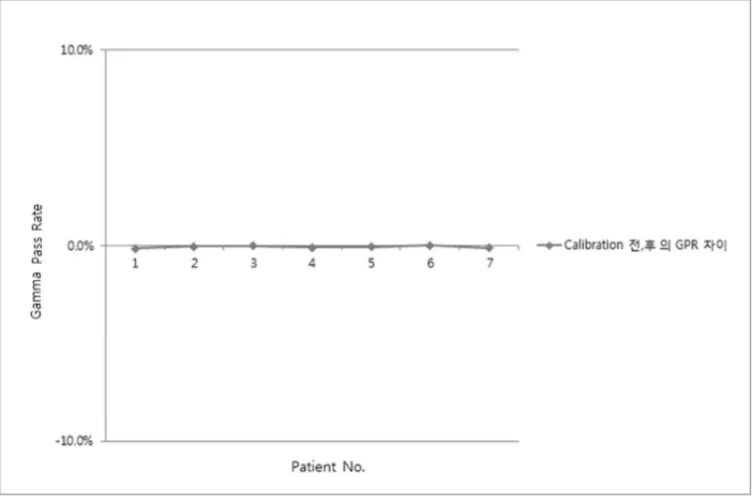
Patient No. Before EPID calibration After EPID calibration Difference
1 96.82% 96.95% -0.1%
2 93.82% 93.85% 0.0%
3 93.87% 93.88% 0.0%
4 95.37% 95.45% -0.1%
5 97.73% 97.80% -0.1%
6 98.25% 98.23% 0.0%
7 94.13% 94.25% -0.1%
Table 5. Measured data of average Gamma pass rate with MLC Initialize
Patient No. Before MLC calibration After MLC calibration Difference
1 97.7% 98.3% 0.5%
2 94.0% 94.6% 0.6%
3 93.7% 94.3% 0.6%
4 95.7% 96.2% 0.5%
5 97.8% 98.6% 0.8%
6 98.9% 99.3% 0.4%
7 93.6% 95.5% 1.9%
Fig 3. Graph of average Gamma pass rate with Time Interval
Fig 4. Graph of average Beam Output with Time Interval
GPR의 평균값은 97.11%, 96.09%, 95.37% 였고 시간의 경 과에 따라 최대 차이를 보인 환자의 경우 각 시간대 별 GPR 의 평균값은 95.73%, 94.20% 93.23% 였다.[Table. 2][Fig. 3]
각 선량평가 시점의 Beam 출력을 측정한 결과 각 시간대별 평균값은 100.45%, 100.46%, 100.59% 였다.[Table. 3][Fig.
4] EPID의 영상 교정(Dark field correction, Flood field correction)을 시행하기 전과 후의 선량평가를 비교한 결과
모든 대상 환자들의 GPR 의 평균값은 95.94 %, 96.01% 였 다.[Table. 4][Fig. 5] 또한 다엽콜리메이터 의 Initialize 를 시 행하기 전과 후로 나누어 선량평가를 진행한 결과 모든 대 상 환자들의 GPR의 평균값은 95.83%, 96.40% 였다.[Table.
5][Fig. 6]
다엽콜리메이터 Initialize 전 후의 GPR로 T검정을 시행한 결과 p-value는 0.007로서 통계적으로 유의함을 확인하였다.
Fig 5. Comparison of average Gamma pass rate with EPID Calibration
Fig 6. Graph of average Gamma pass rate with MLC Initialize
결 론
치료기 사용시간이 경과됨에 따라 모든 대상 환자들의 GPR 평균값이 0.8% 감소함을 확인할 수 있었다. Beam 출 력은 각 측정시점에 0.1% 오차범위 안에서 일정한 상태를 유지하였다. EPID의 영상 교정 전, 후의 선량평가 결과 GPR 값의 변화는 평균 0.1% 이내였다. 다엽콜리메이터의 Initialize 전, 후의 선량평과 결과 Initialize 시행 후 GPR이 평균 0.6% 상승하였다. 이는 치료기의 사용시간이 경과할 수록 다양한 요인에 의해 Portal Dosimetry를 통해 얻어지 는 GPR 값이 영향을 받을 수 있는데 그 중 다엽콜리메이터 상태에 따라 그 값이 변화할 수 있다는 것을 확인할 수 있었 다. 복잡하고 정교하게 계획된 VMAT의 치료 전 선량평가 도구로서 재현성과 항상성을 유지하며 Portal Dosimetry를 이용하기 위해서는 다엽콜리메이터의 정밀한 관리와 주기 적인 장비의 점검뿐만 아니라, 선량평가에 영향을 미칠 수 있는 다양한 인자들에 대한 관리가 이뤄져야 할 것으로 판 단된다.
참고문헌
1) Yen-Cho Huang, M.Sc, Chien-Yi Yeh et al.: Clinical practice and evaluation of electronic portal imaging device for VMAT. Medical Dosimetry 2013;38:35-41 2) Anton Mans, Peter Remeijer, Igor Olaciregui-Ruiz et
al: 3D Dosimetric Verification of volumetric modulated arc therapy by portal dosimetry.
Radiotherapy and Oncology 2010;94:181-187 3) Stine Korreman, Joakim Medin, Flemming Kjær-
Kristoffersen: Dosimetric verification of RapidArc treatment delivery. Acta Oncologica 2009;48:185-191 4) Bedford JL, Warrington AP: Commissioning of
volumetric modulated arc therapy (VMAT). Int J Radiat Oncol Biol Phys 2009 Feb 1;73(2):537-45 5) Dayananda Shamurailatpam Sharma, Vaibav Mhatre,
Malhotra Heigrujam et al : Portal dosimetry for pretreatment verifiation of IMRT plan : a comparison with 2D ion chamber array. Journal of applied clinical medical physics, 2010;11:238-248
6) J. Richart, M.C. Pujades, J. Perez-Calatayud et al.:
QA of dynamic MLC based on EPID portal dosimetry. European Journal of Medical Physics, 2012;28:262-268
7) Daniel W. Bailey, Lalith Kumaraswamy, Mohammad Bakhtiari et al : EPID dosimetry for pretreatment quality assurance with two commercial systems.
2012;13:82-99
8) Soonki Min, Young Eun Choi, Jungwon Kwak et al : Practical approach for pretreatment verifiation of IMRT with flttening fiter-free (FFF) beams using Varian portal dosimetry. 2015;16:40-50
9) M.Stasi, S. Bresciani, A. Miranti at al. Pretreatment patient-specific IMRT quality assurance: a correlation study between gamma index and patient clinical dose volume histogram. Medical Physics 2012;Dec;39(12):7626-34
10) Francisco CH, Silvia VC : A Probability Approach to the Study on Uncertainty Effects on Gamma Index Evaluations in Radiation Therapy. Computational and Mathematical Methods in Medicine 2011;
861869, 10
Purpose : The pre-treatment QA using Portal dosimetry for Volumetric Arc Therapy To analyze whether maintaining the reproducibility depending on various factors.
Materials and Methods :Test was used for TrueBeam STxTM (Ver.1.5, Varian, USA). Varian Eclipse Treatment planning system(TPS) was used for planning with total of seven patients include head and neck cancer, lung cancer, prostate cancer, and cervical cancer was established for a Portal dosimetry QA plan. In order to measure these plans, Portal Dosimetry application (Ver.10) (Varian) and Portal Vision aS1000 Imager was used. Each Points of QA was determined by dividing, before and after morning treatment, and the after afternoon treatment ended (after 4 hours). Calibration of EPID(Dark field correction, Flood field correction, Dose normalization) was implemented before Every QA measure points. MLC initialize was implemented after each QA points and QA was retried. Also before QA measurements, Beam Ouput at the each of QA points was measured using the Water Phantom and Ionization chamber(IBA dosimetry, Germany).
Results :The mean values of the Gamma pass rate(GPR, 3%, 3mm) for every patients between morning, afternoon and evening was 97.3%, 96.1%, 95.4% and the patient’s showing maximum difference was 95.7%, 94.2% 93.7%. The mean value of GPR before and after EPID calibration were 95.94 % , 96.01%. The mean value of Beam Output were 100.45%, 100.46%, 100.59% at each QA points. The mean value of GPR before and after MLC initialization were 95.83% , 96.40%.
Conclusion :Maintain the reproducibility of the Portal Dosimetry as a VMAT QA tool required management of the various factors that can affect the dosimetry.
Se Hyeon Kim, Sun Myung Bae, Dong Rin Seo, Tae Young Kang, Geum Mun Baek
Evaluate the implementation of Volumetric Modulated Arc Therapy QA in the radiation therapy treatment according
to Various factors by using the Portal Dosimetry.
Department of Radiation Oncology, ASAN Medical Center, Seoul, Korea
Abstract
Keyword :VMAT, Portal Dosimetry, Gamma Pass Rate, MLC