Stereo matching for large-scale high-resolution satellite images using new tiling technique
An Nguyen Hong
*, Dong-Min Woo
**★Abstract
Stereo matching has been grabbing the attention of researchers because it plays an important role in computer vision, remote sensing and photogrammetry. Although most methods perform well with small size images, experiments applying them to large-scale data sets under uncontrolled conditions are still lacking. In this paper, we present an empirical study on stereo matching for large-scale high-resolution satellite images. A new method is studied to solve the problem of huge size and memory requirement when dealing with large-scale high resolution satellite images. Integrating the tiling technique with the well-known dynamic programming and coarse-to-fine pyramid scheme as well as using memory wisely, the suggested method can be utilized for huge stereo satellite images. Analyzing 350 points from an image of size of 8192 x 8192, disparity results attain an acceptable accuracy with RMS error of 0.5459. Taking the trade-off between computational aspect and accuracy, our method gives an efficient stereo matching for huge satellite image files.
Key words: Stereo matching, Remote sensing, Tiling technique, Disparity map, High-resolution satellite image
* R&D Center, FPT IS Soft, Vietnam, and Dept.
of Electronics Eng., Myongji University, Korea
** Dept. of Electronics Eng., Myongji University, Yongin, Kyonggido, 449-728 Korea
★Corresponding author, [email protected] 031-330-6752
※ Acknowledgment: This research was supported by Basic Science Research Program through the National Research Foundation of Korea(NRF) funded by the Ministry of Education (No.
NRF-2012R1A1A2004950).
Manuscript received Nov. 13, 2013; revised Dec. 06, ,2013 ; accepted Dec. 09. 2013
I. Introduction
Stereo matching is the corresponding problem in which image coordinate disparities of conjugate points from stereo images are determined. It is not only the first stage of 3D reconstruction based on the Rational Function Model [1], but is also needed for some other processes, such as image registration [2]. By coordinating computer vision, remote sensing and photogrammetry, many applications including
Global Position System(GPS), environment management system, scene reconstruction, and navigator have been developed for geography and civil engineering. These applications generate a great deal of interest for the research of georeferencing, 3D modeling, digital elevation model, and stereo matching [3][4]. Many algorithms, either region-based approaches or feature-based approaches, have been proposed to improve the results of stereo vision.
Although feature-based methods have achieved a lot in the field of computer vision in recent years, most contemporary applications, especially remote sensing and photogrammetry, require dense disparity information which is attained by region-based matching methods [5][6]. According to the recent survey [5], the region-based method employs scan-line algorithms, dynamic programming algorithms, graph-cut algorithms, and belief propagation algorithms, and there is also a need for dense disparity information. Sub-regioning method [7] produces a dense disparity map by using rectangular sub-regioning (RSR) and two-stage
dynamic programming (TSDP). Others [8][9][10]
have also studied this algorithm for much greater benefit. However, while most methods perform well to Middlebury benchmark and others, in tests on small-size image files, there is a lack of experience in applying them to large-scale data sets under uncontrolled conditions [11]. In this paper, we present an empirical study on stereo matching for large-scale high-resolution satellite images. Dynamic programming is used to overcome the complexity of the computation. It also enables us to find the global minimum for independent scan-line in polynomial time [12]. The fast calculation of 3D correlation coefficient cube is proposed in [7] by using rectangular sub-regioning (RSR) and two-stage dynamic programming. The computation of a dense 3D cube produces the problem of insufficient memory when dealing with large-scale images. Integrating the principle in [7] with overlapped tiling technique, we divide the huge stereo satellite images and apply the process of stereo matching in order to overcome this problem.
As a result, the experimental results shows that the suggested method enables capability to perform stereo matching of large scale satellite images, whereas most methods concentrate on small size images.
II. Conventional Methods for the Evaluation of Cross Correlation
2.1 Fast Cross-Correlation
A fast cross-correlation method [8] is proposed by using box-filtering techniques [13]. The original formula to calculate cross correlation between windows in the stereo images f and g using a disparity value of d is:
(1) where covariance is transformed like this:
(2)where is the intensity value of an M x N image at position and i, j are the image
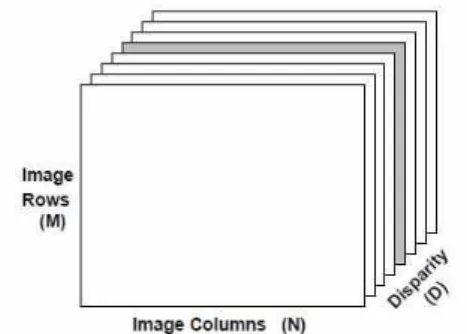
row and column indices. We have the same definition for right image . The disparity indicates possible disparity value. and are the mean values within the local windows of size K x L. Fig. 1 from [8] illustrates the 3D cube of correlation coefficient between left and right image.
Fig. 1. An illustration of the 3D correlation coefficient volume 2.2 Quad-tree sub-regioning (QSR)
Because we calculate correlation for all possible disparity values, the correlation values of the whole image will cost O(MND) computation complexity.
Sun [7][8] proposed a rectangular sub-regioning in which we just have to work with a sum of sub-regions, which are segmented from the whole image. The aim of the sub-regioning process is to segment the image so that points with a similar range of disparity value are grouped into sub-regions. In this way, the computation complexity is
working with subimages. Obviously, the
is smallerthan especially when the disparity changes a lot within a whole image, so working with subregions requires smaller memory usage.
Fig. 2. Size and shape of the 3D correlation volume using RSR
Fig. 2 describes size and shape of the 3D correlation volume by using rectangular sub-regioning. However, rectangular sub-regioning is not flexible enough to accommodate the fluctuation of disparity value. It only achieves an accurate disparity map if objects in each sub-region of the scene have a maximum disparity of no more than ten pixels [9]. Our algorithm exploits quad-tree decomposition to achieve more accurate sub-regioning. By using quad-tree presentation, segmenting disparity values do not have to be stuck to only a horizontal direction or a vertical direction In Fig. 3, left image is a disparity map at a particular image pyramid, while right image is the disparity map represented by quad-tree. The quad-tree sub-regioning method [10] is based on cost function to determine whether a region should be split or merged. Our algorithm orients to a huge size image file, so that we segment a region into small regions by using a threshold-based homogeneity check, which is used in the split-merge process for the quad-tree sub-regioning.
This implementation allows us to save time and computing resources.
Fig. 3. Quad-tree sub-regioning
2.3 Maximum surface in the volume
Fig. 4 illustrates the 3D maximum surface in the volume, which gives the maximum accumulation of values in the 3D cross correlation coefficient volume. The algorithm is from [7] where they propose two-stage dynamic programming to find out shortest paths from a 3D correlation coefficient cube. The shortest path is representation of the most reliable disparity value of points in the image.
The first stage is to calculate the maximum summation of in the vertical direction for each slide from top to bottom of the 3D volume.
max ≤ (3)
Fig. 4. The illustration of the 3D maximum-surface
where determines the number of local values that need to be checked and
(4)
Fig. 5 shows how to obtain the volume.
Right part of Fig. 5 illustrates the positions of the Y values at each iteration.
Fig. 5. Obtaining the Y(i,j,d) volume.
The second stage obtains the disparity map. The procedure of the second stage is as follows:
- Starting from the bottom slice of the 3D volume Y, obtain the shortest-path from left to right (similar to stage 1 but in a different direction).
- The sum of values along the obtained path gives the maximum value, which is also the maximum summation value along the whole 3D surface.
- Move from the bottom slice of Y upwards.
- Calculating the disparity, mask out the values which are more than p position away from the shortest-path of the previous slice.
III. Integration of Overlapped Tiling Technique
3.1 The concept of overlapped tiling
In the field of stereo matching, particularly region-based matching, Normalized Cross Correlation
is most widely used for its simplicity and reliability.
However, it is sensitive to significant scale, rotation and shearing between the images to be correlated.
Although fast cross correlation and maximum 3D surface show their efficiency on computing, they still suffer from heavy memory loading when applying the computation for the whole large-scale high resolution satellite image. This situation inspired us to integrating the current algorithm to the tiling technique. By dividing the huge size image into sub-images and refining the usage of memory, we could solve the problem of large-scale satellite image with least memory resource. Fig. 6 gives an illustration of our overlapped tiling process.
Fig. 6. Overlapped tiling technique.
Because of mask-filtering which is a rectangular window, to calculate the correlation between two images, we used overlapped tiling, which creates ghost region around each tile that contains a copy of the element of the neighbor tiles needed for the computation [14]. The primary part of a sub-image will have an added boundary depending on the position of the sub-image in the whole image.
3.2 Implementation of overlapped tiling method It is noteworthy that the disparity value between two images (respectively called reference image and target image or left and right image) can be either a positive number (which indicates the disparity to the right) or a negative number (which indicates the disparity to the left). Accordingly, we use the variable [disparity_Range] for the whole range of disparity and [index_Shift] for a negative range of disparity.
Fig. 7. Overall procedure
To improve algorithm from [7], we establish the procedure for the stereo matching of large-scale high resolution satellite imagery by using the overlapped tiling method.
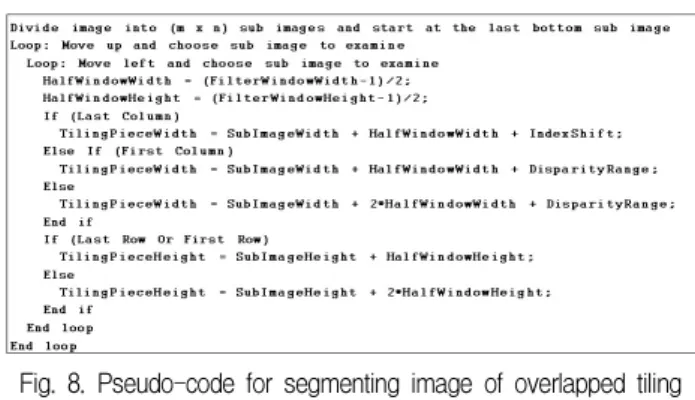
Fig.7 describes our overall procedure. Step 1 and step 2 mention the well-known coarse-to-fine pyramid scheme, which was also clearly described in [7][8]. Now we will consider step 3 in more detail. After dividing the image into sub images, we begin from the last bottom part and take it for further examination. The sub image will have the necessary boundary added, depending on its position. In step 4, each pair of sub images of the two images will be applied to all the algorithms mentioned in the previous sections. Then we move to the top and left direction and repeat the process of matching for new sub images. Fig. 8 is pseudo-code for segmenting an image into sub-images and adding any necessary boundary.
Fig. 8. Pseudo-code for segmenting image of overlapped tiling method
After matching each pair of sub-images in step 4, we get a sub disparity map. In step 5, we draw
that sub disparity map into the corresponding part forming the disparity map of the whole image.
Because we process each pair sequentially, whenever its process is finished, the memory requirement for that pair is released so that the next pair can fully exploit the memory resource fully. This on-the-fly usage of memory allows us to use the least memory resource, sequentially. The process will be repeated by the condition in step 6.
We get the result and finish in step 7.
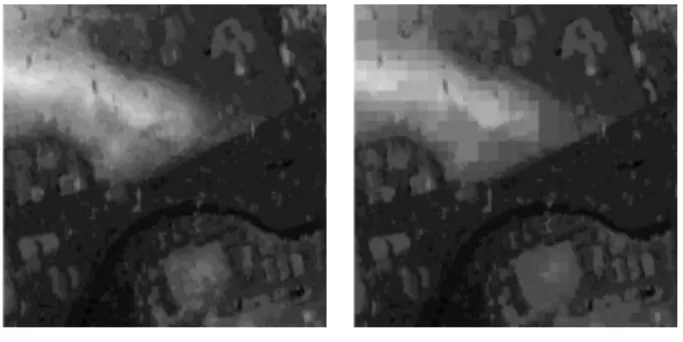
Segmenting an image into sub-images may affect the smoothness of the whole image. To prevent this effect, when calculating disparity, we take a reference to the disparity result of the top row of the previous sub disparity map. Besides, dynamic programming can find the global minimum for an independent scan-line in polynomial time, but has a problem with the inter-scan-line [15]. We observed that a small threshold value of homogeneity check in the quad-tree sub-regioning could be used to decrease the streaking effect. In addition, a bigger value of p in (3) can also prevent the streaking effect between two sub-images. In Fig. 9, the left image shows streaking effect when we have threshold=16 of homogeneity check in quad-tree sub-regioning and p=1, when the right image shows no streaking effect when we have threshold=8 of homogeneity check in quad-tree sub-regioning and p=2.
Fig. 9. Disparity map with streaking (left image) and without streaking effect (right image).
IV. Experiments
In this section, we present an experiment with large-scale high resolution images of DaeJeon (Korea). The size of each image is 11004 x 11004 of pixels. The matching process needs stereo images
epipolar-resampled so we perform piece_wise linear epipolar resampling with the system we developed at Myongji University. After that, an epipolar image pair is cropped to the size of 8192 x 8192 of pixels.
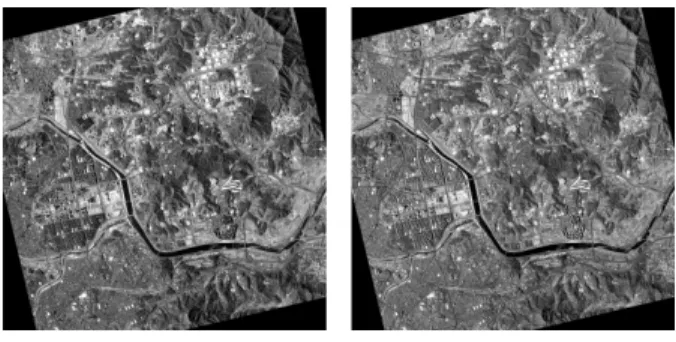
Fig. 10 Reference (left) image and Target (right) image of DaeJon area
Fig. 10 is the reference image and target image of DaeJon area (South Korea). Their epipolar images are presented in Fig. 11. The cropped images of those epipolar images are in Fig. 12.
Fig 11 Reference (left) epipolar image and Target (right) epipolar image of DaeJon area.
Fig. 12 Cropped Reference (left) epipolar image and Target (right) epipolar image of Daejon area
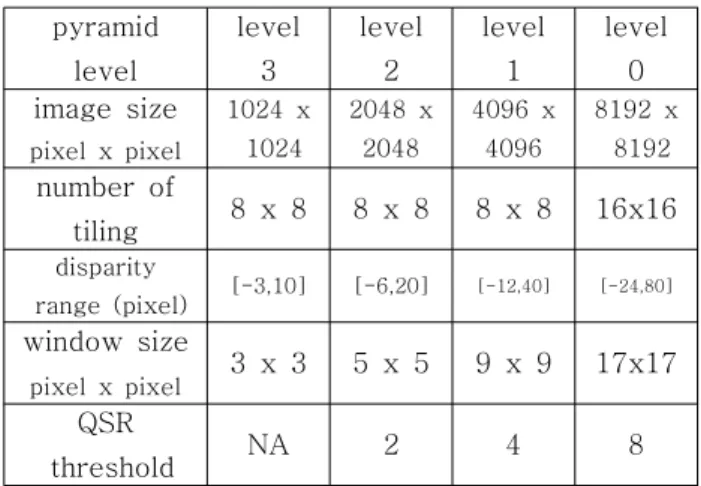
We use 4 levels of pyramid scheme (from level 3 to level 0) to perform the stereo matching process.
Then we use (8 x 8) tiling pieces for level 3, 2, 1 and (16 x 16) tiling pieces for level 0. That means,
for instance, in final level 0, we divide image with size (8192 x 8192) into (16 x 16) sub images, then add boundary for each sub image, so that we have (16 x 16) overlapped tiling pieces. At level 3, the disparity range [-3, 10] spreads from -3 (disparity towards the left) to 10 (disparity toward the right).
That is proportional to [-6, 20], [-12, 40], [-24, 80]
at level 2, 1, and 0 respectively. The sizes of the mask filtering window are (3 x 3) for level 3, (5 x 5) for level 2, (9 x 9) for level 1, (17 x 17) for level 0. The threshold values of disparity homogeneity in Quad-tree Sub-regioning are 2, 4, 8 for level 2, 1, and 0 respectively. Table 1 presents experiment parameters with the images.
Table 1. Experiment parameters with high resolution stereo images of DaeJeon (SouthKorea)
pyramid level
level 3
level 2
level 1
level 0 image size
pixel x pixel
1024 x 1024
2048 x 2048
4096 x 4096
8192 x 8192 number of
tiling 8 x 8 8 x 8 8 x 8 16x16 disparity
range (pixel) [-3,10] [-6,20] [-12,40] [-24,80]
window size
pixel x pixel 3 x 3 5 x 5 9 x 9 17x17 QSR
threshold NA 2 4 8
Analyzing 350 points randomly scattered over an image, we get acceptable accuracy. The disparity result attains an RMS of around 0.5459. Table 2 presents the results of experiment in more detail.
Fig. 13 shows the disparity maps obtained at pyramid level 3, 2, 1 and 0 respectively.
Fig. 13 (d) shows the final disparity map at level 0 (8192 x 8192). An image of size 8192 x 8192 will require 28GB (8192 x 8192 x 104 x 4) of memory to calculate a float cube of 3D correlation coefficient. It is obviously an excess requirement. Dividing the image into (16 x 16) sub images needs just around 109 MB (512 x 512 x 104 x 4) for each sub image.
For the boundary of overlapped tiling pieces, the memory requirement also does not exceed 148 MB for one piece. However, as a region-based approach with cross correlation calculation, we also have a
problem with textureless region. Other features which can cause program to generate erroneous results are a repeating pattern and occlusion.
Table 2. Experiment results
Image size (pixel x pixel) 8192x8192
RMS of disparity result 0.5459
Number of tiling pieces 16x16
Sub image size (pixel x
pixel) 512x512
Disparity range (pixel) 104[-24,80]
Window size (pixel x pixel) 17x17 Maximum overlapped tiling
piece width (pixel) (512+2x17+104)=650 Maximum overlapped tiling
piece height (pixel) (512+2x17)=546
Memory for processing each sub image (MB)
512x512x104x4=109 MB
Memory for processing each overlapped tiling piece (MB)
650x546x104x4=148 MB
(a) level 3 (b) level 2
(c) level 1 (d) level 0
Fig. 13. Disparity maps at four levels
V. Conclusion
We have presented a new method to do stereo matching for large-scale satellite images. Taking advantage of dynamic programming from an original algorithm, we experimented with large-scale images
which have huge size. By integrating a tiling technique, we can solve the problem of memory excess. We have also exploited a quad-tree sub-regioning algorithm to improve the results of stereo matching. The quad-tree sub-regioning is implemented in an efficient way with threshold-based sub-regioning. In addition, because of the memory requirement for processing a big image, the algorithm should release memory right after the processing of each sub part is finished.
However, with a quite large range of disparity (about 104), our algorithm still has a time consuming problem, as it wants to compute a dense disparity map. Other disadvantages, normally from the region-based approaches, include getting lost in a textureless region, or producing error result in a repetitive and occluded region. All these kinds of problem have been addressed by many researchers.
However, they solved problems with small sized benchmark images. We believe in the near future, more researches on all these kinds of problems will be done for huge size images. Integrating existing techniques to tiling, and seeing if we can solve the problem in a short time may also be an interesting direction.
References
[1] Vincent Tao and Yong Hu, “3D reconstruction methods based on the Rational Function Model”, Photogrammetric Enginerring & Remote Sensing, Vol.
68, No. 7, pp. 705-71, July 2002
[2] Barbara Zitová and Jan Flusser, “Image registration methods: a survey”, Image and Vision Computing, Vol. 21, pp. 977-1000, 2003
[3] G. Gupta, M. S. Rawat and R. Bhagava, “Region growing stereo matching method for 3D building reconstruction”, Int. J Computational Vision and Robotics, Vol. 2, No. 1, pp. 89-98, 2011
[4] Hae-Yeoun Lee, Taejung Kim, Wonkyu Park and Heung Kyu Lee, “Extraction of digital elevation models from satellite stereo images through stereo matching based on epipolarity and scene geometry”, Image and Vision Computing, Vol. 21, pp. 789- 706, 2003
[5] Nalpantidis Lazaros, Georgios Christou Siraloulis
& Antonios Gasteratos, “Review of stereo vision
algorithm: From software to hardware”, International Journal of Optomechatronics, Vol. 2, No. 4, pp.
435-462, 2008
[6] Zhen Xiong and Yun Zhang “A novel interest-point-matching algorithm for high-resolution satellite images”, IEEE Transaction on Geoscience and Remote Sensing, Vol. 47, No. 12, pp. 4189-4200, December 2009
[7] Changming Sun, “Fast stereo matching using rectangular subregioning and 3D maximum-surface techniques”, International Journal of Computer Vision.
Vol. 47, pp. 99-117, May 2002
[8] Changming Sun, “Multi-Resolution Rectangular Subregioning stereo matching using fast correlation and dynamic programming techniques” CMIS Report No. 98/246, December 1998
[9] Arturo Donate, Xiuwen Liu, and Emmanuel G.
Collins, Jr., “Efficient path-based stereo matching with subpixel accuracy”, IEEE Transactions on Systems, Man, and Cybernetics, Vol. 41, No. 1, pp.
183-195, February 2011
[10] Carlos Leung, Ben Appleton and Changming Sun,
“Iterated dynamic programming and quadtree subregioning for fast stereo matching”, Image and Vision Computing, Vol. 26, pp. 1371-1383, 2008 [11] Andreas Geiger, Martin Roser, and Raquel Urtasun, “Efficient large-scale stereo m,atching”, Proceeding of the 10th Asian conference on Computer vision - Volume Part 1. pp. 25-38, 2010
[12] Daniel Scharstein and Richard Szeliski, “A taxonomy and evaluation of dense two-frame stereo correspondence algorithms”, International Journal of Computer Vision, Vol. 47, pp. 7-42, 2002
[13] M. J. McDonnell, "Box-filtering techniques", Computer Graphics and Image Processing, vol. 17, pp.
65-70, 1981
[14] Jia Guo, Ganesh Bikshandi, Basilio B. Fraguela, Maria J. Garzarán and David Padua, “Programming with tiles”, Proceeding of the 13th ACM SIGPLAN Symposium on Principles and practice of parallel programming, pp. 111-122, 2008
[15] Daniel Scharstein and Richard Szeliski, “A taxonomy and evaluation of dense two-frame stereo correspondence algorithms”, International Journal of Computer Vision, Vol 47, pp. 7-42, 2002
Dong-Min Woo (Member)
1980 : BS degree in Electronic Engineering, Yonsei University.
1982 : MS degree in Electronic Engineering, Yonsei University.
1987 : PhD degree in Electrical Engineering, Case Western Reserve University.
1990~ present : Professor, Myongji University
BIOGRAPHY
An Nguyen Hong (Member)
2008 : BS degree in Computer Science, Ho Chi Minh City University of Industry
2005 : MS degree in Electronics Engineering, Myongji
University.2013~ present : R&D Engineer, FPT IS Soft in Vietnam.