Kinetics of Oil-Proof Agent Adsorption onto Cellulose Fibers
Hongxiang Zhu
1,2,3Zeng Honghu
3,Shuangfei Wang
†1,2, Hak Lae Lee
2(Received October 21, 2009: Accepted December 17, 2009)
•1 School of Light Industrial and Food Engineering, Guangxi University, Nanning, Guangxi,China,
2 Department of Forest Sciences, College of Agriculture and Life Sciences, Seoul National University, 151-921, Seoul , Korea)
3 The Guangxi Key Laboratory of Environmental Engineering Protection and Assessment, China)
† Corresponding Author: Email address: [email protected]
ABSTRACT
Adsorption of an oil-proof agent (OPA)onto cellulose fibers during the papermaking process was investigated using UV-Vis spectrophotometry by measuring the OPA concentration decrease in the solution. From the calibration curve, the spectrum were converted to chemical concentrations in solution, from which the amount adsorbed onto the fiber surface could be determined. Thus, it was possible to determine the total amount adsorbed onto the fibers and in solution. Using this approach, we studied the adsorption behavior of the OPA onto the fiber surface and derived its ,
Γ Γ
st= s∞(1−e
-k ta). The values of the parameters kaand Γs∞ were determined using a mathematic model based on a mass transfer equation.Ultimately, a complete was derived: m1 i i A (1
e
-k ta) / Ni
M A
Q
α πd l
=
= ⋅
∑
⋅ ⋅ − .Keywords : oil-proof agent (OPA); spectrophotometer; fiber surface; adsorption kinetics
1. Introduction
Diverse chemicals are widely used in papermaking processes for controlling the electrical charge of the furnish and improving the retention, drainage, strength, and sizing of the paper products. These wet end additives are generally added to the papermaking furnish and adsorbed onto the fibers or other papermaking components. Adsorption onto the pulp fibers is most common in papermaking [1, 2].
However, it is difficult to describe the actual adsorption and desorption processes of high-molecular-
weight polymers with simple kinetics equations due to their complexity. Most modern polymer materials are heterogeneous and often have two or more phases and massive contact surfaces [3]. Compared with low-molecular-weight compounds, interface phenomena in these polymers are common, as their molecular weights are very high, resulting in polymolecularity and uneven molecular weight distribution. When adsorbed onto solid surfaces, very large polymers require a long time to reach equilibrium, and some never do. Due to these factors, traditional kinetics equations describe high-molecular-weight polymer
Fig. 1. Experimental equipment for the adsorption process.
180 200 220 240 260 280 300
0.00324 0.00401 0.0057 0.0107 0.0168 0.25008 0.97087
Spectral intensity, A
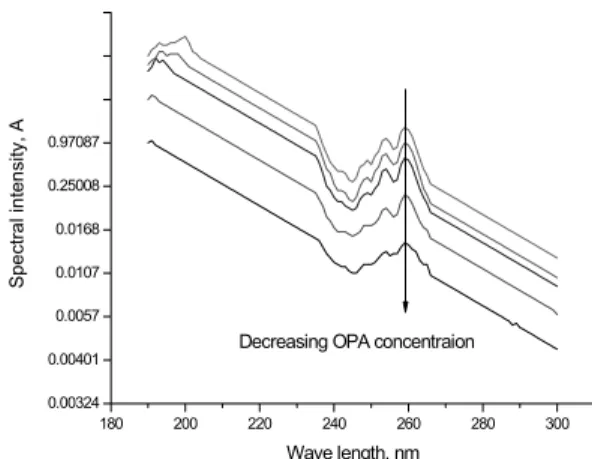
Wave length, nm Decreasing OPA concentraion
Fig. 2. Typical time-dependent UV/VIS absorption spectrum of OPA in solution.
adsorption and desorption processes only at the most general level.
It is critical to determine the adsorption behavior of polymers at certain points in the process, such as after the polymer solution and the fiber dispersion have been mixed together. Kinetic factors clearly influence papermaking processes and directly affect paper properties; therefore, the development of a more accurate adsorption kinetics equation will provide better control of wet processes. The equation developed in this study has important theoretical value as well as practical significance in the pulping and papermaking industry.
2. Experimental
2.1 Materials
The pulp was obtained from an NSI company. The oil-proof agent (OPA) was a laboratory sample provided by Bossco Industries (Houston,TX,USA).
2.2 Apparatus
The primary apparatus and detection systems we used to carry out our experiments are shown in Fig. 1.
2.3 Methods
An aliquot of dry pulp was taken and defibered into
individual fibers. After washing with deionized water, the fiber slurry was diluted to 0.6% (w/w of dry pulp), and the concentration of OPA in the beaker was 80 ppm. The pulp suspension was placed in a 100-mL beaker on a magnetic stirrer with a stirring speed of 400 rpm. To prevent fine fibers from getting into the pipeline and affecting the absorption signal, a 200-mesh screen was placed at the inlet of the peristaltic pump. When the peristaltic pump was switched on, the solution began to circulate at a flow rate of 9 mL/min. A spectrophotometer was used to measure absorption every second for 10 min.
3. Results and Discussion
3.1 Analytical techniques
3.1.1 OPA UV spectrumAs shown in Fig. 2, as the OPA adsorbed onto the fibers in the suspension, the concentration of OPA in the solution decreased. In addition, a characteristic peak appeared at a wavelength of 260 nm, which can easily be detected by an ultraviolet spectrometer.
Based on the concentration of OPA in solution, the amount of OPA adsorbed onto the fibers was able to be quantitatively determined.
0 100 200 300 400 0.0
0.2 0.4 0.6 0.8 1.0 1.2 1.4
UV spectral intensity at 260nm, A
Y = 0.00403 + 0.00311 * X
inear Regression for Data1_B:
Y = A + B * X Parameter Value Error ---
A 0.00403 0.00184
B 0.00311 9.98143E-6
---
R SD N P
--- 0.99995 0.00449 12 <0.0001 ---
OPA concentration, ppm
Fig. 3. Calibration curve for OPA in the standard solution.
0 100 200 300 400 500 600
0.06 0.08 0.10 0.12 0.14 0.16 0.18 0.20 0.22 0.24 0.26
UV spectral intensity , A
Adsorption time, second
UV spectral intensity at 260 nm
Fig. 4. Time-dependent UV/VIS absorption spectra for OPA.
0 100 200 300 400 500 600
20 30 40 50 60 70 80
OPA Concentration in Solution
Adsorption time, second
Concentration of OPA in Solution,ppm
Fig. 5. Time-dependent concentration of OPA in solution.
0 100 200 300 400 500 600
0.000 0.002 0.004 0.006 0.008 0.010 0.012
Adsorbed OPA on ODF,g/g ODF
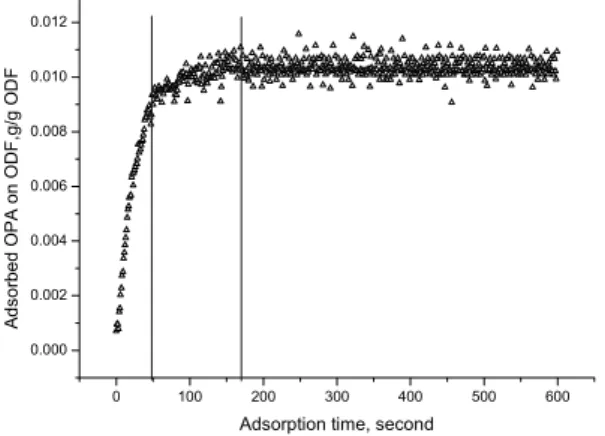
Adsorption time, second
Fig. 6. Time-dependent adsorption of OPA onto oven-dried fiber.
3.1.2 Standard calibration curves
A series of spectrum absorption values at 260-nm wavelength was obtained with changing concentrations of OPA in the solution. The relationship between concentration and absorption was linear, as shown in Fig. 3. From the calibration curve, we determined the OPA concentration in the solution, which in turn allowed us to calculate how much OPA had been adsorbed onto the fibers.
3.2 Adsorption studies
Fig. 4 depicts the UV/Vis absorption spectra for OPA. The absorption value decreased sharply over the first 50 seconds and then remained constant, indicating that the adsorption of OPA onto fibers is a rapid
process. From the spectral intensities, a concentration curve for OPA in solution was obtained (Fig. 5). Based on the concentration of OPA in solution, the amount of OPA adsorbed onto the fibers was calculated according to Eq. (1):
0 t
t
ODF
(C -C ) V
B M
= ×
(1) where:
Bt = amount of OPA adsorbed onto the fiber surface at seconds, g/g oven-dried fibers (ODF)
C0 = initial concentration of OPA in solution, g/L Ct = concentration of OPA in solution after adsorption for t seconds, g/L
V = total volume, L MODF = dry pulp mass, g
Using this equation, a plot of the time-dependent
0 100 200 300 400 500 600 0.000
0.002 0.004 0.006 0.008 0.010 0.012
Adsorbed OPA on ODF,g/g ODF
Adsorption time, second
Fig. 7. Adsorption rate curve for OPA onto ODF.
0.000 0.002 0.004 0.006 0.008 0.010 0.012
-0.0010 -0.0005 0.0000 0.0005 0.0010
dΓ
s t/dt
Γs t Y=4.11632E-4-0.03982X
Linear Regression for Data1_B:
Y = A + B * X Parameter Value Error ---
A 4.11632E-4 7.56018E-5
B -0.03982 0.00753
---
R SD N P
--- -0.21216 2.36434E-4 596 <0.0001 ---
Fig. 8. Adsorption rate and amount of OPA adsorbed onto ODF.
adsorption of OPA onto ODF was obtained (Fig. 6).
3.3 Kinetic studies
3.3.1 Adsorption behavior analysis
With respect to interactions that occur at the interface between the and adsorbent, adsorption onto solid surfaces can be divided into two broad categories: physisorptionandchemisorption.Physical adsorption occurs when van der Waals forces induce non-selective and rapid adsorption of the adsorbate onto the adsorbent with reversible characteristics.
During chemisorption, however, there are electronic transfers, exchanges, or sharing with the solid surface atoms or molecules to form chemical bonds, which generally produces heat of adsorption [4].
The obtained adsorption rate curve (Fig. 7) for OPA onto ODF can be divided into three phases. The initial phase (about 50 seconds) was characterized by rapid, single-molecular-layer adsorption, in which diffusion primarily controls the adsorption rate. In this stage of adsorption, the OPA concentration in solution decreased quickly and adsorption onto the fibers increased sharply due to the rapid adsorption rate. In the second stage of adsorption from 50 to 170 seconds, the adsorption rate was rather slow. The driving force for this slower adsorption process appeared to be capillary infiltration of the OPA molecules into the fibers. In the third stage of adsorption after 170
seconds, equilibrium was reached.
Because no chemical reaction occurs between OPA and the fibers, the adsorption of OPA onto the fiber surface is a physisorption process. Therefore, we were able to derive adsorption parameters and establish a mathematical model based on a mass transfer dynamic equation.
3.3.2 Development of the kinetic mathematical model
In the adsorption process, the mobile phase contacts the fiber surface with a certain velocity or velocity distribution. Therefore, the flow pattern (laminar or turbulent flow) will affect the thickness of the layer around the fiber and the diffusion process. Depending on the material transfer process, the expressions for the concentration gradient and driving force will differ.
When there is a concentration gradient between the mobile phase and the adsorbed phase, adsorption kinetics based on first order linear driving forces are the simplest and most commonly used, and can be described as the concentration differential between the mobile phase and the boundary layer.
Diffusion through the boundary liquid film was assumed such that the mass action rate equation for adsorption kinetics and the diffusion equation for diffusion through the boundary liquid film are the
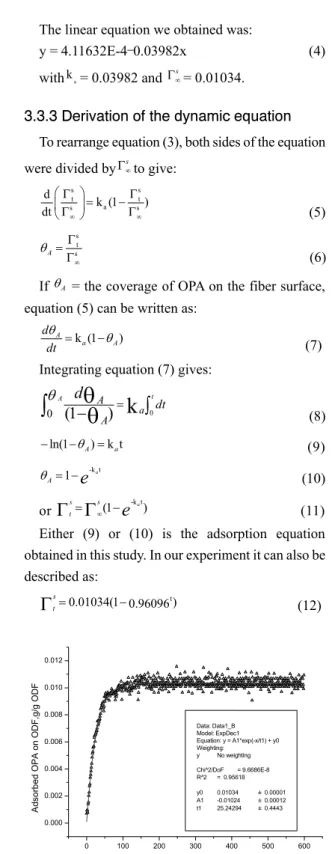
0 100 200 300 400 500 600 0.000
0.002 0.004 0.006 0.008 0.010 0.012
Data: Data1_B Model: ExpDec1 Equation: y = A1*exp(-x/t1) + y0 Weighting:
y No weighting
Chi^2/DoF = 9.6686E-8 R^2 = 0.95618
y0 0.01034 ±0.00001
A1 -0.01024 ±0.00012 t1 25.24294 ±0.4443
Adsorbed OPA on ODF,g/g ODF
Adsorption time, second
Fig. 9. Linear fit of the experimental data.
same, and can be described using the pseudo-first order rate equation of Lagergren. In this expression, if diffusion through the film is rate-controlling, the constant in the equation will vary inversely with the particle size and the film thickness; if the exchange rate is chemically controlled, the constant in the equation will be independent of particle diameter and flow rate and will depend only on the concentrations of the ions in solution and the temperature [5].
According to the kinetic Lagergren-Eldridge rate equation [6]:
) ( dt k
d s
t s a s
t = Γ −Γ
Γ
∞ (2) or alternatively:
s s
t s t
a s
d k (1 )
dt ∞ ∞
Γ = Γ −Γ
Γ (3) where:
s
d t
dt Γ
= Absorption rate onto the fiber surface, (g/g ODF)/s
t
Γs= The relative adsorption of OPA on the fiber surface at time t, g/g ODF
ka= The first order rate constant for the adsorption process, s-1
s
Γ∞= The maximum relative adsorption of OPA, g/g ODF
Theoretically, we can fit a line for d / dtΓst and Γst using the slope ka and intercept Γs∞ that were determined.
As shown in Fig. 8, the adsorption rate rapidly reaches a maximum in the first few seconds, and then gradually reduces until it fluctuates around a constant level. These results demonstrate that at the beginning of the adsorption process, there are many adsorption sites available, and the adsorption capacity has little effect on the adsorption rate. After the point, the adsorption rate gradually decreases as more adsorption sites become occupied, and finally reaches dynamic equilibrium once the sites are full.
The linear equation we obtained was:
y = 4.11632E-4–0.03982x (4) withka= 0.03982 and Γs∞= 0.01034.
3.3.3 Derivation of the dynamic equation To rearrange equation (3), both sides of the equation were divided byΓs∞to give:
s s
t t
s a s
d k (1 )
dt ∞ ∞
⎛Γ ⎞= −Γ
⎜Γ ⎟ Γ
⎝ ⎠ (5)
s t A s
θ
∞
=Γ
Γ (6) If θA = the coverage of OPA on the fiber surface, equation (5) can be written as:
k (1 )
A
a A
d dt
θ = −θ (7)
Integrating equation (7) gives:
0A(1 A)
k
a 0tA
d dt
θ =
−
θ ∫
∫ θ
(8) ln(1 θA) k ta− − = (9) 1 -k ta
A
e
θ = − (10) or
Γ Γ
st= s∞(1−e
-k ta) (11) Either (9) or (10) is the adsorption equation obtained in this study. In our experiment it can also be described as:0.01034(1 0.96096t)
s
t= −
Γ
(12)3.3.4 Verification of the equation parameters Linear fitting of the experimental data gives results consistent with equation (11), as shown in
Similarly, the parameterska= 0.03962 and Γs∞= 0.01024 can be obtained from the experimental data.
The results for these parameters are nearly the same as those derived mathematically, which verifies our theoretical equations.
4. Discussion
In actuality, Γst as expressed in the equation is a relative quantity. The true value for the adsorption capacity onto the fiber is related to the weight of the fibers (oven-dried), or WODF.Thus,equation(11) can be written in following form:
-k t
(1 a) WODF
Q=Γ∞s −
e
g (13) Fundamentally, Γs∞ is determined by the number of adsorption sites on the fiber surface, which can be expressed as follows:s N A
ODF
n M A
∞ W
⋅
Γ = (14) Where:
n = the number of adsorption sites on the fiber surface
MA=averagemolecularweightofOPA AN=Avogadroconstant
Currently, regardless of the technique used, ncannotbeeasilydetermined.However,fiberareaismor estronglyrelatedtothenumberofadsorptionsitesthanfi berweight.Therefore,thefiberareacanbeusedrathertha nfiberweight:
n= ⋅α S (15) where:
S = fiber area, S2
α = fiber interface active grade, which varies with the species and beating freeness.
Combining equations (14) and (15) gives equation (16):
s A
ODF N
S M
W A
α
∞= ⋅ ⋅
Γ ⋅
(16) Fiber length and width can be easily measured using a fiber analyzer such as the Kajaani FS-300. If we assume the fibers are column-shaped, the fiber area can be calculated as follows:
1 m i i i
S π
d l
=
=
∑
(17) where:m = number of fibers per unit mass d = width of the fibers
l = length of the fibers
Combining equations (13), (16), and (17), the complete adsorption kinetics equation can be written as:
-k t 1
(1
e
a) /m
A N
i i i
M A
Q
= ⋅α∑
= πd l
⋅ ⋅ − (18)5. Conclusions
1) The adsorption process of OPA onto the pulp fiber surfaces can be divided into three stages.
2) The first order reaction model has a very good correlation with the observed data for OPA adsorption onto the pulp fiber surfaces.
3) A dynamic adsorption equation was developed to represent this process:
-k t 1
(1
e
a) /m
A N
i i i
M A
Q
α πd l
=
= ⋅
∑
⋅ ⋅ − .Acknowledgements
This work was supported by Guangxi Science Foundation for the Youth, Contract No. 0832005 and the Research funds of The Guangxi Key Laboratory of Environmental Engineering,Protection and Assessment,Contract No. 0804K016.
Literature Cited
1. Alexander Shulga, etc., AuweterKinetics of adsorp- tion of polyvinylamine on cellulose fibers: I.
Adsorption from salt-free solutions,Journal of Colloid and Interface Science, Volume 258, 219-227 (2003).
2. Fatehi, P. and Xia,H., Adsorption characteristics of cationic-modified poly (vinyl alcohol) on cellulose fibers–A qualitative analysis,Colloids and Surfaces A: Physicochemical and Engineering Aspects, Volume 327, 127-133 (2008).
3. Lipatov, Y.S., Shumsky, V.F. and Babich, V. F., Adhesion at the polypropylene/liquid crystalline pol- ymer blend-glass interface, Int. J. Adhesion and Adhesives 16: 109-112 (1996).
4. Zhao, Z., Adsorption Application Principle, Chemical Industry Press, Beijing, p. 63 (2005).
5. Ho, Y. S. and McKay, G., Pseudo-second order mod- el for sorption processes, Process Biochemistry, 34(5):451-465 (1999).
6. Batzias, F.A. and Sidiras, D.K., Simulation of dye ad- sorption by beech sawdust as affected by pH, Journal of Hazardous Materials, 141(3): 668-679 (2007).