Auto-compatibility Analysis for Ka-band payload of COMS
Jae Woo Park1, Seong Pal Lee1, Myung-Jin Baek2
요 약
2009년 발사예정인 우리나라가 개발한 최초의 정지궤도위성 COMS에는 기상센서, 해양센서 및 Ka대역 통신탑재체등 세 개의 탑재체가 실리며 해양센서 및 기상센서의 측정데이타를 전송하기위한 L대역 통신중계기가 있다. 또한 S대역의 원격 측정 및 원격명령서브시스템과 Ka대역 비콘등이 있다. Ka대역 통신탑재체는 스위칭 중계기로서 부품의 우주인증 및 재난 통신서비스에 활용될 전망이다. 또한 Ka대역 비콘은 지상국 안테나의 포인팅 및 강우감쇠 실험을 포함한 Ka대역 전송실 험에 활용될 예정이다. 본 논문은 L대역 센서데이타 전송용 중계기 및 S 대역 원격명령/측정 서브시스템의 RF 복사가 Ka 대역 중계기 및 비콘에 어떤 영향을 주며, Ka밴드 비콘이 L 대역 및 S 대역 중계기에 어떤 영향을 주는지 조사하였다.
중계기들의 상향/하향 링크시 출력, 안테나들의 기하학적 위치 및 거리 및 중계기들에 포함되어 있는 필터들의 rejection 그리고 편파에 의한 degradation factor등을 포함하여 coupling factor를 고려하여 상호 호환성을 고려하였 다. 분석결과 L대역 및 S대역 중계기에 의한 Ka대역 탑재체에 대한 영향은 미미한 것으로 계산되었으며, Ka대역 비콘의 영향도 무시할 정도임을 밝혔다.
키워드: 통신해양 통신해양기상위성, Ka 대역 통신탑재체, 복사 상호 호환성
ABSTRACT The first geostationary satellite made by Korea, COMS, has the three different payload ; Meteorological sensor, Oceanographic sensor and Ka-band communication payload. There are Meteorological & Ocean Data Communication Subsystem(MODCS) and Telemetry, Command and Ranging Subsystem(TC&R) as other RF radiation sources. MODCS transmits and receives Meteo and Ocean measurement data from/to earth using L-band and TC&R using S-band. The Ka-band communication payload will provide high-speed multimedia services and communication services for natural disaster such as prediction, prevention, and recovery services in the government communications network. Ka-band beacon is for the earth antenna pointing and the experiment of rain fading.
This paper gives the analysis results about the mutual radiation effect on Ka-band communication payload, Ka- band beacon, MODCS and TC&R. Up/Down link power and coupling factor including the geometrical position and distance of antenna, filter rejection and degradation factor due to the different polarization are considered. The results show MODCS and TC&R are compatible for Ka-band communication payload and Ka-band beacon does not interfere with MODCS and TC&R normal operation.
Key Words : COMS, Ka-band communication payload, Radiation auto-compatibility
I. Introduction
COMS is the one of the most complicated geostationary spacecraft over the world. There are three different payloads for various missions, multimedia communication, meteorological and oceanic monitoring.
Auto-compatibility means the RF compatibility among the radiating sources. There are several RF radiating source in COMS including Ka-band communication antenna and feeder, Ka-band beacon transmitter, Telemetry & Telecommand subsystem(TC&R) and Image data communi- cation subsystem(MODCS). In this paper the RF
compatibility analysis among the following sources are shown;
― Ka-band Communication Payload and COMS subsystem(TCR & MODCS)
― Ka-band Beacon Transmitter and COMS subsystem(TCR & MODCS)
II. COMS Configuration and RF Compatibility The top floor layout which needs to be considered is given Figure 1.
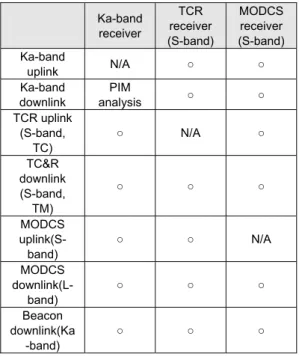
Generally auto-compatibility analyses for COMS to be considered are summarized in Table 1.
* 1 Global Area Wireless Technology Research Group, Electronics Telecommunications Research Institute 161 Gajeong-dong, Yuseong-gu, Daejeon, 305-700, KOREA Email: [email protected], [email protected]
2
Figure 1. Outside RF environment of COMS
Table 1. Summary of Auto-compatibility for COMS Ka-band
receiver
TCR receiver (S-band)
MODCS receiver (S-band) Ka-band
uplink N/A ○ ○
Ka-band downlink
PIM
analysis ○ ○ TCR uplink
(S-band, TC)
○ N/A ○
TC&R downlink (S-band, TM)
○ ○ ○
MODCS uplink(S- band)
○ ○ N/A
MODCS downlink(L-
band)
○ ○ ○
Beacon downlink(Ka
-band)
○ ○ ○
Here the effects on Ka-band receiver of other sources and the effects on TC&R and MODCS of Ka-band beacon are only considered.
III. RF Auto-compatibility Analysis 3.1 Ka-band Payload Rx Compatibility with TC
uplink signal
TCR ground station EIRP is estimated to 70dBW. With free space loss(-189.6 dB) and Ka- band antenna maximum gain(~48dBi), TCR signal at Ka-band antenna will be -71.6dBW. Moreover with considering input loss to receiver and
injection by input filter this is sufficiently compatible with Ka-band receiver.
3.2 Ka-band Payload Rx Compatibility with TM downlink signal
This section is dedicated to verifying that Ka- band receiver is compatible with TCR S-band downlink signal. According to the layout West reflector can be affected by +Z TM antenna.
Figure 2 shows the geometry between TC&R antenna and west reflector.
Figure 2. Geometry between TCR antenna and Ka-band Reflector(West)
The coordinates of two antenna, distance between two antennas and angle of view can be found in Table 2.
Table 2. Geometry parameters of TCR antenna and Ka-band reflector
Items Parameters Values S/C
Coordinates TCR antenna
X(m) = -1.203 Y(m) = 0.866 Z(m) = 3.084 Ka-band
reflector(West)
X(m) = -1.512 Y(m) = 0.303 Z(m) = 0.753 Tilt angle of
TCR antenna 25 deg
Distance(D) 2.4 m
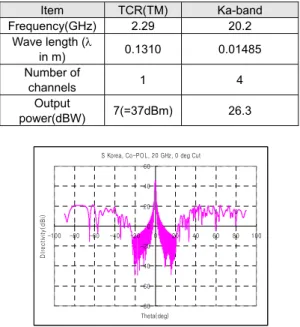
Angle of view TCR to Ka (α) 148 deg Ka to TC&R (β) 8 deg Before calculating the coupling factor, the basic data for two antennas are summarized in Table 3. Antenna gains according to angle of view are obtained from Figure 3. Ka-band antenna can be considered to have same pattern in west and east side antenna.
α S-band
Antenna
Z
Y X Tilt angle
β
Ka-band Reflector (West) MODCS
Transmitting Antenna (L-band) Beacon
Transmitter (Ka-band)
West Reflector Antenna (Ka-band)
Ka-band Feeder
East Reflector Antenna (Ka-band)
TCR antenna (S-band)
MODCS receiving Antena (S-band)
Table 3. Characteristics of TM antenna and West Ka-band reflector
Item TCR(TM) Ka-band Frequency(GHz) 2.29 20.2
Wave length (λ
in m) 0.1310 0.01485
Number of
channels 1 4
Output
power(dBW) 7(=37dBm) 26.3
Figure 3 Ka-band Antenna Pattern
The coupling factor(CF) between two antennas is estimated by the formula (1) and the result is evaluated in Table 4.
CF=GTC(α)+GKa(β)-20*log(4πD/λ)–DF (1)
G means gain and DF is degradation factor due to different polarization scheme between two systems. 3dB is for the linear to circular polarization transformation as minimum value which is applied to the others as worst case.
Table 4 Coupling Factor for TCR to Ka-band
Item Value
GTM(148°) -13dBi
GKa(8°) - 3 dBi Free space loss :
20*log(4πD/λ) 47dB
DF 3dB Coupling Factor(CF) -66 dB
Minimum input loss of Ka-band payload which is consist of cable loss between diplexer and IFA(Input Filter Assembly) and filter injection of IFA is about -96 dB. Finally total power at Ka-band receiver will be -152 dB. This is under of specification (-30dBW). So, Ka-band payload is compatible with TM downlink signal of TC&R subsystem.
3.3 Ka-band Payload Rx Compatibility with MODCS uplink signal
MODCS ground station EIRP is estimated to 57dBW. With free space loss (-189.6 dB) and Ka- band antenna maximum gain(~48dBi) MODCS signal at Ka-band antenna will be -84.6dBW.
Moreover with considering input loss to receiver and injection by input filter this is sufficiently compatible with Ka-band receiver.
3.4 Ka-band Payload receiver Compatibility with MODCS downlink signal
This section is dedicated to verifying that Ka- band receiver is compatible with MODCS L-band downlink signal. Figure 4 shows the geometry between L-band antenna and east reflector.
Figure 4 Geometry between L-band MODCS antenna and Ka-band Reflector(East)
The coordinates of two antenna, distance between two antennas and angle of view can be found in Table 5.
Table 5 Geometry parameters of MODCS antenna and Ka-band reflector (East)
Items Parameters Values S/C
Coordinates
L-band MODCS antenna
X(mm) = 0.204 Y(mm) = 0.373 Z (mm) = 2.984 Ka-band
reflector(East)
X(mm) = 1.512 Y(mm) = 0.303 Z (mm) = 0.753
Distance(D) 2.6 m
Angle of view
MODCS to Ka
(α) 149 deg Ka to MODCS
(β) 30 deg Before calculating the coupling factor, the basic data for two antennas are summarized in Table 6. Antenna gains of two antennas according
S Korea, Co-POL, 20 GHz, 0 deg Cut
-80 -60 -40 -20 0 20 40 60
-100 -80 -60 -40 -20 0 20 40 60 80 100
Theta(deg)
DIrectivity(dBi)
α
L-band Antenna
Ka-band Reflector (East)
Z
Y X
β
to angle of view are obtained from Figure 3 and Figure 5 respectively.
Table 6. Characteristics of TM antenna and Ka-band reflector (East)
Item MODCS Ka-band
Frequency(GHz) 1.7 20.2
Wave length (λ in m) 0.1765 0.01485 Number of chnnels 1 4 Output power(dBW) 8.2 26.3
Figure 5. L-band MODCS antenna Pattern
The coupling factor(CF) between two antennas is estimated by the formula (1) and the result is evaluated in Table 7.
Table 7. Coupling Factor for MODCS to Ka-band
Item Value
GMODCS(149°)* <-35dBi (=G(90°))
GKa(30°) 10dBi
Free space loss :
20*log(4πD/λ) 46dB
DF 3dB Coupling Factor -74dB
Minimum input loss of Ka-band payload which is consist of cable loss between diplexer and IFA and filter injection of IFA is about -96 dB. Finally total power at Ka-band receiver will be -162 dB.
This is under of specification (-30dBW). So, Ka- band payload is compatible with L-band MODCS downlink signal.
3.5 Ka-band payload receiver compatibility with Beacon signal
This section is verifying that Ka-band beacon transmitting signal is compatible with Ka-band communication payload. According to the layout West reflector can be affected by beacon antenna.
Figure 6 shows the geometry between Beacon antenna and West reflector.
Figure 6. Geometry between Ka-band Beacon antenna and Ka-band Reflector(West)
The coordinates of two antenna, distance between two antennas and angle of view can be found in Table 8.
Table 8. Geometry parameters of Beacon antenna and Ka-band reflector (West)
Items Parameters Values S/C
Coordinates
Beacon antenna
X(mm) = -0.873 Y(mm) = 0.800 Z (mm) = 2.875 Ka-band
reflector (West)
X(mm) = -1.512 Y(mm) = 0.303 Z (mm) = 0.753
Distance(D) 2.3 m
Angle of view
Beacon to
Ka (α) 163deg Ka to
Beacon(β) 17 deg
Before calculating the coupling factor, the basic data for two antennas are summarized in Table 9. Antenna gains of two antennas according to angle of view are obtained from Figure 3 and Figure 7 respectively.
Table 9. Characteristics of Beacon antenna and Ka- band reflector (West)
Item Beacon Ka-band Frequency(GHz) 19.8 20.2 Wave length (λ in
m) 0.01515 0.01485 Number of
chnnels 1 4
Output
power(dBW) 22 26.3
The coupling factor(CF) between two antennas is estimated by the formula (1) and the result is evaluated in Table 10.
α
β
Ka-band Reflector (West) Z
Y X Ka-band Beacon
Figure 7. Beacon antenna Pattern
Table 10. Coupling Factor for Beacon to Ka-band
Item Value
Gbeacon(163°) <-35dBi =G(90°)
GKa(16°) 0 dBi
Free space loss : 20*log(4πD/λ) 66dB
DF 3dB Coupling Factor -104 dB
Minimum input loss of Ka-band payload which is consist of cable loss between diplexer and IFA and filter injection of IFA is about -96 dB. Finally total power at Ka-band receiver will be -177 dB.
This is under of specification (-30dBW). So, Ka- band payload is compatible with Beacon transmitting signal.
3.6 TCR receiver Compatibility with Beacon signal This section is verifying that Ka-band beacon transmitting signal is compatible with TCR receiver. Figure 8 shows the geometry between TCR antenna and Beacon antenna.
Figure 8. Geometry between Ka-band Beacon antenna and TCR antenna
The coordinates of two antenna, distance between two antennas and angle of view can be found in Table 11.
Before calculating the coupling factor, the basic data for two antennas are summarized in Table 12. Antenna gains of two antennas
according to angle of view are obtained from Figure 4 and Figure 9 respectively.
Table 11. Geometry parameters of Ka-band Beacon antenna and TCR antenna
Items Parameters Values S/C
Coordinates
Beacon antenna
X(mm) = -0.873 Y(mm) = 0.800 Z (mm) = 2.875 S-band TCR
antenna
X(mm) = -1.203 Y(mm) = 0.866 Z (mm) = 3.084
Distance(D) 0.40 m
Angle of view Beacon to
TCR (α) 58 deg TCR to
Beacon(β) 57 deg
Table 12. Characteristics of Ka-band Beacon antenna and TCR antenna
Item Beacon TCR
Frequency(GHz) 19.8 2.29
Wave length (λ
in m) 0.01515 0.1310
Number of
chnnels 1 1
Output
power(dBW) 22 7(=37dBm)
The coupling factor(CF) between two antennas is estimated by the formula (1) and the result is evaluated in Table 13.
Table 13. Coupling Factor for Beacon to TCR
Item Value
Gbeacon(58°) <3dBi (maximum gain)
GTCR(57°) -22 dBi
Free space
loss:20*log(4πD/λ) 50 dB
DF 3dB Coupling Factor -72dB
Minimum input loss of TCR is about -4.6 dB which is the case in the L-band. However in case of Ka-band this will be larger. So this value is considered as worst case. Finally total power at TCR receiver will be -55 dB. This is under of specification (-30dBW). So, TCR receiver is compatible with Beacon transmitting signal.
3.7 MODCS receiver Compatibility with Beacon signal
This section is verifying that Ka-band beacon transmitting signal is compatible with MODCS receiver. Figure 9 shows the geometry between MODCS receive antenna and Beacon antenna.
S-band Antenna Ka-band
Beacon
α Z
Y X
β
Figure 9. Geometry between Ka-band Beacon antenna and MODCS antenna
The coordinates of two antenna, distance between two antennas and angle of view can be found in Table 14.
Tableau 14 Geometry parameters of MODCS antenna and Beacon antenna
Items Parameters Values S/C
Coordinates
Beacon antenna
X(mm) = -0.873 Y(mm) = 0.800 Z (mm) = 2.875 S-band
MODCS antenna
X(mm) = -0.204 Y(mm) = 0.373 Z (mm) = 2.984
Distance(D) 0.8 m
Angle of view Beacon to
MODCS (α) 80 deg MODCS to
Beacon(β) 99 deg Before calculating the coupling factor, the basic data for two antennas are summarized in Table 15. Antenna gains of beacon antennas according to angle of view are obtained from Figure 7.
Table 15. Characteristics of MODCS antenna and Beacon antenna
Item Beacon MODCS (S-band)
Frequency(GHz) 19.8 2.0
Wave length (λ in m) 0.01515 0.15 Number of channels 1 1 Output power(dBW) 22 -
The coupling factor(CF) between two antennas is estimated by the formula (1) and the result is evaluated in Table 16.
Minimum input loss of MODCS is about -20 dB which is the case in the S-band. However in case of Ka-band this will be larger. So this value is considered as worst case. Finally total power at
MODCS receiver will be -78 dB. This is under of specification (-30dBW). So, MODCS receiver is compatible with Beacon transmitting signal.
Table 16 Coupling Factor for Beacon to MODCS
Item Value
Gbeacon(80°) -35 dBi
GMODCS(99°) <16dBi (=nominal gain)
Free space
loss:20*log(4πD/λ) 56 dB
DF 3dB Coupling Factor -76 dB
IV. Conclusion
So far the effect of RF sources in COMS including TCR and MODCS on Ka-band communication payload is analyzed. Uplink and downlink RF powers of each source are investigated and are transformed based on their distance and geometry in spacecraft. Lastly coupling factors between two radiating sources are calculated and the power losses of input section are considered.
In the result Ka-band payload is compatible with all radiating equipment such as TCR, MODCS and Beacon in COMS. Moreover TCR and MODCS are compatible with Ka-band beacon transmitter.
Acknowledgement
This work was supported by IT R&D Program of MIC/IITA. [2007-S301-03 Development of Satellite Communication System for COMS]
References
[1] COMS Critical Design Review Data Package, ASTRIUM SAS, 2007
[2] Final Design Review Data Packages of Ka- band Payload, ETRI, 2006.
S-band Antenna
Ka-band Beacon α
β Z
Y X
저 자 박 재 우(Jae Woo Park) 정회원
1990년 2월:한국전자통신 연구소
위성관제시스템 연구원
1997년 7월:러시아 과학 아카데미 우주연구소
박사 2000년 4월~현재:
한국전자통신연구원 통신위성시스템연구팀 책임연구원
<관심분야>위성임무분석,위성체시스템 설계
이 성 팔(Seong-Pal Lee) 정회원
광역무선기술연구그룹 통신위성시스템연구팀 팀장
백 명 진(Myung-Jin Baek) 1984년 2월: 한양대학교
기계 공학과 졸업 1987년 6월: Drexel Univ.
기계공학과 석사 1992년 10월: Drexel Univ.
기계공학과 박사 1993년 3월∼현재: 한국항공 우주연구원 재직
<관심분야> 자동제어공학, 인공위성시스템 개발