⃝2017. The Korean Astronomical Society. All rights reserved. c https://doi.org/10.5303/PKAS.2017.32.1.141
STUDY OF CO
2/H
2O ICE ABUNDANCE RATIOS IN NEARBY GALAXIES WITH THE AKARI NEAR-INFRARED SPECTROSCOPY
Mitsuyoshi Yamagishi
1, Hidehiro Kaneda
1, Shinki Oyabu
1, Daisuke Ishihara
1, Takashi Onaka
2, Takashi Shimonishi
3, and Toyoaki Suzuki
41
Graduate School of Science, Nagoya University, Furo-cho, Chikusa-ku, 464-8602 Nagoya, Japan
2
Graduate School of Science, The University of Tokyo, 7-3-1 Hongo, Bunkyo-ku, 113-0033 Tokyo, Japan
3
Graduate School of Science, Kobe University, 1-1 Rokkodai, Nada-ku, Kobe 657-8501, Japan
4
SRON Netherlands Institute for Space Research, Sorbonnelaan 2, 3584 CA Utrecht, The Netherlands E-mail: [email protected]
(Received September 14, 2016; Revised Novemer 15, 2016; Accepted Novemer 15, 2016)
ABSTRACT
We study CO
2/H
2O ice abundance ratios in nearby galaxies using AKARI near-infrared slit spec- troscopy. Past studies of the ices intensively examined CO
2/H
2O ratios mainly in our Galaxy, and found that there were considerable variations in the CO
2/H
2O ratios from object to object. The cause of the variations is, however, still under debate. As a result of the analysis of our sample that includes 1031 regions in 158 galaxies, the CO
2/H
2O ratios are in a range of 0.05–0.30. In the dataset, we find that the CO
2/H
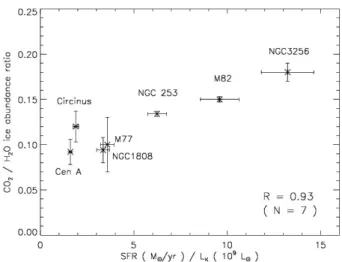
2O ratios positively correlate with the Brα/PAH 3.3 µm ratios which reflect the massive star formation activity. Furthermore, we find that the CO
2/H
2O ratios positively correlate with the specific star formation rates of the galaxies where the ices are detected, that reflect the evolutionary stage of a galaxy. These results suggest that the CO
2/H
2O ratios are enhanced in active star-forming regions and young galaxies.
Key words: infrared - galaxies: ISM - molecules
1. INTRODUCTION
In the universe, interstellar ices are formed on the sur- face of dust grains in dense (n
H∼ 10
4cm
−3) and low- temperature (T ∼ 10 K) molecular clouds. Observa- tionally, absorption features due to ices are seen in near- and mid-infrared spectra. It is widely known that abun- dances of ices are sensitive to the interstellar environ- ment such as radiation field, temperature, and chem- istry. In this study, we focus on H
2O and CO
2ices, which are the most abundant ones among various ice species and show the absorption features at 3.05 µm and 4.27 µm, respectively. Several formation processes have been proposed for H
2O and CO
2ices. For example, H
2O ice is thought to be formed through the following reactions (Cuppen & Herbst, 2007; Oba et al., 2012;
http://pkas.kas.org
Miyauchi et al., 2008);
H + OH → H
2O, (1)
OH + H
2→ H
2O + H, (2)
O
2+ H → HO
2, (3)
HO
2+ H → H
2O
2, (4)
H
2O
2+ H → H
2O + OH. (5) It was confirmed by the laboratory experiments that these processes progress with no energy input at tem- perature of ∼10 K. By contrast, CO
2ice is thought to be efficiently formed through the following reaction (Watanabe & Kouchi, 2002);
H
2O + CO + hν → CO
2+ 2H. (6)
In this process, UV irradiation to H
2O and CO ices is
essential. Focusing on these formation processes, it is
141
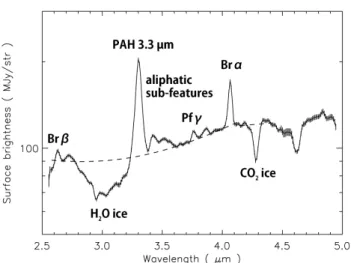
Figure 1. An example of the AKARI near-infrared spectra for NGC 253. The dashed curve represents the best-fit con- tinuum.
possible that UV radiation field changes CO
2/H
2O ice abundance ratios.
The ices in our Galaxy have been studied intensively (e.g., Gibb et al., 2004; Pontoppidan et al., 2008; Aikawa et al., 2012). As a result, it was found that there were considerable variations in the CO
2/H
2O ratios from ob- ject to object, but the cause of the variation is still un- clear. In the observations of Galactic regions, the variety of the interstellar environment is rather limited. In or- der to examine CO
2/H
2O ratios in detail, it is crucial to observe a wide range of the interstellar environment.
In this paper, based on systematic study of the ices in nearby galaxies with AKARI, we examine variations in the CO
2/H
2O ratios utilizing the characteristics of the ice formation processes.
2. OBSERVATION AND DATA ANALYSIS
We used near-infrared slit spectroscopic data obtained using the AKARI/IRC in a wavelength range of 2.5–5.0 µm. We analyzed all the observed data of 158 galaxies located at z < 0.03. All the data were taken from the AKARI archives
1. We determined the number of the spectra to be extracted from a slit aperture on the basis of the intensity of a target. As a result, we extracted 4–10 spectra from a slit and obtained 1031 spectra in total. Figure 1 shows an example of the observed spec- tra, which shows several prominent features; absorption features due to H
2O ice at 3.05 µm and CO
2ice at 4.27 µm, emission features due to polycyclic aromatic hydro- carbons (PAHs), and hydrogen recombination lines.
We performed spectral fitting calculations for all the
1
http://darts.jaxa.jp/astro/akari/
H
2O ice
Wavelength 2.5–4.1 µm
Absorption pure H
2O ice at 10 K
aContinuum multi-temp. blackbody
(200, 400, 800, 1600, 3200 K) Emission PAH 3.3 µm, aliphatic sub-features,
Brα, Brβ, Pfγ CO
2ice
Wavelength 4.1–4.4 µm
Absorption H
2O:CH
3OH:CO
2=9:1:2 at 10 K
aContinuum linear function
Emission None
a
Profile taken from Ehrenfreund et al., (1996).
spectra, and evaluated the column densities of H
2O and CO
2ices one by one. The wavelength ranges and spec- tral components used in the fitting model are summa- rized in Table 1. By using the components, we fitted the absorption, continuum, and emission components simultaneously. The following function was used for the fitting:
I
obs=
( ∑
i
a
iI
icont)
× exp(−τI
abs) + ∑
j