• 검색 결과가 없습니다.

The Impact of Food Quality on Experiential Value, Price Fairness, Water Park Image, Satisfaction, and Behavioral Intention in Context of Water Park

N/A
N/A
Protected

Academic year: 2021

Share "The Impact of Food Quality on Experiential Value, Price Fairness, Water Park Image, Satisfaction, and Behavioral Intention in Context of Water Park"

Copied!
9
0
0

로드 중.... (전체 텍스트 보기)

전체 글

(1)

¶ Corresponding Author: Sang-Mook Lee, Dept. of Foodservice Management, Kyungsung University, 309 Suyeong-ro, Nam-gu, Busan 608-736, South Korea, Tel. +82-10-663-4474, Fax. +82-51-627-6830, E-mail: [email protected]

Culinary Science & Hospitality Research. 2016;22(1):87-95.

https://cshr.jams.or.kr/ ISSN  2466‐0752  (Print) ISSN  2466‐1023  (Online)

The Impact of Food Quality on Experiential Value, Price Fairness, Water Park Image, Satisfaction, and Behavioral Intention in Context of Water Park

Sang-Mook Lee

Dept. of Foodservice Management, Kyungsung University

ABSTRACT: The purpose of current study is to develop and estimate a proposed model that explains the potential relationships among food quality, experiential value, price fairness, image, satisfaction, and behavioral intention in context of water park. In addition, the study will verify how these factors link to each other. Results show that food quality is a significant antecedent of experience value, price fairness, water park image. Also, the experiential value and water park image influence on visitors' satisfaction.

Last, the satisfaction is critical predictor of behavioral intention. These findings will contribute to under- stand the consumers' perception about water park, and how derives the customer satisfaction and beha- vioral intention. In sum, present study will serve insights for industry marketers and managers in water park segment.

Keywords: water park, food quality, experiential value, price fairness, water park image, satisfaction, be- havioral intention

INTRODUCTION

Twenty years ago first water park, Caribbean Bay, opened in South Korea and it is becoming one of popular places for leisure activities. Korea National Statistical Office reported that around 40 water parks now operate in 2011, and the water park busi- ness steadily increasing and growing in the past years. In addition, previosu study informed that the average annual revenue of water parks business in- creased more than 40% compare to past decade[1].

Although water park industry is keep growing in South Korea, few studies have been conducted to find any significant elements that influence on cus- tomers in context of water park.

In previous studies, various key factors have been identified that directly impact on visitors' satisfaction

from diverse studies such as tourism, foodservice, and other hospitality industry[2,3,4,5]. Identifying a critical factor that can influence profit and derive positive perception from customer becomes the most important work in both academic and industry filed. Therefore, water park sector also needs to find any significant elements that impact on future busi- ness to maximize revenue as well as improve cus- tomer preference.

In order to get higher evaluation of general expe-

rience, prior research emphasized the importance of

food quality as an critical factor in various areas[3,

6,7,8]. For instance, Quan and Wang found that food

is one of key factors that may contribute to lead

positive experience and valuable memory among

tourists[8]. In addition, food quality has been dem-

onstrated the most important component in context

(2)

of foodservice industry[9,10]. These studies identi- fied that food quality is a critical predictor to lead positive satisfaction and behavioral intention, and directly connect to consumer perceptions of val- ue[10,11,12]. Namely, the present study suggested that the food quality can be significant component for increasing perceived experience, value, percep- tion, satisfaction as well as behavioral intention to recommend the water park or revisit same desti- nation.

To date, however, previous studies just estimated simple relationships among antecedents, satisfac- tion, and loyalty in water park sector[1,13]. There- fore, the ultimate purpose of the this study is to identify the importance of food quality as a main an- tecedent, and to evaluate the relationships among food quality and other critical variables: price fair- ness, experiential value, water park image, satisfac- tion, and behavioral intention, in water park seg- ment.

LITERATURE REVIEW

Food Quality

In previous research, food is estimated as an cri- tical component in various service sector including foodservice and hospitality area since it is closely linked to important dependent variables such as sa- tisfaction, loyalty, behavioral intention[3,6,7]. Prior researchers employed various element to measure the quality of food. Namkung & Jang used tastiness, menu variety, serving size, menu design, temper- ature for measuring the food quality in restaurant sector[9]. Not only foodservice area, but also the food has been considered as an important reason to decide a destination for tourists. For example, Quan & Wang reported that food experience is one of critical factors to improve satisfaction and recom- mend the place to other among tourists[8]. In addi- tion, prior study demonstrated that food quality was essential antecedent of customer emotion and sa- tisfaction as well as visitors' loyalty among festival participants[7]. In sum, the food quality has been considered a significant predictor that related to other critical variables such as perceived value, expe- rience, satisfaction, and behavioral intention[11,12].

Nowadays, water park provide various service along

with playing facilities such as restaurants, cafe, thea- ter, and so on. Therefore, this study proposed that the food quality may contribute to improve overall value, water park image, and satisfaction as per- ceived by water park visitors.

Experiential Value

Experience is an essential factor and it was influ- enced by consumers' various feelings through en- countering diverse experiences[14,15,16]. In other words, people may make decisions when they pur- chase a product or service after considering the val- ue based on their experiences such as pleasure, feel- ing, or overall quality[17,18]. Experience value repre- sent the psychological aspect resulting from con- sumers[19], and it can be affected various physical characteristics such as food quality as well.

Experiential value consists of experience-based val- ues and water park provide numerous experiences to improve visitors' experiences such as food quality, physical facilities, and interaction with employee[9, 20,21]. Also, all these elements are closely related to business success and improving positive experi- ences. Therefore, current study has been employed the experiential value as a significant factor that re- lated physical element such as food quality, and emotional factor such as perceived price fairness, water park image, and satisfaction.

Price Fairness

In South Korea, many water park business keep

growing and people are trying to visit better water

park by comparing overall service including reason-

able price. In previous study, price fairness has been

defined as a customer's general assessment and as-

sociated emotions of whether the price is reason-

able, acceptable, or justifiable by comparing selling

price and the other comparative price[22]. In hospi-

tality sector, perceived price has been recognized as

a critical factor in decision making and it signifi-

cantly influenced on customers purchase beha-

viors[23,24,25]. In addition, in behavioral studies, ac-

ceptable price is an important predictor for evaluat-

ing and understanding the consumers' level of sa-

tisfaction as well as future behaviors. Therefore, the

perceived price can be directly influenced by visi-

tors' perception of experience or provided product

(3)

quality such as food.

Water Park Image

A number of researchers empirically demonstra- ted that image is a critical component for determin- ing customer perceptions, satisfaction as well as fu- ture behavioral action or intentions[11,26,27]. For in- stance, Andreassen and Lindestad suggested that the company image significantly affects tourists' sa- tisfaction, perceived quality, and loyalty[26]. Futher- more, Chen identified that consumers’ experience is very important element influencing customers’ im- pression of the destination[11]. In other words, if a visitor get a satisfactory image it can change the overall perception of the destination. In present stu- dy, thus, water park image refers to visitors’ general perceptions about the water park, and it may be af- fected by prior experiential value, provided products or service in the ware park.

Satisfaction and Behavioral Intention

Customer satisfaction has been recognized as a key determinant variable that directly link to long- term consumer behavior. In numerous previous stu- dies, additionally, customer satisfaction was impor- tant mediator between principle antecedents and behavioral intention[11,28,29]. Particularly, previous studies have concentrated on the experiential side along with other components to better understand customers' future behavior or intention in various sector[18,30,31,32]. Moreover, previous researchers shown that destination image could be an essential clue that related to customer satisfaction[33]. Even though earlier studies demonstrated the relation- ships among experiential value, water park image, perceived price fairness, and satisfaction that were derived from experiential factors, conceptualizing the logical links among the variables for water park segmentation is very insufficient.

In academic research, the behavioral intention has been identified as a final determinant factor. In the studies, behavioral intention indicates an personal efforts to achieve a finial goal and it was a principle predictor of consumers' future action[34,35].

Thus, this study verifies the relationships among food quality, experiential value, price, water park im- age, and satisfaction as perceived by water park

visitors.

METHOD

A survey was developed from previous studies to estimate food quality, experiential value, price fair- ness, water park image, satisfaction, and behavioral intention[18,36,37,38,39,40]. Total eighteen items em- ployed to assess the six factors by using 7-point Likert-type scale (1: strongly disagree to 7: strongly agree), and three items were employed for collect- ing demographic information. To collect survey con- venience sampling method was used. Five research assistants visited a water park located in middle of South Korea, and they distributed the survey after explaining the general purpose of current study at the water park.

RESULTS

Empirical Results

All participants answered the survey based on personal experiences at the water park. Total 400 questionnaires collected and 376 responses were used for data analysis after removing incomplete samples. More than half of respondents were female (63%), and various age groups visited the water park between teenagers to senior. Majority of age groups were 21~30-year olds (51.9% of respondents) and 31~40-year olds (20.7% of respondents). In addition, around 56% respondents visited the water park with friends.

Measurement Model

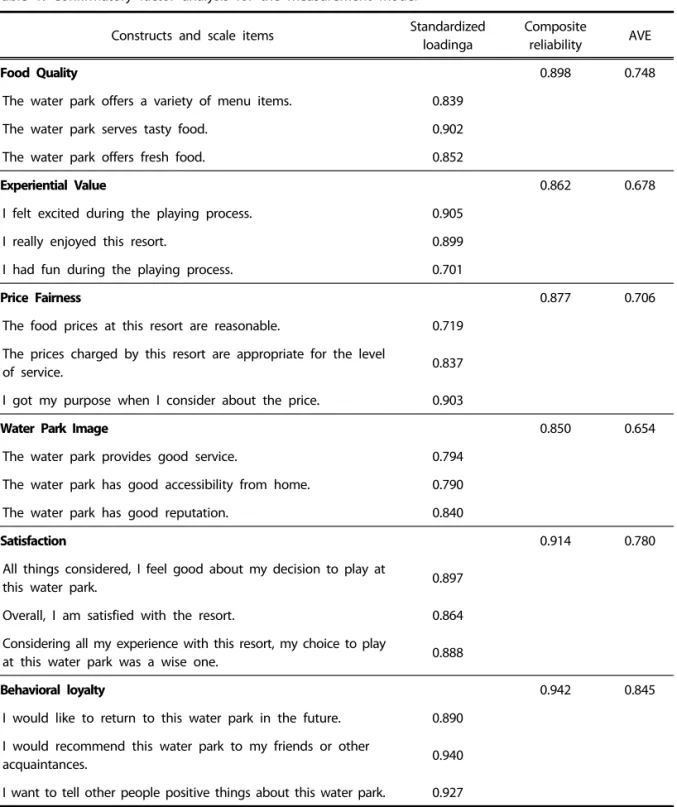
The Table 1 shows that the factor loading for all

items are greater than 0.701 (p<0.001), and indi-

cators for all items loaded on the designed con-

structs (Table 1). Average Variance Extracted of all

constructs are higher than the standard which is

0.50[41], so that the convergent validity was con-

firmed[42]. Discriminant validity can be identified

when each squared correlation (R

2

) was less than the

each constructs' AVE score[42]. All discriminant vali-

dity have been verified except for correlations bet-

ween “water park image and satisfaction.” To iden-

tify the discriminant validity for this exceptions, two

constructs combined to make a single construct to

(4)

Constructs and scale items Standardized loadinga

Composite

reliability AVE

Food Quality 0.898 0.748

The water park offers a variety of menu items. 0.839

The water park serves tasty food. 0.902

The water park offers fresh food. 0.852

Experiential Value 0.862 0.678

I felt excited during the playing process. 0.905

I really enjoyed this resort. 0.899

I had fun during the playing process. 0.701

Price Fairness 0.877 0.706

The food prices at this resort are reasonable. 0.719 The prices charged by this resort are appropriate for the level

of service. 0.837

I got my purpose when I consider about the price. 0.903

Water Park Image 0.850 0.654

The water park provides good service. 0.794

The water park has good accessibility from home. 0.790

The water park has good reputation. 0.840

Satisfaction 0.914 0.780

All things considered, I feel good about my decision to play at

this water park. 0.897

Overall, I am satisfied with the resort. 0.864

Considering all my experience with this resort, my choice to play

at this water park was a wise one. 0.888

Behavioral loyalty 0.942 0.845

I would like to return to this water park in the future. 0.890 I would recommend this water park to my friends or other

acquaintances. 0.940

I want to tell other people positive things about this water park. 0.927

a.

All factor loadings are significant (p<.001).

Table 1. Confirmatory factor analysis for the measurement model

perform a χ

2

difference test on the hypothesized original measurement model and the combined alternative model[41]. The result shown that g χ

2

differences was 89.532 (df=5) and it represents that the differences was significant at p<0.001. Therefore,

discriminant validity among all the pairs of cons-

tructs were confirmed. In addition, Hair and his co-

lleague suggested 0.70 as a minimum level for the

reliability of each construct to check internal consis-

tency of items[43], and all constructs of composite

(5)

FQ PF EV WI SA BL

FQ 0.748

a


PF 0.298 0.678        

EV 0.203 0.135 0.706      

WI 0.362 0.321 0.416 0.653    

SA 0.289 0.232 0.564 0.767 0.780  

BL 0.255 0.186 0.549 0.613 0.769 0.845

χ

2

=256, d.f.=120, IFI=0.976, TLI=0.969, CFI=0.976, RMSEA=0.055 FQ=Food qaulity; PF=Price fairness; EV=Experiential value; WI: Water park image.

SA=Satisfaction; BL=Behavioral loyalty;

IFI=Incremental fit index; TLI=Tucker-lewis index; CFI=Comparative fit index;

RMSEA=Root Mean Square Error of Approximation.

Note.

a

AVE is on the diagonal. Squared of paired constructs are on the off-diagonal.

Table 2. Confirmatory factor analysis and discriminant validity

Hypothesized path Coefficient t-value Results

Hypothesis 1: Food quality → Experiential value 0.449 8.227*** Supported Hypothesis 2: Food quality → Price fairness 0.488 7.482*** Supported Hypothesis 3: Food quality → Water park image 0.401 7.559*** Supported Hypothesis 4: Experiential value → Price fairness 0.158 2.719** Supported Hypothesis 5: Experiential value → Water park image 0.467 8.795*** Supported Hypothesis 6: Experiential value → Satisfaction 0.355 7.646*** Supported Hypothesis 7: Price fairness → Satisfaction 0.016 0.432 Not Supported Hypothesis 8: Water park image → satisfaction 0.640 11.172*** Supported Hypothesis 9: Satisfaction → Behavioral loyalty 0.890 20.448*** Supported

χ

2

=291.374, d.f.=126, IFI=0.971, TLI=0.964, CFI=0.970, RMSEA=0.059.

Table 3. Structural parameter estimates

reliabilities verified appropriate level. Last, confir- matory measurement models show the soundness of measurement properties (χ

2

=256; df=120; p<

0.001; Comparative Fit Index (CFI)=0.976; Tucker Lewis Index (TLI)=0.969; normed fit index (NFI)=

0.955, and root mean square error of approximation (RMSEA)=0.055) (Table 2).

Structural Equation Modeling

The proposed model identifies an good model fit to the data (χ

2

=291.374; df=126; p<0.001; Com-

parative Fit Index (CFI)=0.970; Tucker Lewis Index (TLI)=0.964; normed fit index (NFI)=0.949, and root mean square error of approximation (RMSEA)=

0.059). Table 3 shows the path coefficients for all hypothesized paths in current model and Figure 1 presents the paths visually. All the path coefficients in the model were significant and positive except one path between price fairness and satisfaction.

Therefore, empirical support attends all the hypo-

theses except one path. Specifically, the results de-

monstrate the proposed effects of food quality on

(6)

Figure 1. Result of hypothesized paths.

experiential value (Hypothesis 1: β=0.449; t=8.227), price fairness (Hypothesis 2: β=0.488; t=7.482), and water park image (Hypothesis 3: β=0.401; t=7.559).

In addition, results confirms the proposed effect of experiential value on price fairness (Hypothesis 4: β

=0.158; t=2.719), and water park image (Hypothesis 5: β=0.467; t=8.795). Furthermore, customer satisfac- tion was significant predictor of experiential value (Hypothesis 6: β=0.355; t=7.646), and water park image (Hypothesis 8: β=0.640; t=11.172). Apparently, satisfaction has a critically influence on behavioral intention (Hypothesis 9: β=0.890; t=20.448). How- ever, the price fairness was not significant antece- dent of satisfaction (Hypothesis 7: β=0.016; t=0.432).

CONTRIBUTIONS

Present study examines to verify the importance of food quality for influencing visitors' experiential value, price fairness, and water park image in con- text of water park. The results of current study serve managerial implication as well as theoretical su- ggestion.

First, the results identify that the food quality is very important predictor that significantly linked ex- periential value, satisfaction and behavioral intention along with price fairness and water park image. The result is supported by previous studies in various consumers such as restaurants[44,45,46]. Thus, this

results confirmed the theoretical frame of the means- end chain that verified relationships among quality, value, and behavior in water park segment. In addi- tion, the food quality was significant and positive antecedents for all constructs.

Second, quality of food has to consider as one of the most important factors to derive various compo- nents including experience, water park image, per- ceived price as well as satisfaction. Therefore, the manager or administrator of water park companies should make an effort to improve their quality of foods by developing new menus and evaluating exis- ting menu items. Based on these efforts, overall sat- isfaction or value of experience will improve not on- ly from general playing facilities but also provided nice foods.

Third, the experiential value has significantly af- fect on price fairness, water park image, and satis- faction. Those results were confirmed from prior studies[47,48]. Namely, increasing positive experi- ence is principle work to satisfy various factors in water park. For example, the water park can make some events or promotions by considering visitors characteristics. More than half visitors visited the wa- ter park with friend and 63% visitors are female.

That means the water park need to develop new

promotion for female who visit with friend such as

pajama party in hotel industry. If the water park

make some different services or attractive promo-

(7)

tions for these consumers, it will directly influence on the water park revenue or reputation. Therefore, water park managers need to consider their visitors' characteristics of population to develop specialized promotions or services. Another critical finding of current study is that price fairness is not a significant predictor for customer satisfaction. There are a lot of water parks in South Korea, and it provide de- tailed information about price using website or ap- plication for smart phone. Therefore, many visitors of water parks will chose a water park after confirm- ing reasonable price or service by comparing other water park. So that the price may be standardized among increasing price competition.

Limitation

This study estimated the experiential value as a one-dimensional construct in water park sector.

Therefore, further research may need to employ a multidimensional measurement that includes diverse experiential aspects. Also, current study collected the data from a water park, so it is difficult to ge- neralize the results on all water parks. To cover the external validity, a more sample from various loca- tions is meaningful for future study.

ACKNOWLEDGMENT

This research was supported by Kyungsung Uni- versity Research Grants in 2014.

REFERENCES

[1] Kwak HP, Kim KS, Lee CS (2010). Measurement scale development of waterpark service quality.

Journal of Korea Contents Association 10(1):426- 435.

[2] Duman T, Mattila AS (2005). The role of affective factors on perceived cruise vacation value. Touri- sm Management 26(3):311-323.

[3] Kim YG, Suh BW, Eves A (2010). The relationships between food-related personality traits, satisfac- tion, and loyalty among visitors attending food events and festivals. International Journal of Hos- pitality Management 29(2):216-226.

[4] Parasuraman A, Grewal D (2000). The impact of technology on the quality-value-loyalty chain: A

research agenda. Journal of the Academy of Mar- keting Science 28(1):168-174.

[5] Petrick JF, Morais DD, Norman WC (2001). An exa- mination of the determinants of entertainment vacationers’ intentions to revisit. Journal of Travel Research 40(1):41-48.

[6] Clark MA, Wood RC (1998). Consumer loyalty in the restaurant industry-a preliminary exploration of the issues. International Journal of Contempo- rary Hospitality Management 10(4):139-144.

[7] Lee YK, Lee CK, Lee SK, Babin BJ (2008). Festival- scapes and patrons’ emotions, satisfaction, and loyalty. Journal of Business Research 61(1):56-64.

[8] Quan S, Wang N (2004). Towards a structural model of the tourist experience: An illustration from food experiences in tourism. Tourism Ma- nagement 25(3):297-305.

[9] Namkung Y, Jang SC (2007). Does food quality really matter in restaurants? Its impact on cus- tomer satisfaction and behavioral intentions.

Journal of Hospitality & Tourism Research 31(3):

387-409.

[10] Ha JY, Jang SC (2010). Effects of service quality and food quality: The moderating role of at- mospherics in an ethnic restaurant segment.

International Journal of Hospitality Management 29(3):520-529.

[11] Chen CF (2008). Investigating structural relation- ships between service quality, perceived value, satisfaction, and behavioral intentions for air passengers: Evidence from Taiwan. Transporta- tion Research Part A: Policy and Practice 42(4):

709-717.

[12] Sulek JM, Hensley RL (2004). The relative im- portance of food, atmosphere, and fairness of wait. Cornell Hotel and Restaurant Administra- tion Quarterly 45(3):235-247.

[13] Kim SY (2006). The effects of service quality on satisfaction, reviewing intentions, and recom- mendation of consumer of water parks. Korean Alliance for Health, Physical Education, Recrea- tion and Dance 45(3):325-333.

[14] Babin BJ, Darden WR, Griffin M (1994). Work and/or fun: measuring hedonic and utilitarian shopping value. Journal of Consumer Research 20(4):644-656.

[15] Mathwick C, Malhotra N, Rigdon E (2001).

(8)

Experiential value: conceptualization, measure- ment and application in the catalog and Inter- net shopping environment. Journal of Retailing 77(1):39-56.

[16] Yuan YH, Wu C (2008). Relationships among ex- periential marketing, experiential value, and customer satisfaction. Journal of Hospitality &

Tourism Research 2(3):387-410.

[17] Holbrook MB (1996). Special session summary:

Customer value- a framework for analysis and research. Advances in Consumer Research 23(2):

138-142.

[18] Kao YF, Huang LS, Wu CH (2008). Effects of thea- trical elements on experiential quality and lo- yalty intentions for theme parks. Asia Pacific Journal of Tourism Research 13(2):163-174.

[19] Chen CF, Chen FS (2010). Experience quality, perceived value, satisfaction and behavioral in- tentions for heritage tourists. Tourism manage- ment 31(1):29-35.

[20] Wall EA, Berry LL (2007). The combined effects of the physical environment and employee be- havior on customer perception of restaurant service quality. Cornell Hotel and Restaurant Administration Quarterly 48(1):59-69.

[21] Wu HJ, Liang RD (2009). Effect of experiential value on customer satisfaction with service en- counters in luxury-hotel restaurants. Interna- tional Journal of Hospitality Management 28(4):

586-593.

[22] Xia L, Monroe KB, Cox JL (2004 ). The price is unfair! A conceptual framework of price fair- ness perceptions. Journal of Marketing 68(4):

1-15.

[23] Munnukka J (2005). Dynamics of price sensi- tivity among mobile service customers. Journal of Product & Brand Management 14(1):65-73.

[24] Varki S, Colgate M (2001). The role of price per- ceptions in an integrated model of behavioral intentions. Journal of Service Research 3(3):232- 240.

[25] Bolton LE, Warlop JW, Alba JW (2003). Consu- mer perceptions of price (un)fairness. Journal of Consumer Research 29(4):474-491.

[26] Andreassen TW, Lindestad B (1998). Customer loyalty and complex services: The impact of corporate image on quality, customer satisfac-

tion and loyalty for customers with varying de- grees of service expertise. International Journal of Service Industry Management 9(1):7-23.

[27] Castro CB, Armario E, Ruiz D (2007). The influ- ence of market heterogeneity on the relation- ship between a destination’s image and tou- rists’ future behaviour. Tourism Management 28(1):175-187.

[28] Anderson RE, Srinivasan SS (2003). E-satisfaction and e-loyalty: A contingency framework. Psy- chology and Marketing 20(2):123-138.

[29] Mithas S, Krishnan MS, Fornell C (2005). Why do customer relationship management applica- tions affect customer satisfaction? Journal of Marketing 69(4):201-209.

[30] Bigné JE, Andreu L, Gnoth J (2005). The theme park experience: An analysis of pleasure, arou- sal and satisfaction. Tourism Management 26(6):

833-844.

[31] Cole ST, Chancellor HC (2009). Examining the festival attributes that impact visitor experi- ence, satisfaction and re-visit intention. Journal of Vacation Marketing 15(4):323-333.

[32] Reisinger Y, Turner LW (2003). Cross-cultural Be- haviour in Tourism: Concepts and Analysis. Bu- tterworth-Heinemann. Oxford, 337p.

[33] Chen CF, Tsai DC (2007). How destination image and evaluative factors affect behavioral inten- tions? Tourism Management 28(4):1115-1122.

[34] Godin G, Kok G (1996). The theory of planned behavior: A review of its applications to health- related behaviors. American Journal of Health Promotion 11(2):87-98.

[35] Schwarzer R (2008). Modeling health behavior change: How to predict and modify the adop- tion and maintenance of health behaviors.

Applied Psychology-an International Review 57 (1):1-29.

[36] Hellier PK, Geursen GM, Carr RA, Rickard JA (2003). Customer repurchase intention. Euro- pean Journal of Marketing 37(11/12):1762-1800.

[37] Oliver RL (1980). A cognitive model of the ante- cedents and consequences of satisfaction de- cisions. Journal of Marketing Research 17(4):460- 469.

[38] Petrick JF (2002). Development of a multi-di-

mensional scale for measuring the perceived

(9)

value of a service. Journal of Leisure Research 34(2):119-134.

[39] Prayag G, Ryan C (2012). Antecedents of tou- rists’ loyalty to mauritius: The role and influ- ence of destination image, place attachment, personal involvement, and satisfaction. Journal of Travel Research 51(3):342-356.

[40] Zeithaml VA, Berry LL, Parasuraman A (1996).

The behavioral consequences of service quality.

The Journal of Marketing 60(2):31-46.

[41] Bagozzi RP, Yi Y (1988). On the evaluation of structural equation models: Journal of the Aca- demy of Marketing Science 16(1):74-94.

[42] Fornell C, Larcker DF (1981). Structural equation models with unobservable variables and mea- surement error: Algebra and statistics. Journal of Marketing Research 18(3):382-388.

[43] Hair JF, Anderson RE, Tatham RL, Black WC (2006). Multivariate Analysis. 4th ed. NJ. Pren- tice Hall, p928p.

[44] Joung HS, Yoon HH (2010). A study on the ef- fects of perceived service quality in upscale Korean restaurants upon customer's feeling re- sponse and revisit intent. International Journal of Culinary Research 26(2):129-137.

[45] Park KH, Choi SK, Choi YK (2009). Study on the relationship between perceived value and cus- tomer response regarding service and food quality at five-star hotel restaurants. Internatio- nal Journal of Culinary Research 15(2):70-83.

[46] Park YB (2003). Discriminating customers′ fre- quent usage of western style restaurant using foodservice quality dimension. International Journal of Culinary Research 9(1):65-80.

[47] Kang BN, Moon SY (2014). A study on media- ting effect of customer satisfaction and attitudi- nal loyalty between the brand image and be- havioral loyalty in coffee shops: Focusing on capital area and non-capital area. International Journal of Culinary Research 20(1):205-219.

[48] Yang JY, Kim TH, Kim MJ (2013). The effects of customer satisfaction based on user experience on commitment, loyalty and repeated use in franchise and chain coffee shops. International Journal of Culinary Research 19(5):206-224.

Received: 4 JAN, 2016

Revised: 8 JAN, 2016

Accepted: 13 JAN, 2016

수치

Table 1. Confirmatory factor analysis for the measurement model
Table 3. Structural parameter estimates
Figure 1. Result of hypothesized paths.

참조

관련 문서