풍속에 따른 포설 아스팔트 혼합물의 온도변화에 대한 열전달 해석
Heat Transfer Analysis for Asphalt Mixture Temperature Variation due to Wind Speed
윤`태`영 Yun, Tae Young 정회원·한국건설기술연구원 수석연구원·교신저자 (E-mail : [email protected]) 유`평`준 Yoo, Pyeong Jun 정회원·한국건설기술연구원 연구위원 (E-mail : [email protected])
1. 연구배경 및 목적
균열 또는 포트홀 등의 파손에 대한 아스팔트 혼합물 의 저항성은 재료 자체의 물리적 또는 역학적인 특성은 물론, 시공 시의 포설 및 다짐조건에 의하여 많은 영향 을 받는 것은 잘 알려져 있는 사실이다. 이에 따라 국내 외 아스팔트 도로포장 관련 시방서(국토교통부 2014, 한국도로공사 2012)에서는 아스팔트 혼합물의 생산온 도와 포설온도를 결정할 때 시공성과 관련있는 재료의 점도특성을 기준으로 활용하는 동시에, 최소한의 혼합 물의 품질을 확보하기 위하여 혼합물의 물성과 별개로
최저 시공 온도를 규정하기도 한다. 한편 시공현장에서 는 포설 시의 아스팔트 혼합물의 온도 규정을 만족하는 아스팔트 혼합물을 공급하기 위하여, 현장여건에 따라 아스팔트 혼합물의 생산온도를 경험적으로 조절하는 것 이 일반적이다. 그러나 포설 시의 아스팔트 혼합물의 온 도가 동일할 경우일지라도, 아스팔트 혼합물의 온도가 감소하는 정도는 기존 층의 물성 및 온도, 대기온도, 태 양의 복사열 및 바람의 속력 등 여러 가지 외적 변수에 의하여 크게 변화할 수 있다. 만약 이들 외적 변수의 영 향이 아스팔트의 생산온도만큼 큰 영향을 미칠 수 있다
Int. J. Highw. Eng. Vol. 17 No. 4 : 33-40 AUGUST 2015 http://dx.doi.org/10.7855/IJHE.2015.17.4.033
ABSTRACT
PURPOSES : Evaluation of the wind speed effect on the temperature drop of an asphalt mixture during construction, by using the transient heat transfer theory and dominant convective heat transfer coefficient model.
METHODS : Finite difference method (FDM) is used to solve the transient heat transfer difference equation numerically for various wind speeds and initial temperature conditions. The Blasius convective heat transfer coefficient model is adapted to account for the effect of wind speed in the temperature predictions of the asphalt mixture, and the Beaufort number is used to select a reasonable wind speed for the analysis.
As a function of time and depth, the temperature of the pavement structure is predicted and analyzed for the given initial conditions.
RESULTS : The effect of wind speed on the temperature drop of asphalt mixture is found to be significant. It seems that wind speed is another parameter to be accounted for in the construction specifications for obtaining a better quality of the asphalt mixture.
CONCLUSIONS : It is concluded that wind speed has a significant effect on the temperature drop of the asphalt layer. Although additional field observations have to be made to reflect the effect of wind speed on the construction specifications, it appears that wind speed is a dominant variable to be considered, in addition to the atmospheric temperature.
Keywords
Transient heat transfer, pavement, wind speed, finite difference method
Corresponding Author : Yun, Taeyoung, Senior Researcher Highway Research Division, Korea Institute of Construction Technology, 283, Goyangdae-ro, Ilsanseo-gu, Goyang-si, Gyeonggi-do, 10223, Korea Tel : +82.31.910.0445 Fax : +82.31.910.0161
E-mail : [email protected]
International Journal of Highway Engineering http://www.ksre.or.kr/
ISSN 1738-7159 (Print) ISSN 2287-3678 (Online)
Received Apr. 20. 2015 Revised Jul. 07. 2015 Accepted Jul. 13. 2015
면, 동일한 재료를 동일한 온도에서 생산하여 시공했을 경우에도 대기 및 경계조건에 따라 다짐순서 및 시간이 조정되어야 동등한 품질의 도로포장을 시공할 수 있는 것은 자명한 사실이다. 그러나 현장에서의 다짐절차는 다짐장비 운전자의 경험에 근거한 임의적 판단에 따라 진행되는 경우가 대부분이며, 시공 품질에 대한 적정성 도 최종적인 아스팔트 혼합물의 공극률 등으로 사후에 평가된다. 이러한 사후평가의 결과에 집중한 아스팔트 포장 품질의 확보 방법은 최악의 경우 재시공 등의 추가 적인 경제적인 부담을 발생시킬 수 있기 때문에 평가결 과가 엄격하게 반영되지 못하는 측면이 많으며, 포장의 품질 향상을 위한 시공과정에서의 가이드라인으로 적극 적으로 활용되지 못하는 문제점이 있다.
따라서 본 연구에서는 아스팔트 포장의 품질향상을 위하여, 아스팔트 혼합물의 포설 시의 대기온도 및 바람 의 속력에 따른 혼합물의 온도변화를 정량적으로 평가 하고 이들의 시공에서의 고려 필요성을 수치해석적으로 확인하고자 하였다. 본 연구에서 제시된 대기 및 바람의 영향에 따른 아스팔트 혼합물의 온도변화 예측 결과는 향후 실측을 통하여 관련 시방 규정을 합리적으로 수정 하거나 전산화된 시공 장비의 개발 및 운용을 위한 기본 근거로 활용될 수 있다.
2. 열전달 모형 2.1. 강제대류 모형
일반적인 대기 중에서의 열전달은 크게 대류(Convection), 복사(Radiation), 전도(Conduction)로 구분될 수 있으며, 국지적으로 가열 또는 냉각된 공기의 밀도차에 의해서 발 생하는 자연대류(Natural Convection)와 바람으로 인 하여 강제적으로 순환이 발생하는 강제대류(Forced Convection)으로 구분될 수 있다. 그러나 도로포장 시 스템 내에서의 동결심도를 예측하거나 포장의 구조적 거동을 분석하는데 활용하기 위한 깊이별 온도변화의 예측을 위하여 수행된 연구(An et al. 2006, Kim et al. 2009, In et al. 2004, Jo et al. 2003, Velasquez et al. 2008, Diefenderfer et al. 2003, Wang and Roesler 2012, Park et al. 2013, Qin and Hiller 2013)에서는 물론, 포설 시 아스팔트 혼합물의 온도저 감곡선(Cooling Curve)에 관련된 연구에서도(Wolfe et al. 1983, Chadbourn et al 1996, Corlew and Dickson 1968, Tegeler and Dempsey 1973,
Harvey 2004)에서도 풍속의 변화를 고려하지 않거나 강제대류계수의 적절성을 검증하는 것에 그쳐 실제 풍 속의 변화가 실제 아스팔트 혼합물의 온도감소에 미치 는 영향을 아스팔트 혼합물의 초기온도에 관련하여 정 량적으로 평가하지는 않았다. 다음 Eq. (1), Eq. (2), Eq. (3), Eq. (4)와 Eq. (5)는 각각 이상의 문헌에서 교 면포장, 콘크리트 포장, 콘크리트 교면포장 및 층류 (Laminar Flow)에 대하여 대표적으로 사용된 대류계 수 모형(Convective Heat Transfer Coefficient, h) 과 EICM(Enhanced Intergrated Climatic Model)을 나타내고 있으며, 이들 모형에서 결정된 풍속과 대류계 수와의 관계를 확인할 수 있다.
Priestley and Thurston Model (1979)
(1) where, = wind speed (m/s).
Wolfe and Heath (1983)
(2) where, = wind speed (m/s).
Bentz (2000)
(3)
Blasius
(4) where,
Enhanced Integrated Climatic Model (EICM 2004)
(5) where, = average of the surface and air temp.( ),
= wind speed (m/s),
= surface temperature ( ), and
= air temperature ( ).
Table 1은 일반적인 시공조건에 고려될 수 있는 풍속 (kinematic viscosity of air), and (for infinite flat plate).
의 일부를 나타내고 있다. 이들의 지표상태와 풍속을 고 려할 때, 도로포장 시공에서의 최악조건은 보퍼트 풍속 계급 3 또는 풍속 6m/s로 가정하는 것이 적절한 것으로 판단되었다.
Fig. 1은 위의 5가지 대류계수 모형과 보퍼트 풍속계 급을 이용하여 풍속에 따른 대류계수의 변화를 나타낸 것으로, 교면포장에 사용되었던 Priestly and Thurston 모형(1979)과 Bentz모형(2000)은 풍속에 따른 대류계수의 변화를 크게 예측하는 특징을 나타내 었으며, 이외의 모형에서는 풍속 8m/s 이하의 조건에 서 최대 20W/m의 대류계수를 나타내었다. 본 연구에 서는 풍속에 따른 아스팔트 혼합물의 온도변화 민감성 을 확인하는 만큼, 풍속에 따른 대류계수의 변화가 다른 모형에 비하여 중간정도라고 할 수 있는 Blasius 모형 을 적용하였다.
2.2. 일차원 비정상 열평형 모형
이미 시공된 아스팔트 기층 위에 포설되는 아스팔트
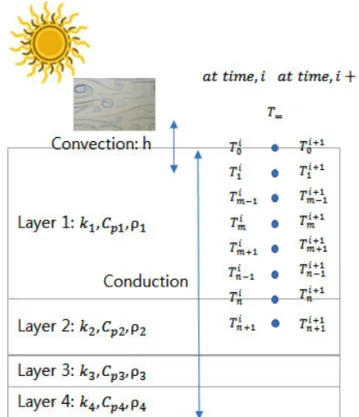
혼합물의 온도변화를 예측하고 풍속과 온도의 영향을 정량적으로 평가하기 위하여, Fig. 2와 같이 주어진 조 건에 대하여 Eq. (6)의 열평형 방정식에서 유도하였다.
복사와 자체적 에너지 발생이 없는 조건에서 양해법 (Explicit Method)을 이용하면 표층 상부, 층 내부, 층 경계면에서의 에너지 변화가 Eq. (7), Eq. (8), Eq. (9) 와 같이 유한차분법(Finite Difference Method, FDM)으로 나타내어질 수 있다. Fig. 2에서의 Layer 2, Layer 3 및 Layer 4는 아스팔트 포장에 이미 시공 되어 있는 기층, 보조기층 및 노상을 나타내고 있으며, 열전달 해석에 필요한 열역적 물성으로 각층의 전도계 수(Conductive Heat Transfer Coefficient, ), 비열 용량(Specific Heat Capacity, ) 및 밀도( )가 아래 첨자를 활용하여 표기되어 있다. 한편 본 연구에서는 검 증되지 않은 변수의 영향을 최소화하기 위하여 대류와 전도이외에 복사(Radiation) 등에 의한 열전달은 없는 것으로 가정하였다.
Energy Balance of Solid Body
(6) where, rate of heat radiation
No Description Ground condition Wind speed (m/s) 0 Calm Smoke rises vertically. 0.3 1 Light air Smoke drifts in the
wind. 0.3~1.5
2 Light breeze Leaves rustle. Wind
felt on face. 1.5~3.3
3 Gentle breeze
Small twigs in constant motion.
Light flags extended.
3.3~5.5
4 Moderate wind
Dust, leaves and loose paper raised.
small branches move.
5.5~8.0
Table 1. Beaufort Numbers
Fig. 1 Variation of Convective Heat Transfer Coefficient for Wind Velocity
Fig. 2 Schematic Description of Pavement Structure
and Thermal Properties
rate of heat radiation
rate of heat convection rate of heat generation
rate of change of the energy content of the element
time step (sec).
Transient Finite Difference Formulation for Surface Nodes
where, = spatial step(sec), and
= Area(㎡).
Transient Finite Difference Formulation for Interior Nodes
(8)
Transient Finite Difference Formulation for Interface Nodes
(9) 양해법을 따르는 유한차분법의 해석에서, 안정적인 수치해석 결과를 얻기 위해서는 Eq. (10)을 만족해야 한다(Latif 2009). 따라서 본 연구에서는 유한차분법에 서 사용된 시간증분(Time Step)을 2sec 이하가 되도록 하여, 모든 경우에서 값이 0.1 이하가 공간증분(Spatial Step)을 조정하였다.
(10)
한편 Wolfe and Heath(1983)에 따르면, 가열된 아 스팔트 혼합물이 기존 포장면에 최초 접하는 시점에서 초기 온도감소에 대한 영향을 고려하는 방법을 고려할 수 있다. 따라서 본 연구에서는 Eq. (11)을 활용하여 경 계면의 초기온도 결정하였다.
(11)
where, =temperature of interface at time 0,
=initial temperature of hot asphalt,
=initial temperature of cold base,
= initial temperature of cold base,
=thermal diffusivity of asphalt and base.
3. 풍속에 따른 혼합물의 온도변화 분석 3.1. 분석조건
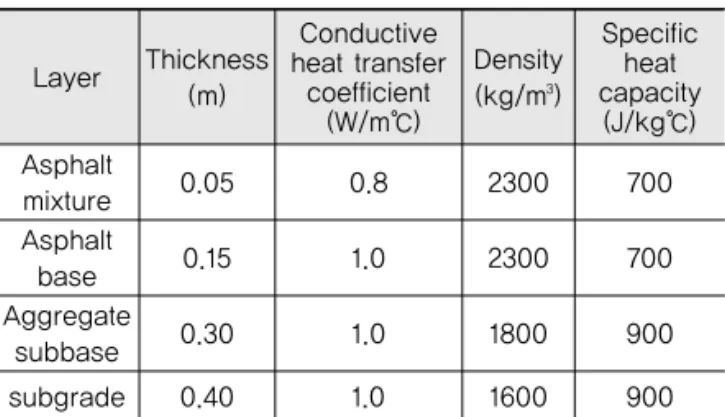
주어진 아스팔트 포장구조와 같이 포설되는 아스팔트 혼합물에서의 열전달은 최상부층의 전도계수와 비열용 량 등의 열역학적 물성과 함께, 바람의 특성 및 대상체의 형상, 표면상태 등과 관련된 대류계수의 큰 영향을 받는 다고 할 수 있다. 본 연구에서는 기존의 국내외 문헌 (Fwa et al. 1995, Luca and Mrawira 2005, Carlson 2010, Yun and Yoo 2014)을 바탕으로 각 층의 두께 및 열역학적 물성 값을 Table 2와 같이 설정하였다. 한편 하부층의 열전도계수와 밀도, 비열용량 등은 실제 온도 변화에 큰 영향을 미치지 못하므로 일반적인 값을 활용 하였으며, 대기와 온도와 이미 시공되어 있는 하부층의 온도는 동일한 것으로 가정하여 해석을 수행하였다.
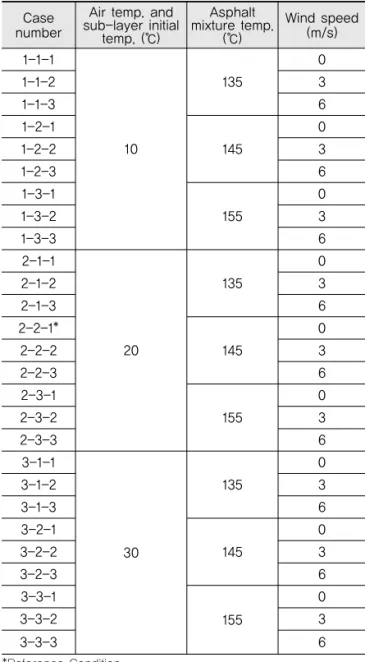
Table 3은 온도예측에 사용된 대기온도, 혼합물의 온
Layer Thickness (m)
Conductive heat transfer
coefficient (W/m℃)
Density (kg/m3)
Specific heat capacity
(J/kg℃) Asphalt
mixture 0.05 0.8 2300 700
Asphalt
base 0.15 1.0 2300 700
Aggregate
subbase 0.30 1.0 1800 900
subgrade 0.40 1.0 1600 900
Table 2. Thermal Properties
(7)고 있다. 일반적인 아스팔트 혼합물의 온도, 풍속 및 아 스팔트 포장의 포설 최저온도(5℃)를 고려하여 결정하 였으며, 대기온도 20℃, 혼합물의 온도 145℃의 자연대 류조건을 기준조건으로 설정하였다.
Fig. 3은 기준조건(Reference Condition)에서의 시 간에 따른 온도의 변화를 나타내고 있다. 온도저감곡선 과 관련된 연구결과를 통하여 일반적으로 알려진 바와 같이, 아스팔트 혼합물의 온도가 20분 이내에 80℃이 하로 떨어지는 것을 확인할 수 있으며, 대류에 의한 온 도 감소는 하부층으로의 온도 감소보다 적은 것을 알 수 있다.
3.2. 분석결과
위의 Table 3의 27개 조건 중에서 대기온도 20℃인 조건의 모든 경우에 대하여 시간에 따른 아스팔트 혼합 물의 온도변화가 Fig. 4에 나타나 있다. 대기온도와 혼
Table 3. Analysis Condition
Case number
Air temp. and sub-layer initial
temp. (℃)
Asphalt mixture temp.
(℃)
Wind speed (m/s) 1-1-1
10
135
0
1-1-2 3
1-1-3 6
1-2-1
145
0
1-2-2 3
1-2-3 6
1-3-1
155
0
1-3-2 3
1-3-3 6
2-1-1
20
135
0
2-1-2 3
2-1-3 6
2-2-1*
145
0
2-2-2 3
2-2-3 6
2-3-1
155
0
2-3-2 3
2-3-3 6
3-1-1
30
135
0
3-1-2 3
3-1-3 6
3-2-1
145
0
3-2-2 3
3-2-3 6
3-3-1
155
0
3-3-2 3
3-3-3 6
*Reference Condition
Fig. 4 Temperature Profile at Reference Condition
Fig. 3 Temperature Profile at Rreference Condition
합물의 온도에 따라 차이가 있으나, 풍속이 3m/s를 기 준으로 대기층과의 대류에 의한 포설층의 온도 감소의 영향과 하부층과의 전도에 의한 포설층의 온도 감소 영 향이 역전되는 것을 확인할 수 있다.
풍속의 증가에 따른 혼합물의 온도감소는 Fig. 4의 조건 2-3-1과 2-3-3의 비교를 통하여 명확하게 알 수 있는데, 풍속을 제외한 동일한 조건에서 아스팔트 혼합 물의 포설 20분 후 최고 온도는 풍속이 0m/s인 2-3-1 의 조건에서 약 119℃로 0.015m 지점에서 분석되는 반 면, 풍속이 6m/s인 2-3-3의 조건에서는 약 102℃로 0.025m 지점에서 분석되었다. 이는 15℃ 이상의 온도 차이가 발생하는 것으로, 두 조건에서 포설할 때 아스팔 트 혼합물에 대하여 동등한 수준의 공극을 얻기 위해서 는 풍속을 반드시 고려해야 하는 것으로 판단된다. 한편 Fig. 5, Fig. 6, Fig 7은 각각 대기온도 10℃, 20℃, 30
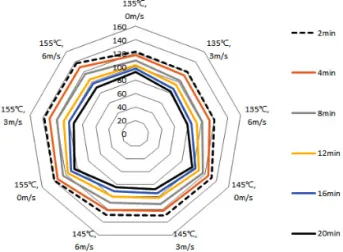
℃의 조건에서 아스팔트 혼합물 온도의 산술평균값을 시 간에 따라 나타낸 것으로, 아스팔트 혼합물의 온도 변화 에 대한 혼합물의 초기온도, 풍속의 영향을 명확하게 나 타내고 있다. 예를 들어 Fig. 5에서 155℃, 6m/s의 조건
에서 포설된 아스팔트 혼합물 온도의 급격한 감소는 내 외부의 다각형의 간격이 넓어지는 것으로 확인할 수 있 다. 또한 대기 온도가 10℃인 Fig. 5의 20분 후 아스팔 트의 온도를 나타내는 가장 안쪽의 다각형의 크기는 대 기 온도가 30℃인 Fig. 7의 동일한 조건에서의 가장 안 쪽의 다각형에 비하여 작아 대기온도와 포장 하부층의 온도가 포설된 아스팔트 혼합물의 온도에 미치는 영향 정도를 가시적으로 확인할 수 있다.
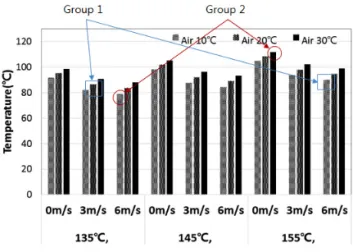
Table 4와 Fig. 8은 Fig. 5, Fig. 6, Fig. 7의 27개 조건 중에서 20분 후의 아스팔트 혼합물의 온도를 나타 내는 가장 안쪽 다각형에 대한 결과만을 나타낸 것이다.
Fig. 8의 Group 1은 대기온도 10℃, 풍속 6m/s의 조 건에서 포설한 155℃의 아스팔트 혼합물의 20분 후 온 도가 대기온도 20℃, 풍속 3m/s의 조건에서 135℃에서 포설한 아스팔트 혼합물의 온도와 유사해지는 것을 나 타내고 있는데, 이는 대기온도가 10℃ 낮은 특정한 조 건에서는 동일한 다짐정도를 얻기 위하여 혼합물의 온 도를 20℃ 이상 올려야한다는 것을 의미한다. 한편 Group 2는 예측결과 중 가장 차이가 큰 두 가지 경우 를 나타내고 있는데, 포설 시 아스팔트 혼합물의 온도차 가 20℃임에도 불구하고 풍속과 대기온도의 차이에 의 한 포설 20분 후의 온도는 30℃ 이상 발생하는 것을 확 인할 수 있다. 20분 이후에는 지속적인 강제대류가 발 생할 것을 가정한다면, Group 2의 두 가지 조건의 온 도차가 더 심해질 것을 충분히 예상할 수 있다.
Fig. 5 Variation of Mean Temperature of Mixture at 10℃ of Air Temperature
Fig. 7 Variation of Mean Temperature of Mixture at 30℃ of Air Temperature
135℃, 145℃, 155℃,
0m/s 3m/s 6m/s 0m/s 3m/s 6m/s 0m/s 3m/s 6m/s 10℃ 92 82 79 98 88 84 105 94 90 20℃ 95 86 83 102 92 89 108 98 94
Table 4. Mean Temperature Comparison
4. 결론
본 연구에서는 대기온도와 이미 포설된 하부층의 온 도, 아스팔트 혼합물의 포설온도 및 풍속을 고려하여 아 스팔트 혼합물의 시간에 따른 온도감소를 분석하고 정 량적으로 나타내었다. 이를 위하여 주어진 조건에 대하 여 미분방정식으로 표현된 에너지 평형방정식의 해를 얻기 위하여 수치해석의 방법인 유한차분법을 적용하였 으며, 대류계수를 결정하는 강제대류모형으로는 유체이 론에 근거한 Blasius 모형을 적용하였다. 보퍼트 풍속 계급에서 도로포장시공에서 발생할 수 있는 조건을 선 별하여 27개 조건에 대한 포설층의 온도변화를 분석한 결과를 요약하면 다음과 같다.
1. 일차원 유한차분법과 문헌에서 나타난 열역학적 물 성으로 예측한 아스팔트 혼합물의 온도변화는 기존 의 아스팔트 혼합물의 온도변화를 예측하기 위한 모 형과 유사한 결과를 나타내는 것으로 확인되었다.
2. 주어진 단면에서 아스팔트 혼합물의 온도 감소에 영 향을 미치는 주요인자는 아스팔트 혼합물의 열역학 적 물성과 대류계수이며, 열전도계수를 제외한 하부 층의 열역학적 물성은 포설된 아스팔트 혼합물의 온 도변화에 대하여 그 영향력이 매우 작다.
3. 주어진 조건에서 풍속이 약 3m/s 이상이 되는 경우에 는 포설층의 상부에서 대류로 손실되는 열에너지가 하부에서 전도로 손실되는 열에너지와 유사해진다.
4. Blasius 모형에서는 포장 상부층에 접하는 공기의 흐름을 층류(Laminar Flow)로 가정한 만큼, 난류 (Turbulent Flow)일 가능성이 높은 현장에서는 아 스팔트 포설층의 온도감소에 대한 풍속의 영향은 더 커질 가능성이 매우 높다.
5. 특정한 조건에서는 아스팔트 혼합물의 포설 시 온도 차이가 20℃임에도 불구하고, 20분 후에는 30℃ 이 상 발생할 수 있다. 이는 대기온도와 풍속의 중요성 을 의미하는 것으로 현재의 최저시공온도에 관련된 규정은 최저온도와 최고풍속을 동시에 고려한 시공 절차를 제시할 필요가 있다.
6. 이상의 예측결과는 추가적인 연구를 통하여 대기조건 을 고려한 다짐순서 또는 절차를 규정하거나 관련 시 공장비를 개발하기 위한 기초자료로 활용될 수 있다.
감사의 글
본 연구는 한국건설기술연구원의 주요사업 재원으로 수행 되었습니다.
REFERENCE