INTRODUCTION
Humans change their walking and running patterns to conserve energy and increase speed during locomotion (Cappellini, Ivanenko, Poppele, & Lacquaniti, 2006). Running, a popular activity worldwide, is a major component of various sports (Cheung & Rainbow, 2014) and has a known positive effect on cardiovascular and mental health (Williams, 2009a, 2009b).
However, as numerous people participate in running, some issues are being reported, with 39~85% of runners reporting that they have experienced injuries in the past year (Bovens et al., 1989; van Gent et al., 2007; Watson, 1987). In addition, Taunton et al. (2002) showed that, regardless of sex, those injured due to running show a strongly positive relationship between tibial stress syndrome and the occurrence of injury;
this is related to the risk of patellofemoral pain, iliotibial band friction syndrome, and plantar fasciitis. It is also known that the risk of spinal damage for women with a body mass index (BMI) < 21 kg/m
2is very high.
To improve running efficiency and prevent injury, studies have investi- gated the complexity of legs; it is now generally assumed that most of the energy that is consumed by muscles during running is used to
convert chemical energy to mechanical energy (Alexander, 1980). Taylor, Heglund, & Maloiy (1982) explained that the greater the hopping speed of a kangaroo, the more economical it is; it was also reported that input mechanical energy is temporarily stored in the elastic material of the active muscle for use in subsequent muscle actions (Asmussen
& Bonde-Petersen, 1974).
From this perspective, although the motion of human running is performed by a complex musculoskeletal system composed of muscles, tendons, and ligaments, it functions very similarly to a single linear spring (Farley & Gonzalez, 1996). Therefore, the dynamics of human running can use the spring-mass model to very accurately explain the complex movements of the legs (Arampatzis, Brüggemann, & Metzler, 1999; Blum, Lipfert, & Seyfarth, 2009; Donelan & Kram, 2000; Farley &
Gonzalez, 1996; Lipfert, Günther, Renjewski, Grimmer, & Seyfarth, 2012;
McMahon & Cheng, 1990). In the spring-mass model, the legs are seen as linear springs with no mass, while the stiffness of the leg spring was closely related to the peak vertical force (PVF) and change in leg length during ground contact (Farley, Glasheen, & McMahon, 1993). In addition, leg stiffness differed among terrains and was inversely pro- portionate to the stiffness of the surface to which the locomotion is applied (Alexander, 1989, 1992; Feehery, 1986). Ferris, Louie, & Farley
http://e-kjsb.org eISSN 2093-9752
ORIGINAL
Relationship between Leg Stiffness and Kinematic Variables According to the Load while Running
Seung Hyun Hyun, Che Cheong Ryew
Department of Kinesiology, Jeju University, Jeju-Do, South Korea
Received : 27 April 2017 Revised : 07 June 2017 Accepted : 08 June 2017
Corresponding Author Che Cheong Ryew
Department of Kinesiology, College of Natural Science, Jeju National University, 102 Jejudaehak-ro, Jeju, 63243, South Korea
Tel : +82-64-754-3588 Fax : +82-64-757-1752 Email : [email protected]
Objective: This study aimed to investigate the relationship between leg stiffness and kinematic variables
according to load while running.
Method: Participants included eight healthy men (mean age, 22.75 ± 1.16 years; mean height: 1.73 ± 0.01 m;
mean body weight, 71.37 ± 5.50 kg) who ran with no load or a backpack loaded with 14.08% or 28.17% of their body weight. The analyzed variables included leg stiffness, ground contact time, center of gravity (COG) displacement and Y-axis velocity, lower-extremity joint angle (hip, knee, ankle), peak vertical force (PVF), and change in stance phase leg length.
Results: Dimensionless leg stiffness increased significantly with increasing load during running, which
was the result of increased PVF and contact time due to decreased leg lengths and COG displacement and velocity. Leg length and leg stiffness showed a negative correlation (r = -.902, R
2= 0.814). COG velocity showed a similar correlation with COG displacement (r = .408, R
2= .166) and contact time (r = -.455, R
2= .207).
Conclusion: Dimensionless leg stiffness increased during running with a load. In this investigation, leg
stiffness due to load increased was most closely related to the PVF, knee joint angle, and change in stance phase leg length. However, leg stiffness was unaffected by change in contact time, COG velocity, and COG displacement.
Keywords: Leg stiffness, Load, Running, Relationship, Kinematic variables
(1998) reported that the leg stiffness of animals is not related to speed or gravity but is determined by musculoskeletal characteristics; however, they reported that if stiffness is unchanged on different surfaces, similar running motions can be sustained by changing the characteristics of running (PVF, contact time).
There are reports that humans also can regulate leg stiffness while running (Farley, Blickhan, Saito, & Taylor, 1991; Farley & Gonzalez, 1996);
for optimal locomotion, a certain level of stiffness must be maintained (Arampatzis et al., 1999; Dutto & Smith, 2002; Kerdock, Biewener, McMahon, Weyand, & Herr, 2002; Kuitunen, Komi, & Kyröläinen, 2002;
McMahon & Cheng, 1990; Seyfarth, Geyer, Günther, & Blickhan, 2002;
Stefanyshyn & Nigg, 1998). However, during the motions of running in the early stages of ground contact, the distance between the center of gravity (COG) and parts of the feet that reach the minimal level in the mid-stance phase beginning with the curve of the angle of the hip, knee, and ankle (McMahon & Cheng, 1990) and in each instance the foot contacts the ground, a repeated left-right, font-back, vertical dir- ection impact occurs (Ryu, 2013, 2014, 2015). In addition, the average ground contact time is 0.24 sec, the change in leg length is 7.3%, and the PVF is a mean 2.3 times the individual’s body weight (Silder, Besier,
& Delp, 2015).
However, despite the availability of this information, many people are often forced into situations in which they must move objects during everyday life. In addition, we often observe elite athletes or ordinary people who want to gain quick effects of exercise by running with the addition of vests, lead, or sandbags. Thus, leg stiffness, which is affected by mass on solid ground, must be appropriately regulated, but infor- mation on the regulation of leg stiffness following changes in mass are very limited, and leg stiffness using the spring-mass model is only explained as an increase proportional to the increase in mass in various animals (Farley et al., 1993).
Although many studies have analyzed and interpreted the correlation between changes in leg stiffness and related variables to investigate the characteristics of motion while running, they are merely explained by the differences in the increase or decrease of specific variables. That is, in addition to PVF, leg joint angle (hip, knee, ankle) and changes in leg length, ground contact time, and movement speed are all important factors in leg stiffness analysis, but there is a need to more clearly understand their relationship. In addition, as PVF is an important factor in stiffness level and load changes vary based on an individual's goals in everyday life, new research on the efficiency of locomotion and the provision of improved efficiency that applies more varied changes in loads is needed.
Therefore, the purpose of this study is to quantitatively analyze the relationship between leg stiffness and kinematic variables by load during running. We especially aimed to provide useful information to decrease injuries that can occur due to changes in loads during running, increase efficiency, and accumulate basic material related to leg stiffness focusing on various changes in loads.
METHODS 1. Subject
Eight adult men (mean age, 22.75 ± 1.16 years; mean height, 1.73
± 0.01 m; mean body weight, 71.37 ± 5.50 kg) who were able to run normally were selected as subjects. Before the experiment, all subjects were informed of its purpose and contents, and those who voluntarily wished to participate provided written informed consent.
2. Experimental procedure
The personal trial times for all subjects were recorded, and each per- formed a sufficient warmup to avoid musculoskeletal system strain. The runs were mostly 15-m long, and a force plate (AMTI-OR-7, USA) was installed at the 8-m mark. The Kwon 3D XP (2007) program (Visol, Korea) was used to analyze the visual data, and four cameras (HDR-HC7/HDV 1080i, SONY) and lights were installed. After the camera speed was set at 60 frames/sec, exposure time at 1/500 sec, and force plate sampling rate at 600 Hz, a control object (2 m × 2 m × 1 m) was recorded to set three-dimensional (3D) spatial coordinates. At this time, the margin of error for the 3D spatial coordinates was 4.16 mm. After these spatial coordinates were set, to quantify the video material of subjects per- forming the motions, 19 reflective markers were attached as shown in (Figure 1) (right and left toe, right and left heel, right and left lateral and medial malleolus, right and left shank, right and left lateral and medial epicondyles, right and left thigh, right and left anterior superior iliac spine, and sacrum).
Running was first performed with no load (0 kg), followed by the
carrying of backpacks weighing 10 kg (14.08 ± 1.10% of the body
weight) or 20 kg (28.17 ± 2.20% of the body weight) in a random
Figure 1. Marker attachment points (ASIS: anterior superior iliac spine)order. As shown in (Figure 2), the backpack was black; to minimize dis- comfort during running and considering motion changes due to re- bounds, the backpack was tightly attached to the body using shoulder and waist straps. Since the change in leg length was important in this study, errors due to shoe cushioning and data errors due to artificial speed control were considered when the subjects ran barefoot at their preferred speeds.
As such, three trials (3 × 3) based on individual weight were per- formed. At this time, whether the subject performed the motion at the preferred speed and in the preferred motion relied on the subject's testimony, and the researcher examined whether the subject's entire foot was located atop the force plate and used the successful 1 trial in the analysis. The spatial coordinates were set with the running direction on the Y axis, the left and right of the progress on the X axis, and vertical to the X and Y axis on the Z axis.
3. Lower-limb angles
The angles of the lower limbs during running following a load change were as follows (Figure 3):
- Hip joint angle: formed by the trunk and thigh - Knee joint angle: formed by the thigh and lower leg - Ankle joint angle: formed by the lower leg and foot 4. Data analysis
The kinematic variables of running motion following load changes were calculated using the Kwon 3D XP ver. 4.0 (2007) program (Visol).
The coordinates of the control points, body joint points, and 3D spatial points were calculated through direct linear transformation as described by Abdel-Aziz & Krara (1971). The research variables were analyzed with a cutoff frequency of 6 Hz using the low-pass filter method by Butterworth for smoothing and noise reduction. The analyzed variables
included dimensionless leg stiffness, PVF, leg length (%), ground con- tact time, COG displacement and velocity on the Y axis, and lower extremity joint angle (hip, knee, ankle) during ground contact of the right foot.
Dimensionless leg stiffness (K was calculated using the method proposed by Silder et al. (2015), and the section from the time the right foot first makes contact to when the toe breaks contact after ground contact was analyzed (Formula 1).
K PVF
/ ′
Formula 1. Dimensionless leg stiffness
The PVF, which is created during ground contact, is a value that is standardized by dividing it by each subject's body weight; is the standardized value of the change in leg length during the stance phase;
and is the minimum leg length. Leg length was measured by calculating the length from the center of pressure (Bullimore & Burn, 2006) to the center of the pelvis (Plagenhoef, Evans, & Abdelnour, 1983) as shown in Figure 3.
After the mean and standard deviation of the kinematic/kinetic vari- ables calculated above was calculated using the PASW 18.0 statistics program, while repeated-measures analysis of variance was performed after each load was carried (×3). The relationship between each variable was understood through correlations, and the change in each variable ( ∆ %) by load during running was analyzed using Pearson correlation
Figure 2. Running position and backpack typeFigure 3. Leg length was estimated by calculating the distance from
the center of pressure to the center of the pelvis (Delp et al., 1990; Hyun
& Ryew, 2016; Silder et al., 2015)
coefficients. All statistical levels of significance were set at α = .05.
RESULTS
1. Result of kinematic variables
The results of kinematic variables according to loads during running are shown in (Table 1). The contact time of the right foot increased as the load increased and was statistically significant ( p < .001). The change in COG displacement and velocity on the Y axis decreased significantly as the load increased ( p < .05).
2. Lower-extremity joint angles
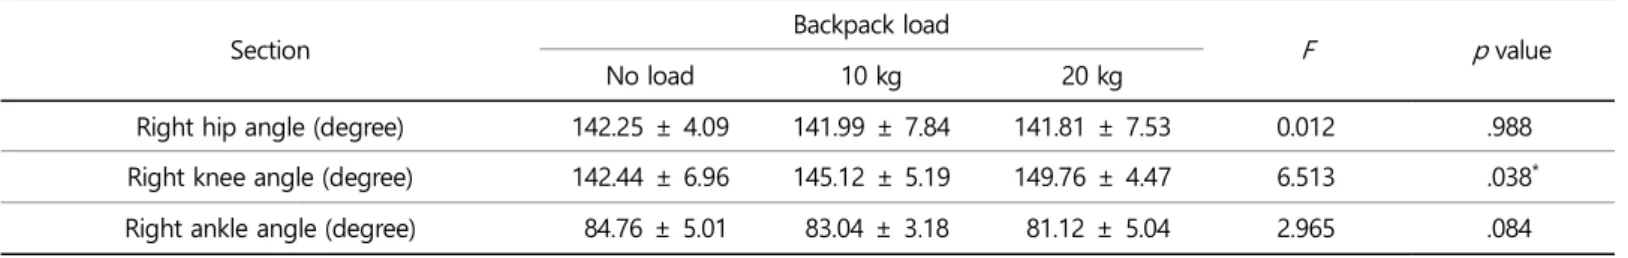
Changes in both lower-extremity joint angles by load during running were analyzed. The analysis was based on the time of ground contact of the right lower extremity shown in (Table 2). The angle of the hip and ankle joints did not change much among loads and did not differ statistically ( p > .05). The angle of the knee joint increased as the load increased and the difference was statistically significant ( p < .05).
3. Dimensionless leg stiffness variables
The changes in leg stiffness and related variables by load during running are shown in (Table 3). Leg stiffness and PVF increased as load increased and were statistically significant ( p < .001). On the other hand, leg length (%) decreased as load increased and was statistically significant ( p < .01).
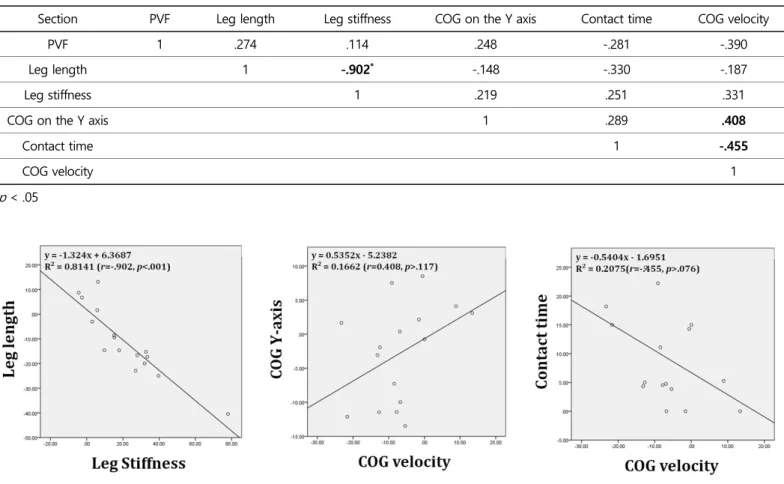
4. Correlation results
The results of the correlation analysis of each variable by load during running are shown in (Table 4). The results of analysis using the change ( ∆ %) between 0 kg and 20 kg to establish the characteristics of each variable by load showed that the r was -.902 between leg length and leg stiffness, indicating a very strong negative correlation. In addition, r was .408 between COG velocity and COG displacement on the Y axis and r was -.455 between contact times, showing a correlation (Figure 4).
Table 2. Lower-extremity angle by load
Section Backpack load
F p value
No load 10 kg 20 kg
Right hip angle (degree) 142.25 ± 4.09 141.99 ± 7.84 141.81 ± 7.53 0.012 .988
Right knee angle (degree) 142.44 ± 6.96 145.12 ± 5.19 149.76 ± 4.47 6.513 .038
*Right ankle angle (degree) 84.76 ± 5.01 83.04 ± 3.18 81.12 ± 5.04 2.965 .084
* p < .05; 10 kg (14.08% of body weight), 20 kg (28.17% of body weight)
Table 3. Result of dimensionless leg stiffness variables by load
Section Backpack load
F p value
None 10 kg 20 kg
Dimensionless leg stiffness 30.25 ± 4.94 37.30 ± 4.47 43.07 ± 5.54 21.661 .001
***Peak vertical force (N/BW) 2.36 ± 0.15 2.56 ± 0.16 2.60 ± 0.15 19.663 .001
***Change in stance phase leg length (%) 7.93 ± 0.99 6.91 ± 0.63 6.11 ± 0.63 10.338 .002
**** p < .01, *** p < .001; 10 kg (14.08% of body weight), 20 kg (28.17% of body weight)
Table 1. Kinematic variables by loadSection Backpack load
F p value
None 10 kg 20 kg
Ground contact time (sec) 0.33 ± 0.02 0.36 ± 0.03 0.39 ± 0.02 18.001 .001
***COG displacement in the Y axis (m) 1.05 ± 0.06 1.05 ± 0.07 0.99 ± 0.06 4.476 .031
*COG average velocity in the Y axis (m/sec) 3.07 ± 0.16 2.94 ± 0.32 2.65 ± 0.17 8.301 .004
*** p < .05, ** p < .01, *** p < .001; 10 kg (14.08% of body weight), 20 kg (28.17% of body weight)
DISCUSSION
While the complex motion of the lower extremities during running have been investigated using the spring-mass model (Arampatzis et al., 1999; Blum et al., 2009; Donelan & Kram, 2000; Farley & Gonzalez, 1996; Lipfert et al., 2012; McMahon & Cheng, 1990), the load used with running varies greatly based on an individual's goal and kinematic in- formation about lower-extremity motion is lacking. Although study results have implicated that the ability to sustain an appropriate level of leg stiffness during running effectively prevents injury (Butler et al., 2003), the method and material about sustaining this level is lacking and leg stiffness and related variables according to load change have only been explained through simple differences in increases or decreases (Silder et al., 2015). Therefore, this study conducted a correlation analysis between leg stiffness and related variables to provide quantitative infor- mation required to increase locomotive efficiency and prevent injury.
In this study, dimensionless leg stiffness and PVF, which was stan- dardized using body weight, increased proportionately with load in- creases and was statistically significant. These results are similar to those of the report that stated that the proportional relationship of body weight to leg stiffness can be seen in various animals that run at similar speeds (Farley et al., 1993). However, the variable of interest was leg length (%); unlike the increase trend in leg stiffness showed change by decreasing, and the value of r = -.902 between leg stiffness and leg
length showed a very large inverse proportion relationship.
Under conditions in which movement speed during running must be increased, the range of motion of the knee and ankle joints increases to maintain momentum (Bishop, Fiolkowski, Conrad, Brunt, & Horodyski, 2006; Schache et al., 2011). However, the results of this study, which was conducted at each participant's preferred speed and investigated natural lower-limb movement by load increases during running, showed significantly less bending in the angle of the knee joint. That is, during running, the bend of the knee can reduce vertical stiffness and the force of impact moves from the foot to the cranium (Hewett et al., 1999; McMahon, Valiant, & Frederick, 1987), and the loads of 14.08%
and 28.17% of body weight applied in this study is inferred to be an important factor in limiting the bending/extending motion of the lower limbs during running and further increasing leg stiffness. In addition, the decrease in change of the leg length, as confirmed in this study, is the result of the knee joint ankle extending in the opposite direction.
It is also very similar to the results of Silder et al. (2015) in that when runs were conducted that applied loads of 10%, 20%, or 30% of the individual's body weight, leg length gradually decreased and leg stiffness increased.
Meanwhile, during locomotion, the decrease in lower-limb range of motion and the increase in PVF further increase leg stiffness (Butler et al., 2003; Grimston, Engsberg, Kloiber, & Hanley, 1991), and the two factors reportedly contribute to an increased risk of stress fractures
Table 4. Correlation results
(unit: r )
Section PVF Leg length Leg stiffness COG on the Y axis Contact time COG velocity
PVF 1 .274 .114 .248 -.281 -.390
Leg length 1 -.902
*-.148 -.330 -.187
Leg stiffness 1 .219 .251 .331
COG on the Y axis 1 .289 .408
Contact time 1 -.455
COG velocity 1
* p < .05
Figure 4. Scatter plot and regression equation