Print ISSN: 2288-4637 / Online ISSN 2288-4645 doi:10.13106/jafeb.2020.vol7.no12.1005
A Decision Support Model for Financial Performance Evaluation of Listed Companies in The Vietnamese Retailing Industry
Phi-Hung NGUYEN
1, Jung-Fa TSAI
2, Viet-Trang NGUYEN
3, Dang-Duong VU
4, Trong- Khoi DAO
5Received: September 10, 2020 Revised: November 02, 2020 Accepted: November 16, 2020
Abstract
This paper aims to propose a Comprehensive Decision Support Model to evaluate retail companies’ financial performance traded on the Vietnam Stock Exchange Market. The financial performance has been examined in terms of the valuations ratios, profitability ratios, growth rates, liquidity ratios, efficiency ratios, and leverage ratios. The data of twelve companies from the first quarter to the fourth quarter of 2019 and the first quarter of 2020 were employed. The weights of 18 chosen financial ratios are calculated by using the Standard Deviation method (SD).
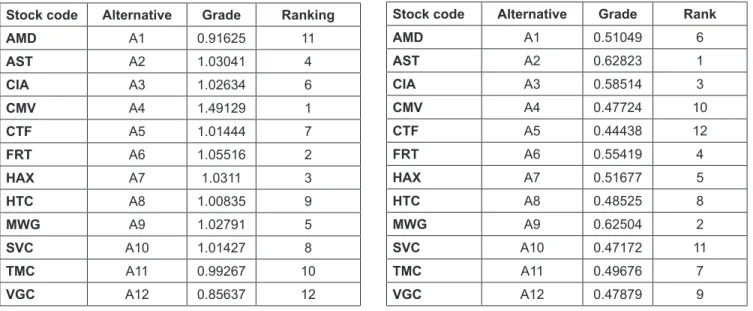
Grey Relational Analysis technique was applied to obtain the final ranking of each company in each quarter. The results showed that leverage ratios have the most significant impact on the retail companies’ financial performance and gives some long-term investment recommendations for stakeholders and indicated that the Taseco Air Services Joint Stock Company (AST), Mobile World Investment Corporation (MWG), and Cam Ranh International Airport Services Joint Stock Company (CIA) are three of the top efficient companies. The three of the worst companies are Viglacera Corporation (VGC), Saigon General Service Corporation (SVC), and HocMon Trade Joint Stock Company (HTC). Furthermore, this study suggests that the GRA model could be implemented effectively to ranking companies of other industries in the future research.
Keywords: Stock Exchange Market, GRA, Standard Deviation, Stock Investment, Vietnam JEL Classification Code: C02, C61, D53, Q14
for research, development, and application of advanced analytics, econometrics, and optimization methods in areas such as pricing and integrated marketing communications management (Pattanaik & Mishra, 2016). The retail industry is globalized without high-qualified employees in the units that manufacture and sell products to the market. The retail industry’s presence has been at a global level for centuries, but the global recognition of retailing came to light just two decades ago (Jagadeesha, 2012). A deeper understanding of three key areas is required: the approach to innovation management in the retail industry, the degree of heterogeneity of innovation, and innovation dynamics. For this reason, Pantano (2014) identified to what extent the similarities and differences in retail are key innovation drivers compared to other sectors. This author emphasized customer satisfaction as a significant challenge for the retail industry in the context of Malaysia. Because by satisfying customers, the retail industry can become more prosperous and thus will contribute more to the development of Malaysia’s economy by making a more significant contribution to the nation’s GDP.
Grocery retailers argue that it’s important to understand how to cultivate loyalty in different contexts. In the research of Kanakaratne et al., (2020), focus groups conducted in
1
First Author and Corresponding Author. PhD Researcher, Faculty of Business, FPT University, Hanoi, Vietnam [Postal Address: Hoa Lac High-Tech Park, Km 29, Thang Long Boulevard, Hanoi, 100000, Vietnam] Email: [email protected]
2
Department of Business Management, National Taipei University of Technology, Taipei, Taiwan. Email: [email protected]
3
Faculty of Business, FPT University, Hanoi, Vietnam.
Email: [email protected]
4
Faculty of Business, FPT University, Hanoi, Vietnam.
Email: [email protected]
5
Faculty of Business, FPT University, Hanoi, Vietnam.
Email: [email protected]
© Copyright: The Author(s)
This is an Open Access article distributed under the terms of the Creative Commons Attribution Non-Commercial License (https://creativecommons.org/licenses/by-nc/4.0/) which permits unrestricted non-commercial use, distribution, and reproduction in any medium, provided the original work is properly cited.
1. Introduction
1.1. Retailing in Viet Nam
Retailing is the process of selling consumer goods or services through multiple distribution channels for profit.
Retailers meet identified needs through a supply chain
(Purvis, 2019), (Grewal et al., 2009). Retail offers set up
culturally and structurally different countries such as the UK and Sri Lanka provide unique insights. Key differences were identified around consumers’ preferences and perceptions of loyalty programs and critical drivers of different types of loyalty, examining the impact of national culture and industry structure on customer loyalty in grocery retail.
However, in many businesses, service failures can emerge despite consistent avoidance efforts. Hafiz et al., (2014) investigated the relationship between service recovery and customer satisfaction in the co-creative retail industry. A conceptual framework showed that customer satisfaction was influenced by three aspects of service recovery justice, namely outcome justice, procedural justice, and interaction justice. The importance of service recoveries in winning back frustrating customers.
In recent years, the combination of economic growth and population growth in emerging markets and less developed markets has accelerated the progression of globalization of retailing and globalization by retailers. The challenges faced by global and globalizing retailers can be more daunting compared to those faced by firms in other industries such as automobiles, steel, and computers. Retailing innovations that are responsive to the characteristics of distinctive national markets and broader aggregations of markets such as mature, emerging and less developed markets are critical to the success of global and globalizing retailers. Towards this end, Reinartz et al., (2011) first examined the environmental conditions of markets in different development stages, namely mature, emerging and less developed markets, and explore consumer based, industry based, and legal/
regulatory based challenges faced by globalizing retailers in these markets. Second, they showed how these challenges could be transformed into opportunities with retailing innovations.
Wiese et al., (2012) analyzed past and current sustainability considerations and developments in scientific research and practices with a focus on the role of retailers in the supply chains. In retail research, there seems to be a time lag of more than ten years in using the term sustainability compared to other fields in research and industry. However, some of these other research fields and industries have an impact on retail supply chains. At the same time, it seems that sustainability has received more attention in retail management practice compared to research applications.
The retail industry in the Vietnam market is tending to grow fast and vigorously. The retail market is currently divided by categories such as product portfolio, distribution channel, and market dynamics. In 2019, Vietnam’s retail market witnessed foreign retailers withdrawing from the Vietnamese market, proving that domestic brands are increasingly asserting their foothold in the domestic market.
Besides, the most significant merging case of VinCommerce
and Agricultural Production Development Investment Company Limited (VinEco) into Masan Consumer Goods Company aimed to optimize the strength of each party with the ambition to create a new group of consumer goods - retail with outstanding competitiveness and leading scale in Vietnam have shown the determination to dominate the domestic market of enterprises in the country at the end of 2019. In the first quarter of 2020, due to being affected by Covid-19, Vietnam’s retail market did not have a steady growth compared to the same period of the previous years. In 2020, the trend of consumers using e-commerce will increase due to the sudden increase in the number of mobile phone users creating favorable conditions for online purchases on mobile devices to explode.
1.2. The impacts of Covid-19 on Retail Industry The global economy is likely to be subdued but positive, with lower growth in consumer spending and inflation in most countries remaining low. Further uncertainty surrounding the global economy has been added by the Coronavirus (Covid-19) outbreak in China early in December 2019. As Covid-19 spreads and its impact on daily life continues to increase, individuals and businesses need to respond. The retail sector has significant exposure to the potential impact of viruses. From dependence on Chinese manufacturing, global supply and distribution chains are complex networks and, in the case of many retailers - reliance on a large workforce and direct customer interface.
These factors expose areas to a unique set of circumstances.
Online retailers also suffer if last-mile deliveries are banned due to the risk that they may accelerate the rate of infection.
It led to the risk associated with business interruption and lost revenue, and retailers will also need to consider the impact a reduction in the availability of goods, or goods at a significantly reduced margin will have on the overall sustainability of their business (Sievers, 2013).
The outbreak of Covid-19 not only directly affected the business situation of Vietnamese retail businesses, but has also affected consumers’ habits, resulting in a sharp decrease in the purchasing level of many items.
The retail market fluctuates, changes in consumption
of goods to prevent epidemics. Some “hot” items were
bought for stock in urban areas: Convenience foods and
spices, instant foods, household detergents, and personal
hygiene to maintain hygiene and disinfect, anti-epidemic
health products such as masks, mouthwashes, bactericidal
water, disinfectants, tonics, and vitamins, etc. Meanwhile,
items such as sale of non-alcoholic and alcoholic drinks
decreased; Beer and beverages recorded a sharp decline
in consumption. On the other hand, consumers were wary
of categories such as fresh meat, fresh vegetables, and
seafood during the outbreak.
As a result of the literature review, evaluating the financial performance of a company and investigating the determinants of the stock have attracted interest from various parties such as managers, creditors, financial experts, current/potential investors, and researchers. In order to analyse the performance of an organization in any industry, all of the previous researches investigated numerous factors including economic factors, environmental factors, social factors and service quality (Tran et al., 2020). Lee and Brahmasrene (2018) examined short-run and long-run dynamic relationships between selected macroeconomic variables and stock prices in the Korea Stock Exchange.
Their results of vector error correction model (VECM) estimates pointed out that money supply and short-term interest rates were not related to stock prices in the short- run. However, exchange rate was positively related to stock prices while the industrial production index and inflation are negatively related to stock prices in the short- run. Furthermore, the VECM estimates indicated that the external shock, such as regional and global financial crisis shocks, neither affects changes in the endogenous variables nor causes instability in the cointegrating vector. Al- Haroot (2016) also examined the impact of mergers on the financial performance of the Jordanian public shareholding
companies. Four measures of financial performance (FP) were used, which are return on assets (ROA), return on equity (ROE), earnings per share (EPS), and net profit margin (NPM). Their findings in general showed no significant impact of mergers on the financial performance of merging firms using the change model.
Recently, Kanakriyah (2020) determined the nature of the association between dividend policy and a corporation’s financial performance in emerging countries, as well as the main variables that may have an effect on financial performance. This study included 92 industrial and service sector companies listed on the Amman Stock Exchange (ASE) during the period 2015 to 2019. A multiple regression model was also developed in order to test whether guess factors may have a possible impact on financial performance (such as Dividend Yield, Dividend Pay-out Ratio, Firm Size, Leverage Ratio, Current Ratio). Caliskan Cavdar and Aydin (2020) applied the methods of Artificial Neural Networks and Genetic Algorithm (GA) to predict the Borsa Istanbul 30 index movements to determine the most accurate buy and sell decisions. Their experimental results indicate that their best proposed hybrid model has a successful forecast rate of 75%, which is higher than the single ANN or GA forecasting models.
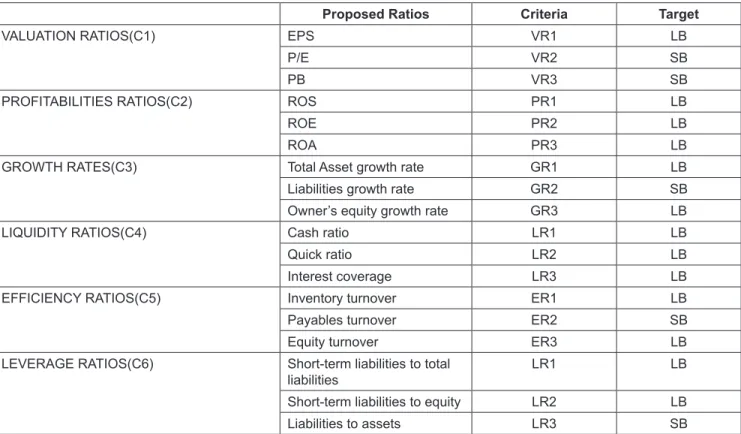
Table 1: Proposed financial ratios
Proposed Ratios Criteria Target
VALUATION RATIOS(C1) EPS VR1 LB
P/E VR2 SB
PB VR3 SB
PROFITABILITIES RATIOS(C2) ROS PR1 LB
ROE PR2 LB
ROA PR3 LB
GROWTH RATES(C3) Total Asset growth rate GR1 LB
Liabilities growth rate GR2 SB
Owner’s equity growth rate GR3 LB
LIQUIDITY RATIOS(C4) Cash ratio LR1 LB
Quick ratio LR2 LB
Interest coverage LR3 LB
EFFICIENCY RATIOS(C5) Inventory turnover ER1 LB
Payables turnover ER2 SB
Equity turnover ER3 LB
LEVERAGE RATIOS(C6) Short-term liabilities to total
liabilities LR1 LB
Short-term liabilities to equity LR2 LB
Liabilities to assets LR3 SB
Multi-criteria decision making (MCDM) methods have been used systematically as a tool to aid in the financial decision-making (Zopounidis & Doumpos, 2002). Especially, the application of MCDM in financial decisions has increased dramatically with the number of publications since 2002 (Brauers & Zavadskas, 2012; Hu
& Tsai, 2009; Hu et al., 2012; Mondragon et al., 2019;
Nguyen et al., 2020; Zavadskas et al., 2004) (Nguyen et al., 2020). As regards, Yüksel et al., (2017) measured the financial performance in Turkish banking sector and to combine the data mining with the multi-criteria decision-making methods. Their results showed that integrated models gave the coherent outcomes and the text-mining process could be adapted properly in the multi-criteria decision-making methods. In the study of Bulgurcu (2012), this author measured and compared the financial performance of thirteen technology firms trading in Istanbul Stock Exchange. These firms were examined and assessed in terms of ten financial ratios which are combined to obtain a financial performance score by using Technique for Order Preference by Similarity to Ideal Solution Methods (TOPSIS).
Furthermore, we have found that GRA approach has been used in a wide range of areas in many countries, especially in performance evaluation. However, especially in evaluating the financial performance of the retailing companies listed in the Vietnam Stock Exchange Stock, the application of the GRA method was not available in any specific performance evaluation case in Vietnam.
Therefore, this study focus on how the research is deployed in the MCDM model based on the SD and GRA methods to give stock selection recommendations in a specific industry in Vietnam. The research has selected 18 financial ratios which belong to five groups of financial indicators. The data of financial ratios of five quarters have been collected and analyzed based on the GRA model. This financial ratios selection has been carefully chosen, which was suitable and highly appreciated by the retail industry in Vietnam. The GRA has been applied to rank stocks of each quarter of 2019 and the 1
stquarter of 2020. This study not only helps to see how the performance of each company changes in each quarter, but it also helps to keep an eye on the retail industry under Covid-19 impacts. The second is based on the results of this research; investors will have a new perspective in making their investment options.
After the introduction section, this study is organized as follows: Section 2 briefly explained the financial performance evaluation and proposed financial ratios. In Section 3, a Decision Making Support Model based on SD and GRA are summarized. An empirical case analysis in the retail industry is discussed. Section 4 concludes the paper presenting our findings, and insights for future studies are clarified.
2. Financial Performance Evaluation and Proposed Financial Ratios
Evaluation of a company’s operating performance is particularly critical because it is directly related to the company’s benefit. By analyzing all financial indicators and making judgments based on the main criteria of financial capacity shown in the latest financial statements such as total assets, total revenue, profits, effective use of capital, the growth rate of revenue, profits, and operation plan in that year. We can see that profitability and solvency are the two main factors of the operating performance of the retail industry listed companies. The annual list of the world’s largest retail chains always contains all of the largest and most recognized US retailers. Walmart, Costco, Kroger, Home Depot, and Target are still retail industry leaders. In Vietnam, Vincommerce and Mobile World are the two names with the most prestigious scores and maintain the top positions. Specifically, for the Mobile World, financial income and expenses accounted for a relatively small proportion of profits as the company focused on retail chains. In general, most of the items in equity tend to increase; the increase in equity comes from the increase in undistributed profits after tax. The assessment at the firm level is essential for managers as well as for investors. As a result of the performance analysis, managers who are in a decision-making position in enterprises will be able to make plans in an even more conscious way in the effective use of related resources and increasing efficiency in general. Investors will be more rational and conscious about their investment decisions, and their portfolio in the light of the analysis and evaluations made. With the globalization process, competition and uncertainty are among the factors which affect business activities most.
Decision making is briefly defined as the process of choosing among alternatives. In today’s decision-making process, the excess of alternatives, and the fact that the criteria which affect the decision will be taken both to make the decision complicated. Under these circumstances, it is recommended to use multi-criteria decision-making techniques instead of traditional techniques in the process.
If there are multiple criteria and objectives in a decision- making problem, such a decision-making problem can be solved through multi-criteria methods. Performance appraisal of companies requires a very critical decision.
This study analyzes the financial performance of retailing
companies in 2019 and the first quarter of 2020, indexed on
the Vietnam stock exchange market. The data was extracted
from the VietStock database (https://vietstock.vn/). Vietstock
database applied the North American Industry Classification
System (NAICS 2007) for industry classification because
of its popularity, comprehension and logical order.
In addition, it receives many supports from international organizations and bears a lot of similarities to Vietnam Standard Industrial Classification (VSIC 2007). During this period, only 12 among 22 companies, listed on HOSE and HNX had full eighteen financial ratios to assess the company’s financial situation. Financial performances of retailing companies in 2019 to the first quarter 2020 period have been examined in terms of the valuation ratios, profitability ratios, growth ratios, liquidity ratios, efficiency ratios, and leverage ratios. The proposed financial ratios used in the analysis are presented in Table 1.
3. Methodology
The evaluation procedure in this research consists of four main steps as summarized below in Figure 1.
Step 1: Identify the evaluation criteria considered as the most important performance measures for the manufacturing industry.
Step 2: Construct the hierarchy of the evaluation criteria and calculate the weights of these criteria using The Standard Deviation (SD) method.
Step 3: Conduct the final ranking results
Step 4: Conduct the Grey Relational Analysis (GRA) to evaluate and compare the ranking results according to the methods below.
3.1. Standard Deviation Method
According to the evaluation procedure, we used the Standard Deviation (SD) method to weight the criteria of retail firms listed. It is defined as the square root of the variance, which is the average of the squared differences between data points and the mean. STD, σ being the square root of that quantity; therefore, measures the spread of data about the mean (Roth et at., 1994), it can be described as follows:
0
w
j njj j
σ
=
σ
= ∑ j = 1, …, n (1)
2
σ
1−
=
−
= ∑mi ij i j
x x
m j = 1, …, n (2)
Where x
jis the average data of the considered criteria.
The SD method is not as accurate as the Entropy method because its results may be affected by the range of different criteria, while the normalization process in entropy prevents this from being misleading.
3.2. Grey Relational Analysis Technique
Grey Systems theory was initiated in 1982 by Professor Julong Deng. As a superiority to conventional statistical models, grey models require only a limited amount of data to estimate the behavior of unknown systems. It can be used in the practical factor assessment and used in large samples where data are not available or uncertain whether the data was representative (Huang, 2011). There are seven main topics in the application of Grey System Theory, namely grey relational space, grey generating space, grey forecasting, grey decision making, grey control, grey mathematics, and grey theory (Deng J, 1989). This study has approached the GRA method to evaluate the financial performance of retail companies listed indexed on the Vietnam Stock Exchange Market. Application steps of the GRA method can be described as follows:
Step 1: Construction of the decision matrix: Assuming that there are n data sequences (retail companies in this study) characterized by m criteria (18 financial ratios are selected for this study); the compared sequences can be shown in a matrix form:
( ) ( ) ( ) ( ) ( ) ( ) ( ) ( ) ( )
1 1 1
2 2 2
1 2 1 2 1 2
n n n
x x x m
x x x m
X
x x x m
=
(3)
Where x
i(j) is the value of the retail company correspon- ding to the j
thfinancial ratio (i=1, … , n; j=1, … , m).
Step 2: Normalization of the data set: To obtain comparable scales, the data set is normalized. The data can be normalized by one of the two regimes: larger the better and smaller the better.
For larger is better normalization, the formula to transform x
i(j) to x
i*(j) is defined as:
( ) ( ) ( )
( )
1( )
*
1
1
j
i in ii n n
i i i i
x j min x j x max x j min x j
=
= =
−
−
=
(4)
The Standard Deviation (SD) Method
GRA
Figure 1: The evaluation procedure in this research
Where γ
0i(j) is the grey relational coefficient of the j
thfinancial ratio, and ζ is the distinguishing coefficient.
This coefficient is a value between 0 and 1. However, ζ usually ranges between 0.1 and 0.5 and reduces the effect of extremely large max max
ni=1 mj=1∆
0i( ) j in cases where data variation is large.
Step 6: Calculation of the grey relational grades: If weights of the financial ratios are determined, the grey relational grade is calculated as follows:
[ ]
0 =1
w( ) γ
0( ) ,
=1w( ) 1
Γ =
i∑
mjj ×
ij ∑mj j = (12) Where Γ
0i is the grey relational grade, and w(j) is the weight of the jth financial ratio in this study.
In short, the performance of retail companies can be ranked according to the grey relational grades. The higher grey relational grade shows the better financial performance.
4. Results and Discussion
To measure retail businesses’ financial performances over four quarters of 2019 and the first quarter of 2020, the research used 6 financial ratios, including valuation ratios, profitability ratios, growth ratios, liquidity ratios, efficiency ratios, and leverage ratios. It is clear that the more significant the proportion of each ratio, the more it affects the company’s growth and profitability. Overall, the weight of 18 ratios has been determined to be quite similar, and the fluctuations were not significant over 5 quarters. The weight fluctuates from 4%
to 6% in the 18 indicators, sometimes 7%. In which, there are indicators that have remained nearly unchanged from quarter to quarter, such as the valuation ratios, profitability ratios, and efficiency ratios. On the other hand, some indicators changed up and down dramatically over the quarters. Specifically, in the second quarter of 2019, the quick ratio accounts for the highest proportion, with 6.62%. However, in the next quarter, this ratio drops significantly, with 4.85%. Based on the result in the above table, it can be seen that the leverage ratio accounts for the highest weight in the 18 calculated indicators, in which short- term liabilities to total liabilities have come to fore in this ratio.
To sum up, the leverage ratios have the most significant impact on the financial performance of retailing companies.
The standard deviation is calculated as the square root of variance by determining each data point’s deviation relative to the mean. If the data points are further from the mean, there is a higher deviation within the data set; thus, the more spread out the data, the higher the standard deviation.
Standard deviation is an incredibly useful tool in trading and investment strategies because it helps measure market volatility and security —and predict trends in action. By calculating the standard deviation of the business’s financial indicators, the research team has helped the research team calculate the weights of the criteria, making the process of applying the GRA method easier.
where min
in=1 x j
i( ) is the minimum value of the jth financial ratio and max
in=1 x j
i( ) is the maximum value of the j
thfinancial ratio.
For smaller is better normalization, the formula as follows:
( ) ( ) ( )
( ) ( )
i 1n i i
*i n n
i 1 i i 1 i
max x j x j
x j max x j min x j
=
= =
−
= − (5)
Step 3: Construction of the normalized and generation of the reference sequence: After the normalization process, Equation (6) shows the normalized matrix, which is the revised version of the initial decision matrix, and Equation (7) shows the reference sequence.
( ) ( ) ( ) ( ) ( ) ( )
( ) ( )
* * *
1 1 1
* * *
2 2 2
*
* * *
1 2 x 1 x 2 x
x 1 x x
n n n
x x x m
m X
m
=
(6)
( ) ( ) ( ) ( )
* * * * *
0
1 ,
0 02 , ,
0, ,
0x = x x … x j … x n (7) where x j
*0( ) is the reference value for the jth financial ratio and is determined by Equation (8)
( ) ( )
* *
0 n1
i i
x j = max
= x j (8) Step 4: Construction of the difference matrix: ∆
0i(j) is the absolute value of the difference between the normalized value and the reference value of the j
thfinancial ratio and is calculated by Equation (9).
( )
*( )
*( )
0i
j x j x j
0 i∆ = − (9)
After the calculation of ∆
0i(j) values, the constructed difference matrix is shown in Equation (10).
( ) ( ) ( ) ( ) ( ) ( )
( ) ( ) ( )
01 01 01
02 02 02
0n 0n 0n
1 2
1 2
1 2
m m m
∆ =
∆ ∆ ∆
∆ ∆ ∆
∆ ∆ ∆
(10)
Step 5: Calculation of the grey relational coefficient:
The grey relational coefficient is a calculation using the equation:
1 1 0
1 0 ( ) max max ( )
0
0 1 1 0
( ) min
( ) max max ( )
γ
ζζ
= =
= + × ∆
= =
= ∆
∆ + × ∆
n m
i j i
ni i j j
i n m
i i j i