http://crossmark.crossref.org/dialog/?doi=10.14474/ptrs.2019.8.4.234&domain=pdf&date_stamp=2019-12-25
Received: 22 October, 2019 Revised: 16 November, 2019 Accepted: 18 November, 2019 Corresponding author: Suk-Min Lee (ORCID https://orcid.org/0000-0002-6062-956X)
Department of Physical Therapy, College of Health and Welfare, Sahmyook University, 815 Hwarang-ro, Nowon-gu, Seoul 01795, Republic of Korea Tel: 82-2-3399-1632 Fax: 82-2-3399-1639 E-mail: leesm@syu.ac.kr
This is an Open-Access article distributed under the terms of the Creative Commons Attribution Non-Commercial License (http://creativecommons.org/licenses/
by-nc/4.0) which permits unrestricted non-commercial use, distribution, and reproduction in any medium, provided the original work is properly cited.
Copyright © 2019 Korean Academy of Physical Therapy Rehabilitation Science https://doi.org/10.14474/ptrs.2019.8.4.234
pISSN 2287-7576 eISSN 2287-7584
Phys Ther Rehabil Sci 2019, 8 (4), 234-241 www.jptrs.org
The relationship between workplace violence, depression, burnout, subjective health status, job and life satisfaction of physical therapists in South Korea
Yoon-Jung Hur a , Ho-Young Kim b , Suk-Min Lee c
a
Rehabilitation 1 team, Yonsei University Health System, Severance Rehabilitation Hospital, Seoul, Republic of Korea
b
Department of Physical Therapy, The Graduate School, Sahmyook University, Seoul, Republic of Korea
c
Department of Physical Therapy, College of Health Science and Social Welfare, Sahmyook University, Seoul, Republic of Korea
Objective: To investigate the physical therapists’ actual experience of workplace violence and examine its relationship with de- pression, burnout, subjective health status, and job and life satisfaction.
Design: Cross-sectional study.
Methods: The level of workplace violence was assessed using the Korean Workplace Violence Scale composed of 24 questions in the following 4 subscales of workplace violence. Depression was assessed using the Korean version of the Patient Health Questionnaire-9. Burnout was assessed using the Korean version of the Maslach Burnout Inventory-Human Services Survey, which is a 5-item scale. Subjective health status was measured on a 5-point scale. Job and life satisfaction was measured based on the assessment tool used in the World Values Survey.
Results: There was a significant correlation between the three subscales of workplace violence and health indicators, including depression, subjective health status, job and life satisfaction (p<0.05). The organizational protective system subscale showed a sig- nificant negative correlation with depression and a positive correlation with subjective health status as well as job and life sat- isfaction (p<0.05). The area of ‘psychological and sexual violence from customers’ showed a significant moderate correlation with depression and job satisfaction (p<0.05). Also, there was a negative correlation that was significant between depression and sub- jective health status, job satisfaction, and life satisfaction (p<0.05).
Conclusions: This study suggested that future studies should continue to investigate and reveal the causal relationships between workplace violence and physical therapists’ health indicators.
Key Words: Burnout, Depression, Job and life satisfaction, Physical therapist, Subjective health status, Workplace violence
Introduction
Workplace violence has become a global social problem.
In Korea, the service industry’s distinct characteristics of supporting an organizational culture of violence has been raised as a social issue. The US Department of Labor’s Oc- cupational Safety and Health Administration (OSHA)’s sur- vey included workplace violence among the top four causes of industrial accident deaths in the last ten years. It was also
found that around 170,000 workers in London experienced workplace violence such as sexual assaults and harassment, threats, and insults in 2013. Such workplace violence is a factor that not only reduces the efficiency and productivity of organizations [1] but also threatens the health of in- dividuals who have been subjected to violence. Given its negative effects on organizations and individuals, greater ef- forts are being made to reduce workplace violence [2-4].
The World Health Organization has categorized work-
place violence into two types: physical violence (e.g., beat- ing, kicking, striking, shooting, pushing, biting, and pinch- ing) and mental violence (e.g., threats of physical force;
mental, spiritual, and moral violence; or violence that can harm social development) [5]. Workplace violence is the most complex and dangerous occupational risk factor in the health care work environment [6], and its health effects are found to be relatively consistent. Experiencing workplace violence, bullying, and verbal violence increases the risks of mental health problems, including depression. Some studies have reported an association between the effects of work- place violence experiences on physical health [7], such as in- creased sleep problems [8,9], increased musculoskeletal symptoms [10], and negative changes in subjective health status [11]. Experiences of physical, mental, and verbal vio- lence lead to decreased morale due to factors such as in- creased job stress, lower productivity, reduced positive con- fidence about the career, and job satisfaction that in turn im- pede efficient work performance. In addition, these factors increase turnover intention by deprivation of a sense of ach- ievement while increasing job dissatisfaction [12-14]. These behavioral consequences negatively affect co-workers in the same space, causing the entire group to experience burnout [15].
It has been reported that among various workplace vio- lence cases, health professionals, both employees and nurses working in hospitals, experience work-related violence at least once but they are often coerced into silence due to the location’s unique characteristics, in which medical person- nel from diverse specialties collaborate with specialists [16].
According to Statistics Korea data [17] released in 2019, the number of clinical physical therapists was 41,113, in- dicating that the job accounts for a large proportion of health professionals. The physical therapists’ duties are comprised of meeting patients or their caregivers and personally caring for those who are physically and mentally unstable, or show low judgement and agitated emotions due to unexpected sit- uations, such as sudden injury or illness. Hence, physical therapy is one of the professional groups that is most fre- quently exposed to physical contact and verbal abuse. The health of the physical therapists should be managed with care because their work performance influences not only the patients or their caregivers and the therapists themselves but also the overall quality of rehabilitation services. For effec- tively managing their health, a safe working environment must be ensured. The nation’s prior research on workplace violence is often directed mainly at private sectors, such as
nurses, flight attendants and hotel workers, and studies by standardized workplace violence assessment tools tailored to the country’s circumstances are very rare. This study, therefore, investigates the actual experience of workplace violence in physical therapists using the Korean Workplace Violence Scale (K-WVS) in which the level of emotional la- bor that physical therapists experience has been standard- ized. The specific research goals are as follows:
1) To investigate the actual experience of workplace vio- lence in physical therapists.
2) To examine the level and intensity of the subscales of workplace violence according to the physical thera- pists’ general characteristics.
3) To examine the correlations between workplace vio- lence, depression, burnout, subjective health status, and job and life satisfaction in physical therapists.
Methods Participants
A structured self-reported survey was conducted with physical therapists working at hospitals, welfare centers, and public and private institutions nationwide, to investigate their actual experiences of workplace violence and to exam- ine its relationship with depression, burnout, subjective health status, and quality of life. A total of 1,250 copies of the ques- tionnaire were distributed, of which 1,092 were collected.
Of these, 950 were included in the final analysis, excluding 142 incomplete responses. The survey was conducted after receiving consent forms confirming the respondents’ volun- tary participation in the survey (IRB No. 2-7001793-AB- N-012018119HR).
Measures
The questionnaire used was a structured self-admini- stered questionnaire consisting of 14 questions on the re- spondents’ general and job characteristics, 24 on workplace violence, 9 for depression screening, 5 on burnout, 1 on sub- jective health status, and 2 related to job and life satisfaction.
Workplace violence
The level of workplace violence was assessed using the
K-WVS [18] composed of 24 questions in the following 4
subscales of workplace violence: ‘Organizational protective
system for workplace violence (14 questions)’, ‘Experien-
ces of psychological and sexual violence from supervisors
and coworkers (4 questions)’, ‘Experiences of psychologi-
cal and sexual violence from customers (4 questions)’, and
‘Experiences of physical violence from customers, super- visors, and coworkers (2 questions)’ [18]. Higher total scores on this measure indicate a higher degree of workplace vio- lence.
A reliability test conducted to determine the internal con- sistency of the four subscales of workplace violence yielded Cronbach’s α values of 0.757, 0.755, 0.963, and 0.650, for
‘psychological and sexual violence from customers,’ ‘psy- chological and sexual violence from supervisors and cow- orkers,’ ‘physical violence from customers, supervisors and coworkers’ and ‘organizational protective system for work- place violence,’ respectively. The assessment scores for each subscale of workplace violence were converted into a maximum score of 100 points in accordance with the for- mula presented below.
Converted score for each subscale
=
(sum of scores on each item in the respective subscale− number of items) ×100 (the highest possible total score for the respective
subscale−number of items) Depression
Depression was assessed using the Korean version of the Patient Health Questionnaire-9, a depression screening tool originally developed by Spitzer et al. [19] and translated into Korean by Han et al. [20]. It diagnoses major depression and is reported to have excellent sensitivity and specificity (88%
for each). The questionnaire consisted of 9 questions related to: ‘little interest in doing things,’ ‘feeling depressed,’ ‘sleep disorders,’ ‘feeling tired,’ ‘poor appetite or overeating,’
‘feelings of being a loser,’ ‘trouble concentrating,’ ‘moving slowly or being restless,’ and ‘thoughts of hurting oneself’.
It examined how often the research participants experienced each item in the past two weeks. For each item, they were asked to check the response that best described their severity of symptoms, on a scale of 0 to 3 points, and the total points were then computed [20]. Higher total scores on this meas- ure indicate a higher degree of depression. While Han et al.
[20] reported Cronbach’s α value for the questionnaire as 0.820, this study’s Cronbach’s α value was 0.853.
Burnout
For burnout assessment, 5 items were used from the Korean Maslach Burnout Inventory-Human Services Sur- vey (MBI-HSS) form, based on the original MBI-HSS de-
veloped by Maslach et al. [21]. Measured on a 4-point Likert scale, where ‘1’ corresponds to ‘Not at all’ and ‘4’ to
‘Extremely so’ where the higher the total score, higher total scores on this measure indicate a higher degree of burnout [21]. The reliability of the original tool was Cronbach’s α
=0.760, while the scale used in this study indicated Cronbach’s α=0.917.
Subjective health status
Subjective health status was measured on a 5-point scale (‘Very good,’ ‘Fairly good,’ ‘Acceptable,’ ‘Rather poor,’ and
‘Very poor’) using the question, ‘Overall, what is your sub- jective heath status?’ Higher scores denoted better perceived subjective health status.
Job and life satisfaction
Job and life satisfaction was measured based on the as- sessment tool used in the World Values Survey [22]. The life satisfaction questionnaire consists of three items; ‘work sat- isfaction (job satisfaction),’ ‘family life satisfaction,’ and
‘satisfaction for my life’ [22]. Items were measured on a 10-point scale, with 1 point for ‘Very unsatisfactory’ to 10 points for ‘Very satisfactory.’ This study used two of the three items: ‘work satisfaction (job satisfaction)’ and ‘satis- faction for my life.’
Data analysis
Subjects’ demographic characteristics were expressed in
frequencies and percentages or means and standard devi-
ations. To determine the level of workplace violence along
with the participants’ general and job characteristics; t-test,
ANOVA, rank sum, and the Kruskal-Wallis tests were per-
formed according to data distribution. Since scores from
factors such as ‘psychological and sexual violence from su-
pervisors and coworkers,’ ‘psychological and sexual vio-
lence from customers,’ and ‘physical violence from custom-
ers, supervisors, and coworkers’ showed right-skewed dis-
tributions, nonparametric methods such as the rank sum and
the Kruskal-Wallis tests were used to verify the differences
between the groups. The spearman correlation analysis was
conducted to verify the relationship between workplace vio-
lence and other attributes known to be associated with it,
such as depression, burnout, subjective health status, and job
and life satisfaction. All statistical analyses were performed
using the SAS 9.2 (SAS Institute Inc., Cary, NC, USA) and
were determined to be significant at p<0.05.
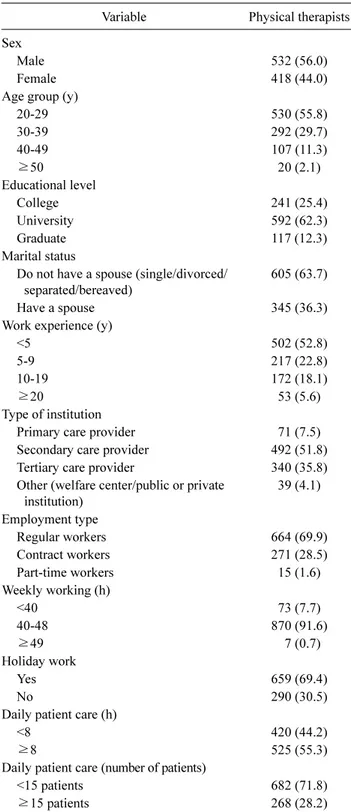
Table 1. General and job characteristics of participants (N=950)
Variable Physical therapists
Sex Male 532 (56.0)
Female 418 (44.0)
Age group (y)
20-29 530 (55.8)
30-39 292 (29.7)
40-49 107 (11.3)
≥50 20 (2.1)
Educational level
College 241 (25.4)
University 592 (62.3)
Graduate 117 (12.3)
Marital status
Do not have a spouse (single/divorced/
separated/bereaved) 605 (63.7)
Have a spouse 345 (36.3)
Work experience (y)
<5 502 (52.8)
5-9 217 (22.8)
10-19 172 (18.1)
≥20 53 (5.6)
Type of institution
Primary care provider 71 (7.5)
Secondary care provider 492 (51.8)
Tertiary care provider 340 (35.8)
Other (welfare center/public or private
institution) 39 (4.1)
Employment type
Regular workers 664 (69.9)
Contract workers 271 (28.5)
Part-time workers 15 (1.6)
Weekly working (h)
<40 73 (7.7)
40-488 70 (91.6)
≥49 7 (0.7)
Holiday work
Yes 659 (69.4)
No 290 (30.5)
Daily patient care (h)
<8 420 (44.2)
≥8 525 (55.3)
Daily patient care (number of patients)
<15 patients 682 (71.8)
≥15 patients 268 (28.2)
Values are presented as n (%).
Results
General characteristics of the participants
Nine-hundred and fifty participants participated in this
study. The general and job characteristics are shown in Table 1.
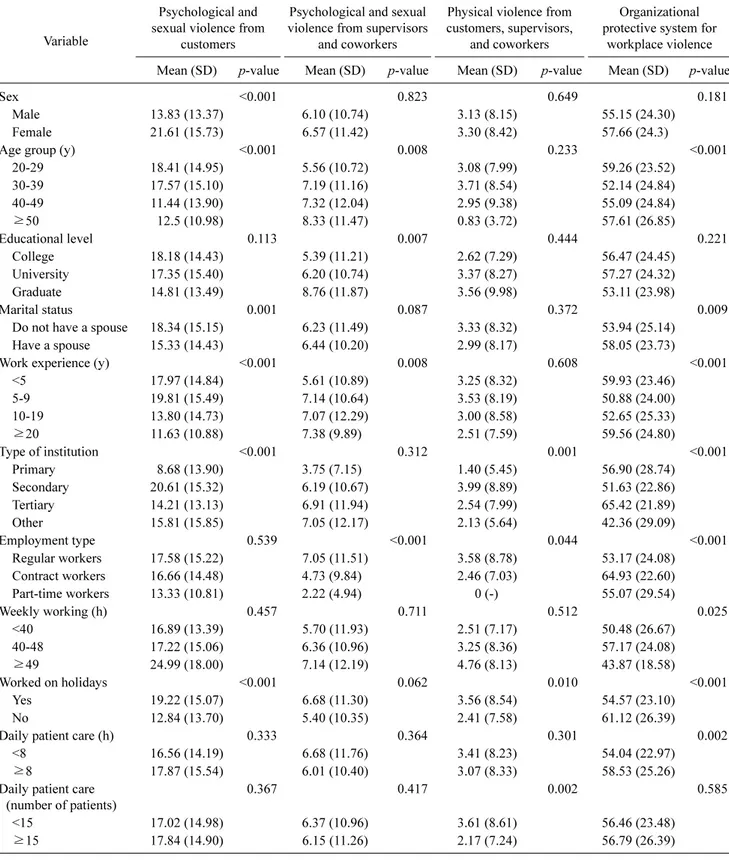
Relationships between the four sub-scales of workplace violence and general and job characteristics
The mean score and standard deviation for workplace vio- lence in each subscale was examined along with the partic- ipants’ general and job characteristics. Compared to the physical therapists in other groups, the level of workplace violence was significantly higher statistically in the ‘psy- chological and sexual violence from customer’ sub-scale for female physical therapists in their 20s, having no spouse, work experience of five or more years but less than 10 years, working as secondary care providers, or working on holi- days. In the ‘psychological and sexual violence from super- visors and coworkers’ sub-scale, the level of workplace vio- lence was statistically significant for physical therapists in their 50s or above, with graduate school or higher educa- tional level, who had been working for 20 years or longer, as regular workers. Compared to physical therapists in other groups, the level of workplace violence was higher for phys- ical therapists who worked as secondary care providers, were regular workers, worked on holidays, or cared for less than 15 patients a day in the subscale of ‘physical violence from customers, supervisors and coworkers.’ In the sub- scale of ‘organizational protective system for workplace vi- olence,’ the level of workplace violence was lower for phys- ical therapists in their 30s, having no spouse, who had been working for 5 years or more but less than 10 years at in- stitutions other than medical institutions, were regular work- ers working 49 hours or more a week, including holidays, or who cared for patients less than 8 hours a day. The variables mentioned in each scale were statistically significant (α=
0.05) (Table 2).
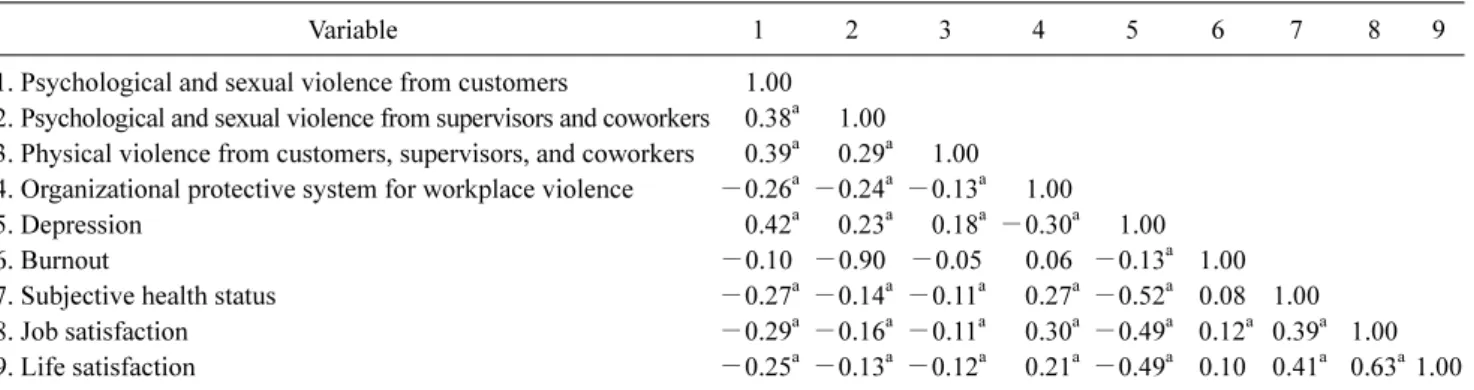
Correlation between workplace violence and depres-
sion, burnout, subjective health status, and satisfaction
Correlation analysis between the four subscales of work-
place violence and depression, burnout, subjective health
status, and job and life satisfaction revealed that three work-
place violence subscales (e.g., psychological and sexual vio-
lence from customers, psychological and sexual violence
from supervisors and coworkers, physical violence from
customers, supervisors, and coworkers) had a significant
negative correlation with health indicators such as subject-
ive health status, and job and life satisfaction. However,
these subscales had a strong positive correlation with de-
pression (psychological and sexual violence from custom-
Table 2. Relationships between the four sub-scales of workplace violence and general and job characteristics Variable
Psychological and sexual violence from
customers
Psychological and sexual violence from supervisors
and coworkers
Physical violence from customers, supervisors,
and coworkers
Organizational protective system for
workplace violence Mean (SD) p-value Mean (SD) p-value Mean (SD) p-value Mean (SD) p-value
Sex <0.001 0.823 0.649 0.181
Male 13.83 (13.37) 6.10 (10.74) 3.13 (8.15) 55.15 (24.30)
Female 21.61 (15.73) 6.57 (11.42) 3.30 (8.42) 57.66 (24.3)
Age group (y) <0.001 0.0080.233 <0.001
20-29 18.41 (14.95) 5.56 (10.72) 3.08 (7.99) 59.26 (23.52)
30-39 17.57 (15.10) 7.19 (11.16) 3.71 (8.54) 52.14 (24.84)
40-49 11.44 (13.90) 7.32 (12.04) 2.95 (9.38) 55.09 (24.84)
≥50 12.5 (10.98) 8.33 (11.47) 0.83 (3.72) 57.61 (26.85)
Educational level 0.113 0.007 0.444 0.221
College 18.18 (14.43) 5.39 (11.21) 2.62 (7.29) 56.47 (24.45)
University 17.35 (15.40) 6.20 (10.74) 3.37 (8.27) 57.27 (24.32)
Graduate 14.81 (13.49) 8.76 (11.87) 3.56 (9.98) 53.11 (23.98)
Marital status 0.001 0.087 0.372 0.009
Do not have a spouse 18.34 (15.15) 6.23 (11.49) 3.33 (8.32) 53.94 (25.14)
Have a spouse 15.33 (14.43) 6.44 (10.20) 2.99 (8.17) 58.05 (23.73)
Work experience (y) <0.001 0.0080.608<0.001
<5 17.97 (14.84) 5.61 (10.89) 3.25 (8.32) 59.93 (23.46)
5-9 19.81 (15.49) 7.14 (10.64) 3.53 (8.19) 50.88 (24.00)
10-19 13.80 (14.73) 7.07 (12.29) 3.00 (8.58) 52.65 (25.33)
≥20 11.63 (10.88) 7.38 (9.89) 2.51 (7.59) 59.56 (24.80)
Type of institution <0.001 0.312 0.001 <0.001
Primary 8.68 (13.90) 3.75 (7.15) 1.40 (5.45) 56.90 (28.74)
Secondary 20.61 (15.32) 6.19 (10.67) 3.99 (8.89) 51.63 (22.86)
Tertiary 14.21 (13.13) 6.91 (11.94) 2.54 (7.99) 65.42 (21.89)
Other 15.81 (15.85) 7.05 (12.17) 2.13 (5.64) 42.36 (29.09)
Employment type 0.539 <0.001 0.044 <0.001
Regular workers 17.58 (15.22) 7.05 (11.51) 3.58 (8.78) 53.17 (24.08)
Contract workers 16.66 (14.48) 4.73 (9.84) 2.46 (7.03) 64.93 (22.60)
Part-time workers 13.33 (10.81) 2.22 (4.94) 0 (-) 55.07 (29.54)
Weekly working (h) 0.457 0.711 0.512 0.025
<40 16.89 (13.39) 5.70 (11.93) 2.51 (7.17) 50.48 (26.67)
40-4817.22 (15.06) 6.36 (10.96) 3.25 (8 .36) 57.17 (24.08 )
≥49 24.99 (18.00) 7.14 (12.19) 4.76 (8.13) 43.87 (18.58)
Worked on holidays <0.001 0.062 0.010 <0.001
Yes 19.22 (15.07) 6.68 (11.30) 3.56 (8.54) 54.57 (23.10)
No 12.84 (13.70) 5.40 (10.35) 2.41 (7.58) 61.12 (26.39)
Daily patient care (h) 0.333 0.364 0.301 0.002
<8 16.56 (14.19) 6.68 (11.76) 3.41 (8.23) 54.04 (22.97)
≥8 17.87 (15.54) 6.01 (10.40) 3.07 (8.33) 58.53 (25.26)
Daily patient care
(number of patients) 0.367 0.417 0.002 0.585
<15 17.02 (14.98) 6.37 (10.96) 3.61 (8.61) 56.46 (23.48)
≥15 17.84 (14.90) 6.15 (11.26) 2.17 (7.24) 56.79 (26.39)
ers: r=0.42, p<0.05; psychological and sexual violence from supervisors and coworkers: r=0.23, p<0.05; physical violence from customers, supervisors, and coworkers: r=
0.18, p<0.05). Burnout had no correlation with workplace
violence subscales. The ‘organizational protective system
for workplace violence’ sub-scale showed a negative corre-
Table 3. Correlation between workplace violence variables and health indicators
Variable 1 2 3 4 5 6 7 8 9
1. Psychological and sexual violence from customers 1.00 2. Psychological and sexual violence from supervisors and coworkers 0.38
a1.00 3. Physical violence from customers, supervisors, and coworkers 0.39
a0.29
a1.00 4. Organizational protective system for workplace violence −0.26
a−0.24
a−0.13
a1.00
5. Depression 0.42
a0.23
a0.18
a−0.30
a1.00
6. Burnout −0.10 −0.90 −0.05 0.06 −0.13
a1.00
7. Subjective health status −0.27
a−0.14
a−0.11
a0.27
a−0.52
a0.081.00
8. Job satisfaction −0.29
a−0.16
a−0.11
a0.30
a−0.49
a0.12
a0.39
a1.00
9. Life satisfaction −0.25
a−0.13
a−0.12
a0.21
a−0.49
a0.10 0.41
a0.63
a1.00
a