클러스터-표면 충돌시 부착 확률과 에너지 교환에 대한 분자동 력학 시물레이션
정승채
†· 서동욱
*· 윤웅섭
**Energy Exchanges and Adhesion Probability of Lennard-Jones Cluster Colliding with a Weakly Attractive Static Surface
Seung-chai Jung, Donguk Suh and Woong-sup Yoon
Key Words : Adhesion(부착), Collision(충돌), Cluster(클러스터), Molecular dynamics simulation(분자 동력학 시물레이션)
Abstract
Classical molecular dynamics simulations (MDS) were conducted to simulate nano-sized cluster collisions with a weakly attractive static surface. Energy exchanges associated with the cluster collision and the adhesion probability are discussed. Routes of the energy exchanges and the kinetic energy loss are vastly altered in their mode according to the cluster incident velocity. In the elastic collision regime (V0<0.1), most incident kinetic energy is recovered into the rebounding kinetic energy, but a little loss in the incident kinetic energy causes the cluster adhesion. Dissipated kinetic energy is converted into the rotational energy. In the weakly plastic collision regime (0.1<V0<0.3), the transition from elastic to plastic collision occurs, and a large part of the released potential energy is converted into rebounding translational energy. For strongly plastic collisions (V0>0.3), permanent cluster deformation occurs with extensive collapse of the lattice structure inducing a solid-to-solid phase transition; moreover, most of the cluster kinetic energy is converted into cluster potential and thermal energy.
Nomenclatures
E : energy subscripts
p : cluster potential energy
ps : potential energy between cluster and surface thm : cluster thermal energy
_
tran x, tran_y, tran_z: x-, y-, z-direction cluster translational energy
rot : cluster rotational energy
1. Introduction
A particle which collides with a surface undergoes complex energy exchanges between different degrees of freedom. The adhesion or rebound of the particle is an end result of this energy exchanges. The particle dissipates its kinetic energy during the collision period.
On the other hand, the incident kinetic energy converted into the elastic deformation energy is partly recovered as the rebounding kinetic energy. The critical velocity below which the particle adheres to the surface is determined by an extent of dissipated kinetic energy.
Many studies on particle-surface impact are focused on the dissipation of the incident kinetic energy because the yield stress of the particle is often lower than the contact stress due to the particle impact with velocities being as low as the critical velocity [1], and thus the energy loss accompanied with the plastic deformation is unavoidable in the impact velocity range of practical
†
연세대학교 기계공학과 대학원E-mail : [email protected]
TEL : (02)2123-4812 FAX : (02)312-2159 * 연세대학교 기계공학과 대학원
** 연세대학교 기계공학과
대한기계학회 2008년도 추계학술대회 논문집
interest. There has been extensive study which targets the modeling of the plastic deformation and the loss of the incident kinetic energy [2~5]. These models assume that the particle is elastically compressed until the stress at the center of the contact circle reaches the yield point. If the particle is compressed further, the contact area is plastically deformed. This contact area surrounded by an elastically-deformed annulus is gradually enlarged while the stress remains unchanged from the yield point. The energy spent to make the inner circle of plastic deformation is assumed to be completely dissipated.
Although experimental data fitted with these models give satisfactory results, the suitability of the model for nano- particle collision remains an open issue.
In the collision of the small-scale particle, the adhesion energy (contact surface energy between the particle and the surface) dominates the process because the adhesion energy is proportional to the particle diameter (~D) whereas volumetric quantities such as the kinetic energy are a function of D3. Moreover, the collision process of a nano-scale object is highly
“transient” because of a very short impact duration.
However, most of macroscopic models are based on the steady-state assumption and adhesion-induced deformation model in which the contact area is calculated by posing the minimum energy condition at equilibrium [1]. This leads to an underestimation of the contact area, overestimation of the specific surface energy, and incorrect curve-fit of the theory to experimental data for both micro- and macro-scale particles [1]. These size-effects can effectively be resolved by the atomic-scale simulation.
Our work has been motivated by a desire to better understand the energy exchanges associated with the cluster collision on the surface and its effect on the adhesion probability. In the present study, classical molecular dynamics simulations (MDS) were performed to simulate nano-sized cluster collisions with a weakly attractive static surface.
2. Simulation Setup
The system is comprised of a single cluster and a surface on which the cluster impinges. All molecules interact via the Lennard-Jones (LJ) potential with a
cutoff radius of rc=4
σ
. Here, r is the distance12 6
( )
r4
Cr r
σ σ
φ
=
ε⎡ ⎢ ⎢ ⎣ ⎛ ⎞ ⎜ ⎟ ⎝ ⎠ − ⎛ ⎞ ⎜ ⎟ ⎝ ⎠ ⎤ ⎥ ⎥ ⎦
(1)between two molecules,
σ
andε
are the length and energy parameter, respectively. C is a constant to scale the relative importance of the attractive potential energy, which is unity for molecular interactions in the cluster, and 0.3 between the cluster and surface molecules to simulate weakly adhesive interaction. A roughly spherical cluster comprised of 1055 molecules is cut out from a cubic FCC structure in solid state. A rectangular target surface is also in solid state and structured by a FCC lattice with 4800 molecules. The cluster is equilibrated into a solid state at a temperature of 0.1( /
ε kB)
. The equilibrated cluster is initially placed perpendicularly above the surface and injected onto the surface. The incident velocities in the vertical direction (V0) in the range from 0.01( /
ε m)
1/ 2 to 1.7( /
ε m)
1/ 2were initially given to the cluster to start the simulations.
In the present simulation setup, the cluster completely melted at an incident velocity of 2
( /
ε m)
1/ 2. At a given incident velocity, 100 collisions with different cluster orientations are repeated. A rigid-wall surface was assumed to simulate extremely hard wall. The static surface is numerically restituted into its original FCC lattice structure at the end of every time step by repositioning all the surface molecules. Newton’s equations of motion are time-integrated by Verlet’s leap- frog method with a time step of 0.001(
mσ ε2/ )
1/ 2. All physical quantities are expressed in the standard reduced LJ units hereinafter.3. Incident, Loading, Unloading, and Rebound Phases
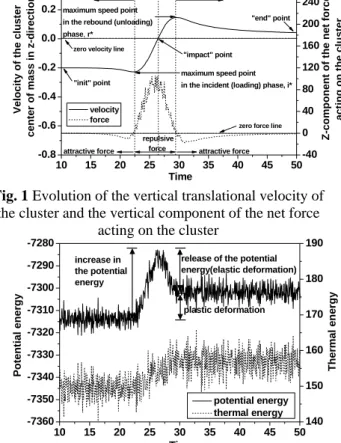
The cluster-surface collision transient is addressed in terms of the incident, loading, unloading, and rebound phases. Fig. 1 plots the evolving vertical translational velocity of the cluster center-of-mass. Also shown is the vertical component of the net force acting on the cluster.
In the incident phase, as the cluster approaches the surface, an attractive force acts on the cluster and the
10 15 20 25 30 35 40 45 50 -0.8
-0.6 -0.4 -0.2 0.0 0.2 0.4
Velocity of the cluster center of mass in z-direction
Time velocity
force incident
loading unloading rebound maximum speed point
in the rebound (unloading) phase, r*
"end" point
zero velocity line
"impact" point
maximum speed point in the incident (loading) phase, i*
"init" point
attractive force
repulsive force
zero force line
attractive force -40
0 40 80 120 160 200 240 280
Z-component of the net force acting on the cluster
Fig. 1 Evolution of the vertical translational velocity of the cluster and the vertical component of the net force
acting on the cluster
10 15 20 25 30 35 40 45 50
-7360 -7350 -7340 -7330 -7320 -7310 -7300 -7290 -7280
Time
potential energy thermal energy
Potential energy
140 150 160 170 180 190
plastic deformation release of the potential energy(elastic deformation)
Thermal energy
increase in the potential energy
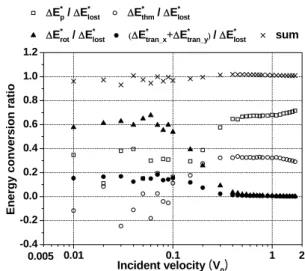
Fig. 2 Evolution of the cluster potential and thermal energy
cluster is accelerated. The vertical velocity reaches its maximum at the point denoted by i*. This i* point indicates the termination of the “incident” phase and beginning of the “loading” phase. In the loading phase, the cluster slows down to stop at the “impact” point and this deceleration is accompanied with deformation. In the unloading phase, the cluster starts reverts into the opposite direction. The repulsive force continues to push the cluster away from the surface until the cluster velocity arrives at its positive peak denoted by r*. As it leaves the unloading phase, the cluster senses an attractive force again and enters the “rebound” phase. In the rebound phase, the cluster continues to move away from the surface and decelerates. On one hand, if the momentum of this receding cluster is high enough to overcome the attraction, it escapes the field of interaction.
The net force acting on the cluster fades to zero so that the cluster continues its inertial motion with no change in its velocity. This point is denoted as the “end” point. On the other hand, if the attraction dominates, the rebounding cluster slows to a stop and falls toward the
surface again making its second contact with the surface.
For the latter, the “end” point indicates the termination of the simulation.
Fig. 2 shows evolutions of the cluster potential and the thermal energy. In the loading phase, both potential and thermal energy increase because of the deceleration and deformation of the cluster. In the unloading phase, part of the potential energy generated in the loading phase is released. The collision becoming elastic or plastic depends on whether the release of the potential energy is complete or not. The thermal energy keeps rising consistently during the colliding period (loading and unloading phases). Irreversible energy dissipations such as the plastic deformation and heat generation are concomitant with the collision interaction during the loading and unloading phases.
4. Results and Discussion
Fig. 3 plots the adhesion probability predicted by the present and previous [6] MDS studies. The cluster was judged to stick to the surface when it changes its direction of motion (sign of the velocity) 3 times after the first impact, for in the case of the incident velocity being greater than 0.1. At the incident velocities lower than 0.1, 7 times of the sign change are required to conclude the adhesion. The adhesion probability strongly depends on the incident velocity. Fig. 3 manifests that the adhesion probability is minimum at the incident velocity of 0.2 and rises as the incident velocity deviates from 0.2.
The adhesion probability is less than 50% in the velocity range between 0.08 and 0.55. The MDS results for a deformable LJ surface using C=0.35 for 147-, 309-,
0.01 0.1 1
0.0 0.2 0.4 0.6 0.8 1.0 1.2
<50%
N=1055, static surface N=147 [6]
N=309 [6]
N=561 [6]
2
Adhesion probability
Incident velocity (V0) 0.005
>50%
Fig. 3 The adhesion probability.
and 561-atom LJ clusters [6] are compared in Fig. 3.
Interestingly, notwithstanding largely different cluster sizes and the surface conditions in the two simulations, the profiles of the adhesion probability predicted by the present (open circles) and Awasthi et al.’s [6] (black circles, open squares, and open triangles) studies are generally similar for velocities higher than 0.4.
To elucidate the evolution of the cluster lattice structure during the loading and unloading phases, two collisions with the incident velocities of 0.2 and 1.0 were examined. In Fig. 4, the changes in the bond order parameters (Q6 and W6) [7] quantifies the extent of the change in the lattice structure, thus the changes in the deformation of the cluster. The two maximum speed points i* and r* (Fig. 1) are shown by the vertical dotted lines. Both Q6 and W6 start to vary immediately after the i* point. As the time elapses to the impact point, Q6 and W6 plots reach their peak. In the case when the incident velocity is 0.2, the lattice has completely recovered its original FCC structure at the
r* point, whereas when the incident velocity is 1.0 the structure still changes after the r* point and attains its new equilibrium at t=15. Furthermore, the equilibrated Q6 is lower than its initial value and occurrence of permanent deformation is apparent.
The mechanism of the cluster kinetic energy loss is investigated. An energy conservation equation can be
* * * * * * *
_ _ _
* * * * * * *
_ _ _
i i i i i i i
p ps thm tran x tran y tran z rot
r r r r r r r
p ps thm tran x tran y tran z rot
E E E E E E E
E E E E E E E
+ + + + + +
= + + + + + + (2)
0.552 0.560 0.568
0 10 20 30 40 50 60
-0.0132 -0.0130 -0.0128
Time
0 10 20 30 40
-0.015 -0.012 -0.009 -0.006
Time 0.3
0.4 0.5 0.6
V0=1.0 V0=1.0 V0=0.2 V0=0.2 V0=0.2 Q6W6
V0=0.2
W6Q6
Fig. 4 The evolution of the two global bond order parameter Q6 and W6 for the cluster molecules
(upper: V0=0.2, lower: V0=1.0)
0.01 0.1 1
-0.4 -0.2 0.0 0.2 0.4 0.6 0.8 1.0 1.2
ΔE*p / ΔE*
lost ΔE*thm / ΔE*
lost
ΔE*rot / ΔE*
lost (ΔE*tran_x+ΔE*tran_y)/ ΔE*
lost sum
2
Energy conversion ratio
Incident velocity (V0) 0.005
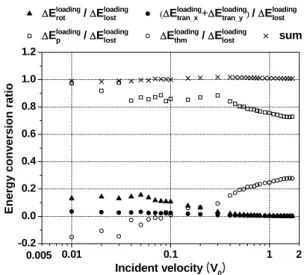
Fig. 5 Energy conversion ratios during the loading and unloading phase
written in terms of all possible energy modes at i* and
r* point .Where LHS of Eq. (2) includes the energy terms at i* and RHS at r*. In the present study, the cluster-surface system is microcanonical, thus sum of all energy modes is invariant at any instant of the collision evolution. Regarding the surface energies, the surface potential and the surface thermal energy were excluded from Eq. (2) because a static surface is assumed. The cluster always loses parts of its vertical translational energy by the collision. In addition, the potential energy between the cluster and the surface at r* point is less than that of i* because of the cluster deformation, and thus (Etran zi* _ −Etran zimpact_ )+ (Eips* −Eimpactps ) is always positive. However, the cluster potential and thermal energies increase after the collision (Fig. 2). Furthermore, the cluster collision may freshly generate the velocity components parallel to the surface or the rotational motion. The energy modes relevant to the cluster-surface collision are categorized into the following energy loss and gain groups.
( ) ( )
( ) ( ) ( )
( ) ( )
* * * *
* * * * * *
* * * *
_ _
_ _
_ _
: :
+
i r i r
tran z tran z ps ps
i r i r i r
p p thm thm tran x tran x
i r i r
tran y tran y rot rot
Loss E E E E
Gain E E E E E E
E E E E
Loss Gain
− + −
− + − + − +
− −
=
(3)
To find the principal routes of the energy conversion between the energy modes, the energy conversion ratio, defined as the energy gain in one energy mode divided
by the loss in the other, was examined and the results are presented in Fig. 5. In the low velocity regime (V0<0.1) more than 60% of the lost energy is converted into the cluster rotational energy. If the incident velocity is low a little loss in the vertical translational energy may result in cluster adhesion. This is why the adhesion probability rises with a decrease in the incident velocity (Fig. 3). In the high velocity regime (V0>0.3), nearly all energy loss is converted into the cluster potential and thermal energy.
The conversion into the rotational and x-, y-direction translational energy is negligibly small. It is seen that with an elevation in the incident velocity above 0.3,
* *
p/ lost
E E
Δ Δ and
Δ
Ethm*/ Δ
Elost* are barely altered and remains near 0.7 and 0.3, respectively. Separate calculations of incident velocities greater than 0.3 yield the conversion ratio of the cluster potential and thermal energy to be 0.6 and 0.4, respectively. This result approximates to the well-known equipartition theorem so if the collision velocity were to be sufficiently high, the lost energy would be nearly equally partitioned into the potential and thermal energy in the equilibrium state. At intermediate incident velocities from 0.1 to 0.3, none of the energy modes exceeds others.Energy exchanges in the loading phase are investigated. An energy conservation equation is written in terms of all possible energy modes in the loading phase, similar to Eq. (3) and the results are shown in Fig. 6. Overall, a large portion of the lost energy is converted into the cluster potential energy. At low incident velocities below 0.1, more than 10% of lost energy is converted into the rotational energy of the cluster, but the conversion ratio gradually decreases when the incident velocity rises above 0.1. At the incident velocities above 0.3, a considerable amount of lost energy is converted into the cluster thermal energy and its extent is augmented with the incident velocity.
Fig. 7 plots the release ratio of the cluster potential energy in the unloading phase, which is defined as the decrement in the cluster potential energy in the unloading phase divided by the increment in the cluster potential energy in the loading phase. This release ratio directly estimates the elasticity of the cluster collision. At the incident velocities lower than 0.1, more than 90% of the potential energy is released and the release ratio is not
0.01 0.1 1
-0.2 0.0 0.2 0.4 0.6 0.8 1.0 1.2
ΔEloadingrot / ΔEloading
lost (ΔEloadingtran_x+ΔEloadingtran_y)/ ΔEloading
lost
ΔEloadingp / ΔEloading
lost ΔEloadingthm / ΔEloading
lost sum
2
Energy conversion ratio
Incident velocity (V0) 0.005
Fig. 6 Energy conversion ratios during the loading phase
a function of the incident velocity. The collision with the incident velocities lower than 0.1 is in the elastic regime.
As the incident velocity increases over 0.1, the collision enters into the plastic regime and the release ratio progressively falls below 50% when the incident velocity rises over 0.3. Here, the plastic collision is distinguished by two regimes; one being weakly plastic (0.1<V0<0.3) and the other strongly plastic (V0>0.3). The cluster releases more than 50% of the stored potential energy after the impact in the weakly plastic regime and less than 50% in the strongly plastic regime. In an incident velocity range from 0.1 to 0.3 particularly at V0=0.2, individual collision is either elastic or plastic according to the contact orientation. The transition from the elastic to the plastic collision occurs in the weakly plastic collision regime.
0.01 0.1 1
0 20 40 60 80 100
Potential energy release rate [%]
0.005
Incident velocity (V0) 2
Fig. 7 Release ratio of the cluster potential energy
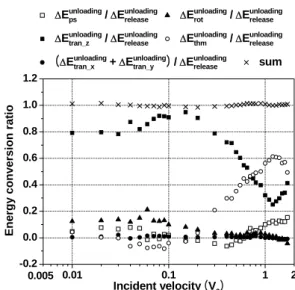
Fig. 8 plots the energy conversion ratios in the unloading phase, which is defined as the increment in the each energy modes divided by the released potential energy. At the incident velocities lower than 0.3 more than 80% of the released potential energy is converted into the vertical translational energy, but the plots of the conversion ratio steeply falls as the incident velocity rises over 0.3. Energy conversion into the cluster thermal energy becomes significant when the incident velocity is greater than 0.3. Moreover, conversion into the thermal energy is inversely proportional to that of the vertical translational energy. This organized variation indicates that the consumption of the released potential energy through the heat generation causes the cluster to have a low rebounding kinetic energy when the incident velocity is greater than 0.3.
5. Conclusions
Classical molecular dynamics simulations (MDS) were performed to simulate nano-sized cluster collisions with a weakly attractive static surface. The energy exchanges during the loading and unloading phase and the adhesion probability were investigated.
In elastic collision regime (V0<0.1), most incident kinetic energy is recovered into the rebounding kinetic energy, but a little loss in the incident kinetic energy causes the cluster adhesion. Dissipated kinetic energy is converted into the rotational energy.
In a weakly plastic collision regime (0.1<V0<0.3), an individual collision is either elastic or plastic according to the contact orientation. The transition from the elastic to the plastic collision occurs and a large part of the released potential energy is converted into the rebounding translational energy.
In a strongly plastic collision regime (V0 >0.3), permanent cluster deformation occurs with extensive collapse of the lattice structure and a solid-to-solid phase transition. A large part of the cluster kinetic energy is lost and converted into the cluster potential and thermal energy. Due to the heat generation, the conversion of the released potential energy into the rebounding kinetic energy is minimal.
0.01 0.1 1
-0.2 0.0 0.2 0.4 0.6 0.8 1.0 1.2
Energy conversion ratio
ΔEunloadingps / ΔEunloadingrelease ΔEunloadingrot / ΔEunloadingrelease ΔEunloadingtran_z / ΔEunloadingrelease ΔEunloadingthm / ΔEunloadingrelease (ΔEunloadingtran_x + ΔEunloadingtran_y ) / ΔEunloadingrelease sum
Incident velocity (V0)
0.005 2
Fig. 8 Energy conversion ratio from the released cluster potential energy to the other energy modes during
unloading phase
References
(1) Wall, S.; John, W.; Wang, H.-C., 1990,
“Measurements of kinetic energy loss for particles impacting surfaces,” Aerosol Science and Technology, Vol. 12, pp. 926-946.
(2) Bitter, J. G. A., 1963, “A study of erosion phenomena,” Wear, Vol. 6, pp. 5-21.
(3) Rogers, L. N; Reed, J., 1984, “The adhesion of particles undergoing an elastic-plastic impact with a surface,” J. Phys. D: Appl. Phys., Vol. 17, pp. 677-689.
(4) Xu, M.; Willeke, K., 1993, “Right-angle impaction and rebound of particles,” J. Aerosol Sci., Vol. 24, pp.
19-30.
(5) Johnson, K. L.; Kendall, K.; Roberts, A. D., 1971,
“Surface energy and the contact of elastic solids,”
Proceedings of the Royal Society of London. Series A, Mathematical and Physical Sciences, Vol. 324(1558), pp. 301-313.
(6) Awasthi, A.; Hendy, S. C.; Zoontjens, P.; Brown, S.
A.; Natali, F., 2007, “Molecular dynamics simulations of reflection and adhesion behavior in Lennard-Jones cluster deposition,” Physical Review B, Vol. 76, 115437 (7) Steinhardt, P. J.; Nelson, D. R.; Ronchetti, M., 1983,
“Bond-orientational order in liquids and glasses”, Physical Review B, Vol. 28, pp. 784-805.