INTRODUCTION
Duck meat contains a variety of health-promoting nutrients such as essential amino acids, unsaturated fatty acids, B-group vitamins and minerals. Recently, duck industry in Korea has grown rapidly and the consumption of duck meat has doubled from 1.2 kg in 2006 to 2.4 kg in 2016 (MAFRA, 2017).
Since duck meat is being consumed mainly at the restaurant rather than at home, the restaurants generally store duck meat in the freezer for a certain period of time. The industry also stores some portion of duck meat stock in a frozen state before secondary processing.
Freezing is a means of preserving quality by suppressing the growth of microorganisms and enzyme activity by freezing the free water in the tissues (Park et al., 2012). Freezing speed and the formation of small crystals during the freezing
process are closely related to muscle tissue damage (Hong et al., 2007). However, the quality of frozen food is more influenced by the thawing process, since thawing is slower than freezing due to the difference in thermal conductivity and thermal diffusivity between ice and water (Hong et al., 2007). That is, the thawing process affects the physico- chemical properties of the frozen meat, resulting in drip loss (Jeremiah, 1980), changes in meat color (Berry, 1994), de- creased water holding capacity (Miller et al., 1980), increased rancidity (Sebranek et al., 1978), changes in texture (Winger and Fennema, 1976), etc. In addition, rapid thawing should be done at as low a temperature as possible to avoid signi- ficant temperature rise and excessive moisture loss (Li and Sun, 2002; Hong et al., 2007). It has been a common practice to freeze meat at —20℃ and the thawing is usually done in a refrigerator for 24 hours. It might be possible to minimize
Effect of Thawing Methods and Storage Time on Physicochemical Characteristic and Fatty Acid and Amino Acid Content of Frozen Duck Meat
Kang-Nyeong Heo
1*, Euichul Hong
1*, Bo-Seok Kang
1, Byoungho Park
1, Jae-Beom Cha
1, Hyo-Jun Choo
1, Il Kwon
1and Ji-Hyuk Kim
2†1
Researcher, Poultry Research Institute, National Institute of Animal Science, RDA, Pyeongchang 25342, Republic of Korea
2
Professor, Department of Animal Resources Science, Kongju National University, Yesan 32439, Republic of Korea
ABSTRACT This study investigated the effects of thawing methods and storage time on the quality of frozen duck meat.
Meat was obtained from eight-week-old Korean native ducks (average weight=2.8 kg). Seventy-two samples were divided into eight treatments (three replicates/treatment, three samples/replicate) with 2 × 4 factorial arrangement based on two thawing methods (under running water at 12 ℃ for 3 h and in a refrigerator at 5℃ for 24 h) and four storage times (1, 3, 6, and 12 months). CIE b* was significantly different among different storage time treatments, reaching its lowest after 6 months (P<0.05). Cooking loss did not differ between storage times; however, it was significantly lower following application of the fast thawing treatment (P<0.05). Water-holding capacity of meat stored for one month was highest compared to that of meat stored for a longer period (P<0.05). Additionally, there were significant differences based on storage time in γ-linoleic acid (C18:3n6) and eicosenoic acid (C20:1n9) contents (P<0.01), as well as in protein contents (P<0.05). Palmitoleic acid (C16:1n7) typically decreased after three months of storage; however, this decline was not significant compared to other storage times.
Essential amino acids contents, except methionine, were significantly difference at six and 12 months of storage (P<0.05).
Similarly, non-essential amino acid contents, except tyrosine, were significantly different among storage periods (P<0.05, P<0.01). Alternatively, there were no significant differences in the chemical composition, fatty acid content, or amino acid content based on the thawing method.
(Key words: duck meat, thawing method, storage time, physicochemical characteristics, fatty acid, amino acid)
*
These authors have contributed equally to this work.
†
To whom correspondence should be addressed : [email protected]
the reduction of meat quality as freezing time gets shorter (Ballin and Lametsch, 2008).
Problems that may occur when freezing and thawing meat have been studied in the past, and various experiments have been carried out to find solutions. Kim et al. (1998) compared how different thawing speeds affect the quality of meat, and Jung and Moon (1995) investigated the change of beef quality based on the period of refrigerating after thawing.
Heo et al. (2016) investigated how-freezing and thawing methods affect the quality of duck meat. Park et al. (2012) reported the physicochemical and microbiological characte- ristics of pork based on thawing method, and Hong et al.
(2007) investigated the effects of ohmic thawing on the physicochemical properties of pork. In addition, Shim et al.
(2009) investigated the effect of ultra-high pressure freezing and thawing on the physical properties of pork.
Although the effects of freezing and thawing conditions on meat quality have been studied, there are few studies on the changes of meat characteristics during the freezing period related to freezing and thawing methods. Besides, the majo- rity of these studies have been conducted on red meat such as beef and pork. In this experiment, we analyzed changes in physicochemical characteristics of duck meat when the frozen duck meat was defrosted by refrigeration or by cold water thawing, and then examined the changes after defrosting based on the storage time.
MATERIALS AND METHODS
1. Sample Preparation and Experimental Design The samples obtained from seventy-two 8-wk-old Korean native ducks (average body weight 2.8±0.35 kg) were used.
Breast meats were collected within 30 minutes after slaughter, vacuum packed, and stored in a deep freezer ( —50℃).
The samples were divided into 8 treatments (3 replications/
treatment, 3 samples/replication), with 2 × 4 complex factors of 2 thawing methods (with running water at 12℃ for 3 h or in a refrigerator at 5℃ for 24 h) and 4 storage periods (1, 3, 6, and 12 mon). Thawing was terminated when the tem- perature of the mass reached 4∼6℃.
2. Physicochemical Analysis
Meat color, CIE L* (lightness), CIE a* (redness), and CIE b* (yellowness), was measured using a colorimeter (CR-300 Chroma Meter, Minolta, Tokyo, Japan). The colorimeter was standardized using a white calibration plate of Y=92.40, x=
0.3136, y=0.3196. The measurements were recorded in triplicate per sample.
Shear force, cooking loss, and water holding capacity were analyzed by the method of Chae et al. (2006).
For the analysis of shear force, the meat was heated at 70℃
for 10 min to collect samples (average weight 60 g) in the direction of the muscle fiber with a core of 1.27 cm in diameter and then measured with a shear force meter (Warner-Bratzler shear force meter, Tallgrass Solutions Inc., USA).
To measure cooking loss, the samples were cut from skinless breast meat and the initial weight was measured.
These samples were put in polyethylene bags and cooked in an 80℃ water bath for 1 h and cooled at room temperature for 30 min before weighing. Cooking loss was measured as the weight difference before and after cooking. The test was performed in triplicate.
To measure the water holding capacity (WHC) by centri- fugation, about 0.5 g of the sample, from which the fat and fascia were removed from the tube, was measured and heated in a water bath at 80℃ for 20 min. After cooling for 10 min, the samples were centrifuged at 2,000 rpm, at 10℃, for 10 min (Hitachi SCR 20BA; Hitachi, Tokyo, Japan). After cen- trifugation, the meat was removed from the tube, and the weight of the centrifuge tube before and after drying was measured. WHC was evaluated in triplicate and expressed as the percentage of moisture that remained in the meat.
The chemical components (moisture, fat, protein, and ash) were analyzed according to the feed standard analysis method (NLRI, 2001) and the AOAC (2012) method.
3. Fatty Acid Composition
Lipids were extracted using the method by Folch et al.
(1957). BHT 50 μL and Folch solution (chloroform:methanol
=2:1) were homogenized at 14,000 rpm for 30 s, after which
50 mL of 0.88% NaCl was added to 25 g of the sample,
followed by stirring. The mixture was centrifuged at 3,000
rpm for 10 min. The bottom layer was collected, concentrated,
and the solvent left under N
2was removed.
About 80 mg of the extracted lipids was hydrolyzed at 90 ℃ for 7 min in 1 mL of 0.5 N NaCl, followed by cooling at room temperature for 5 min. One milliliter of 14% boron trifluoride methanol solution (BF
3methanol; Sigma-Aldrich, St. Louis, Mo, USA) was added, and the free fatty acids were methylated at 90 ℃ for 15 min and then cooled at room temperature for 30 min. Hexane 2 mL and distilled water 10 mL were added and the upper layer 1 mL was sampled for fatty acid analysis. Fatty acid composition was analyzed using a gas chromatography (Agilent/HP 6890N; HP, Palo Alto, CA, USA) with a flame ionization detector and a 60 m × 0.32 mm Supelcowax
®10 column.
4. Amino Acid Content
Amino acid content was measured using an amino acid analyzer (Hitachi L-850-A, Hitachi, Korea) after cutting the lean portion of the breast meat and hydrolyzing them in 6 N HCl at 110℃ for 16 h.
The physicochemical characteristics, fatty acid content and amino acid content before freezing duck meat are shown in Tables 1, 2, and 3.
Table 1. Physicochemical characteristics of duck breast meat
Parameters Value
CIE
Lightness (L*) 36.0±1.22
1Redness (a*) 18.6±0.42
Yellowness (b*) 5.15±0.118
Physical properties
Cooking loss (%) 19.6±0.82
Shear force (g/cm
2) 4.75±0.556 Water holding capacity (%) 60.6±0.09 Chemical compositions
Moisture (%) 74.5±0.21
Crude fat (%) 1.88±0.274
Crude protein (%) 21.3±0.31
Crude ash (%) 1.20±0.022
SD, standard deviation.
1
Values are means±SD of 3 repetitions (3 samples per repetition).
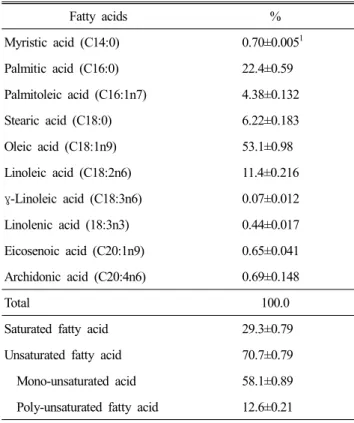
Table 2. Fatty acid composition of duck breast meat
Fatty acids %
Myristic acid (C14:0) 0.70±0.005
1Palmitic acid (C16:0) 22.4±0.59
Palmitoleic acid (C16:1n7) 4.38±0.132
Stearic acid (C18:0) 6.22±0.183
Oleic acid (C18:1n9) 53.1±0.98
Linoleic acid (C18:2n6) 11.4±0.216 γ-Linoleic acid (C18:3n6) 0.07±0.012 Linolenic acid (18:3n3) 0.44±0.017 Eicosenoic acid (C20:1n9) 0.65±0.041 Archidonic acid (C20:4n6) 0.69±0.148
Total 100.0
Saturated fatty acid 29.3±0.79
Unsaturated fatty acid 70.7±0.79
Mono-unsaturated acid 58.1±0.89 Poly-unsaturated fatty acid 12.6±0.21 SD, standard deviation.
1
Values are means±SD of 3 repetitions (3 samples per repetition).
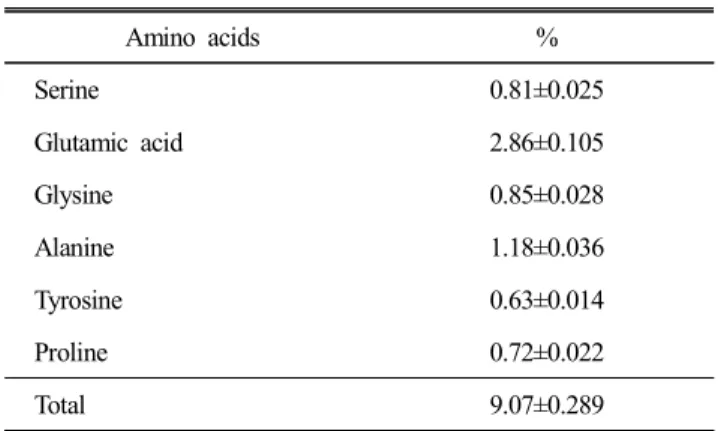
Table. 3. Amino acid composition of duck breast meat
Amino acids %
Essential amino acid
Methionine 0.49±0.008
1Threonine 0.91±0.027
Valine 0.87±0.023
Iso-leucine 0.78±0.021
Leucine 1.64±0.045
Phenylalanine 0.76±0.017
Lysine 1.69±0.051
Histidine 0.56±0.031
Arginine 1.24±0.044
Total 8.94±0.267
Non-essential amino acid
Cystine 0.24±0.002
Aspartic acid 1.78±0.057
Table. 3. Continued
Amino acids %
Serine 0.81±0.025
Glutamic acid 2.86±0.105
Glysine 0.85±0.028
Alanine 1.18±0.036
Tyrosine 0.63±0.014
Proline 0.72±0.022
Total 9.07±0.289
SD, standard deviation.
1
Values are means±SD of 3 repetitions (3 samples per repetition).
5. Statistical Analysis
All data from this study were analyzed using the GLM program by SAS (2012), and the mean value of each treatment interval was tested at a 95% and 99% confidence level using Duncan’s multiple test (Duncan, 1955).
RESULTS AND DISCUSSION
1. Meat Color and Physicochemical Properties Table 4 shows the meat color and physical properties of duck meat according to storage period and thawing method.
The meat color and water holding capacity (WHC) were similar to the result of fresh meat (Table 1), but shear force and cooking loss were higher than those of fresh meat.
CIE L* and CIE a* did not differ based on storage time;
however, CIE b* was significantly lower at 6 mon of storage among the storage periods and was not significantly different between at 1 and 12 mon of storage (P<0.05). There was no difference in meat color depending on thawing method.
Frozen stored meat is used after thawing, which results in many changes in meat quality that occur during the thawing process (Kang et al., 2006). Jeong et al. (2006) and Park et al. (2012) reported that various mechanisms in the cell do not work properly due to damage of cells in the process of freezing and thawing of pork, which causes oxidation of myoglobin and affects the meat color. Park et al. (2012) reported that the redness of pork was lower after thawing, and Kang et al. (2006) and Heo et al. (2016) stated that
frozen meat showed increased CIE L* due to the physical damage of the muscle fiber and the leakage of water.
Moon et al. (2010) reported that meat color of Hanwoo beef was not affected by storage time at —20℃. In the present study, however, a significant change was observed in CIE b*
of duck meat by storage time. Moon et al. (2010) also reported that meat color was changed during refrigeration after thawing but no color change was detected in this experiment.
No significant difference was observed in cooking loss base on storage time; however, it was significantly lower when the fast thawing treatment was applied (P<0.05). The WHC significantly decreased after 3 mon of storage (P<0.05), but was not affected by thawing method. There was no signi- ficant difference in shear force based on storage time or thawing method.
The cooking loss and WHC of duck breast meat used in this study are different according to storage period and thawing method. The reason is that the higher WHC of thawed frozen meat, the less moisture reduced when heated.
Moon (2013) showed that the level of cooking loss was higher when refrigeration time was longer. In this study, however, cooking loss of meat refrigerated for 24 h was significantly higher. Jung (2016) suggested that thawing loss depends on the degree of cell damage during freezing and storage. However, Taylor and Dant (1971) reported that, when the meat was frozen rapidly, the thawing loss was reduced. In the case of shear force and WHC, Jung (2016) reported no significant difference according to storage period and thawing method, although WHC tended to decrease when the running water thawing method was used. Similar results were obtained in this study; cooking loss and WHC decreased with storage time and showed no difference based on thawing method.
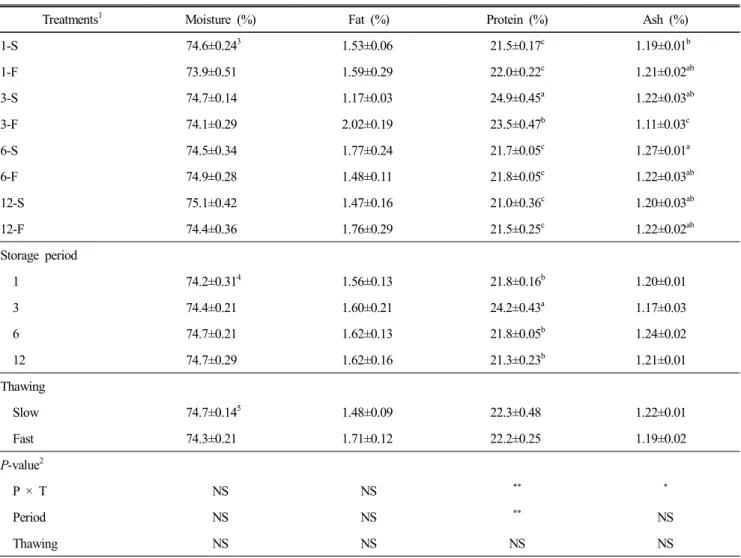
Table 5 shows the chemical properties of duck meat according to storage period and thawing method. Among these results, moisture, crude protein and crude ash contents were similar to those of fresh meat (Table 1), but crude fat content was lower than that of fresh meat.
Crude protein content showed a significant difference based
on storage period time (P<0.05). The protein content of meat
stored for 3 mon was higher than that of meat stored for 1,
6, and 12 mon. Moisture, crude fat, and crude ash did not
show any difference based on storage time. The chemical
composition of duck meat was not affected by thawing method.
There have been few studies on the changes in chemical properties of meat during freezing, storage, and thawing. Lee (1989) reported that water-soluble proteins and amino acids were lost along with juice during thawing. In this study, the difference in protein content, except at 3 mon of storage, is probably due to rapid freezing of meat; however, the cause
of protein content increase at 3 mon of storage could not be explained. Love and Pearson (1971) reported that the oxidation of fat during freezing or storage has a direct effect on the discoloration of meat and on the oxidation and reduction of myoglobin.
2. Fatty Acid Composition
The fatty acid content of duck meat used in this study is Table 4. Change of meat color and physical characteristics of frozen duck breast meat by thawing methods and storage periods
Treatments
1CIE Physical characteristics
2L* a* b* CL (%) SF (g/cm
2) WHC (%)
1-S 35.9±0.87
419.8±1.01 8.12±0.51
a28.4±0.37
a9.4±1.65 63.1±0.64
1-F 33.4±0.71 17.7±0.36 5.10±0.56
c25.4±0.71
b11.9±1.78 63.5±0.21
3-S 34.9±1.29 18.1±0.46 5.53±0.11
bc26.8±0.55
ab11.2±1.71 61.6±1.08
3-F 35.8±1.21 18.0±1.18 5.42±0.48
bc25.7±0.12
b10.1±0.94 62.1±0.79
6-S 33.6±0.67 17.7±0.52 4.84±0.54
c26.6±0.28
b8.3±1.19 61.9±0.27
6-F 33.1±0.29 17.7±0.77 4.68±0.45
c26.1±0.38
b8.7±1.19 61.4±0.81
12-S 34.2±0.97 18.6±0.82 6.73±0.68
ab28.3±0.68
a9.0±0.87 60.8±0.95
12-F 33.9±0.73 17.3±0.48 6.01±0.31
bc26.1±0.61
b10.1±0.32 60.6±0.78
Storage period
1 34.6±0.74
518.8±0.68 6.61±0.75
a26.9±0.76 10.7±1.23 63.3±0.31
a3 35.3±0.82 18.0±0.57 5.47±0.22
ab26.3±0.34 10.6±0.90 61.8±0.61
b6 33.3±0.34 17.7±0.42 4.76±0.32
b26.3±0.24 8.5±0.78 61.6±0.39
b12 34.0±0.55 18.0±0.52 6.37±0.37
a27.2±0.64 9.6±0.55 60.7±0.55
bThawing
Slow 34.6±0.49
618.6±0.41 6.30±0.43 27.5±0.32
a9.5±0.68 61.8±0.42
Fast 34.0±0.46 17.7±0.34 5.30±0.25 25.8±0.23
b10.2±0.32 61.9±0.43
P-value
3P × T NS NS
** **NS NS
Period NS NS
*NS NS
*Thawing NS NS NS
**NS NS
SD, standard deviation.
1
1, 3, 6, 12 (mon), storage periods in deep freezer; S (slow), F (fast), thawing methods.
2
CL, cooking loss; SF, shear force; WHC, water holding capacity.
3
Probability of contrast, NS, No significance,
*P<0.05,
**P<0.01.
4
Values are means±SD of 3 repetitions (3 samples per repetition).
5
Values are means±SD of 6 repetitions (3 samples per repetition).
6
Values are means±SD of 12 repetitions (3 samples per repetition).
shown in Tables 6 and 7. The content of most of fatty acids in thawed meat was similar to that of fresh meat; however, the content of arachidonic acid (C20:4n6) was higher than that of fresh meat. In contrast to this result, Al-Sabagh et al.
(2016) reported that the level of linolenic acid (C18:3) of frozen duck meat decreased when compared to fresh meat.
According to Tomás and Anón (1990), the time and rate of lipid oxidation is affected by degree of fatty acid saturation, storage period and storage temperature.
There was a significant difference in the content of γ-
linoleic acid (C18:3n6) and eicosenoic acid (C20:1n9) based on storage period. The content of γ-linoleic acid (C18:3n6) and eicosenoic acid (C20:1n9) decreased significantly by 3 mon of storage (P<0.01). Palmitoleic acid (C16:1n7) tended to be lower by 3 mon of storage; however, there was no significant difference based on storage periods. The content of all fatty acids were not different according to thawing methods. The contents of saturated and unsaturated fatty acids were not different according to the storage periods and thawing methods.
Table 5. Change of chemical composition of frozen duck breast meat by thawing methods and storage periods
Treatments
1Moisture (%) Fat (%) Protein (%) Ash (%)
1-S 74.6±0.24
31.53±0.06 21.5±0.17
c1.19±0.01
b1-F 73.9±0.51 1.59±0.29 22.0±0.22
c1.21±0.02
ab3-S 74.7±0.14 1.17±0.03 24.9±0.45
a1.22±0.03
ab3-F 74.1±0.29 2.02±0.19 23.5±0.47
b1.11±0.03
c6-S 74.5±0.34 1.77±0.24 21.7±0.05
c1.27±0.01
a6-F 74.9±0.28 1.48±0.11 21.8±0.05
c1.22±0.03
ab12-S 75.1±0.42 1.47±0.16 21.0±0.36
c1.20±0.03
ab12-F 74.4±0.36 1.76±0.29 21.5±0.25
c1.22±0.02
abStorage period
1 74.2±0.31
41.56±0.13 21.8±0.16
b1.20±0.01
3 74.4±0.21 1.60±0.21 24.2±0.43
a1.17±0.03
6 74.7±0.21 1.62±0.13 21.8±0.05
b1.24±0.02
12 74.7±0.29 1.62±0.16 21.3±0.23
b1.21±0.01
Thawing
Slow 74.7±0.14
51.48±0.09 22.3±0.48 1.22±0.01
Fast 74.3±0.21 1.71±0.12 22.2±0.25 1.19±0.02
P-value
2P × T NS NS
** *Period NS NS
**NS
Thawing NS NS NS NS
SD, standard deviation.
1
1, 3, 6, 12 (mon), storage periods in deep freezer; S (slow), F (fast), thawing methods.
2
Probability of contrast, NS, No significance,
*P<0.05,
**P<0.01.
3
Values are means±SD of 3 repetitions (3 samples per repetition).
4
Values are means±SD of 6 repetitions (3 samples per repetition).
5
Values are means±SD of 12 repetitions (3 samples per repetition).
Park et al. (1999) reported that the content of oleic acid was related to the taste of meat. Westering and Hedrick (1979) reported a negative correlation between linoleic acid and the flavor of meat. However, the effects of storage period on fatty acids content related to the taste of meat were not observed in this study. Heo et al. (2016) reported that palmi- toleic acid content of duck meat was the highest when the meat was defrosted by refrigeration, but no difference was observed in palmitoleic acid content based on thawing method
in this study.
Zymon et al. (2007) reported that palmitoleic acid level of veal was significantly reduced during 3 mon of frozen storage.
De Pedro and Murillo (2000) also reported that palmitoleic acid content decreased in subcutaneous fat in frozen pork stored for 32 mon. These previous findings are similar to the result of present study. It is assumed that certain changes may occur during first 3 mon frozen storage, while the lipid oxidation and hydrolysis proceed very slowly and to a small Table 6. Change of fatty acid contents (%) of frozen duck breast meat by thawing methods and storage periods
1Treatments
2C14:0 C16:0 C16:1n7 C18:0 C18:1n9 C18:2n6 C18:3n6 C18:3n3 C20:1n9 C20:4n6
1-S 0.66±0.03
421.3±0.33 3.97±0.23
a6.13±0.24 54.0±0.51 11.8±0.51 0.07±0.01 0.41±0.01 0.64±0.03
a1.11±0.19 1-F 0.65±0.01 22.2±0.77 4.56±0.21
a6.06±0.23 53.4±1.24 11.2±0.16 0.06±0.02 0.40±0.01 0.60±0.02
ab0.90±0.08 3-S 0.62±0.03 22.0±0.58 4.05±0.25
a6.69±0.17 53.6±0.73 11.1±0.28 0.04±0.00 0.38±0.01 0.51±0.08
b1.01±0.11 3-F 0.69±0.01 22.4±0.08 3.18±0.26
b6.56±0.22 53.1±0.23 12.1±0.25 0.05±0.00 0.41±0.02 0.52±0.03
b0.99±0.16 6-S 0.65±0.01 22.3±0.14 4.08±0.23
a6.55±0.28 52.6±0.61 11.7±0.41 0.08±0.01 0.41±0.02 0.65±0.02
a0.95±0.09 6-F 0.68±0.03 22.4±0.64 4.00±0.04
a6.52±0.08 52.2±1.17 12.1±0.44 0.08±0.02 0.42±0.03 0.69±0.03
a0.87±0.08 12-S 0.70±0.01 22.2±0.11 4.04±0.27
a6.59±0.27 52.0±0.61 12.1±0.48 0.08±0.01 0.43±0.01 0.70±0.01
a1.15±0.11 12-F 0.70±0.01 22.2±0.12 4.16±0.11
a6.35±0.12 52.6±0.43 11.9±0.53 0.06±0.01 0.46±0.02 0.68±0.03
a0.90±0.09 Storage period
1 0.66±0.01
521.7±0.43 4.27±0.19 6.09±0.15 53.7±0.61 11.5±0.21 0.06±0.00
ab0.41±0.01 0.62±0.02
ab1.01±0.11 3 0.66±0.02 22.2±0.28 3.61±0.25 6.63±0.13 53.4±0.36 11.6±0.29 0.05±0.00
b0.39±0.01 0.52±0.04
b1.00±0.08 6 0.67±0.01 22.3±0.29 4.04±0.11 6.53±0.13 52.4±0.59 11.9±0.28 0.08±0.01
a0.42±0.02 0.67±0.02
a0.91±0.06 12 0.70±0.00 22.2±0.07 4.10±0.13 6.47±0.14 52.3±0.35 12.0±0.32 0.07±0.01
a0.44±0.01 0.69±0.01
a1.03±0.08 Thawing
Slow 0.66±0.01
621.9±0.19 4.04±0.11 6.49±0.12 53.1±0.36 11.7±0.21 0.07±0.01 0.41±0.01 0.62±0.03 1.06±0.06 Fast 0.68±0.01 22.3±0.22 3.98±0.17 6.37±0.09 52.8±0.41 11.8±0.21 0.06±0.01 0.42±0.01 0.62±0.02 0.91±0.05 P-value
3P × T NS NS
*NS NS NS NS NS
**NS
Period NS NS NS NS NS NS
**NS NS NS
Thawing NS NS NS NS NS NS NS NS NS NS
SD, standard deviation.
1
Myristic acid, C14:0; Palmitic acid, C16:0; Palmitoleic acid, C16:1n7; Stearic acid, C18:0; Oleic acid, C18:1n9; Linoleic acid, C18:2n6;
γ-Linoleic acid, C18:3n6; Linolenic acid, C18:3n3; Eicosenoic acid, C20:1n9; Arachidonic acid, C20:4n6.
2
1, 3, 6, 12 (mon), storage periods in deep freezer; S (slow), F (fast), thawing methods.
3
Probability of contrast, NS, No significance,
*P<0.05,
**P<0.01.
4
Values are means±SD of 3 repetitions (3 samples per repetition).
5
Values are means±SD of 6 repetitions (3 samples per repetition).
6
Values are means±SD of 12 repetitions (3 samples per repetition).
extent, presumably as a result of the inactivation of tissue enzymes and microorganisms. In the present study, however, palmitoleic acid level increased after 6 mon and 12 mon of frozen storage. Further investigation is needed to identify the change of fatty acid composition during frozen storage of duck meat.
3. Amino Acid Content
The amino acid content of duck meat used in this study is
shown in Tables 8 and 9. Most of the essential amino acids and aspartic acid (among non-essential amino acids) in thawed meat were similar to those of fresh meat, but histidine and arginine (in essential amino acids) and most of nonessential amino acids were higher than those of fresh meat. These results were in agreement with the study of Heo et al. (2016) who also observed higher non-essential amino acid content in thawed duck meat when compared to fresh meat. However, the correlation between thawing methods, storage time and Table 7. Change of saturated and unsaturated fatty acid contents (%) of frozen duck breast meat by thawing methods and storage periods
Treatments
1Saturated fatty acid
Unsaturated fatty acid
Total Mono- Poly-
1-S 28.0±0.12
372.0±0.12 58.6±0.53 13.4±0.52
1-F 28.9±0.93 71.1±0.93 58.6±1.15 12.5±0.23
3-S 29.3±0.62 70.7±0.62 58.2±0.96 12.5±0.35
3-F 29.6±0.17 70.4±0.17 56.8±0.96 13.6±0.28
6-S 29.5±0.42 70.5±0.42 57.4±0.71 13.1±0.48
6-F 29.6±0.71 70.4±0.71 56.9±1.17 13.5±0.48
12-S 29.5±0.28 70.5±0.28 56.7±0.83 13.7±0.57
12-F 29.2±0.23 70.8±0.23 57.4±0.39 13.4±0.62
Storage period (m)
1 28.5±0.46
471.5±0.46 58.6±0.56 12.9±0.31
3 29.5±0.31 70.5±0.31 57.5±0.57 13.0±0.31
6 29.5±0.37 70.5±0.37 57.1±0.62 13.4±0.31
12 29.4±0.18 70.6±0.18 57.1±0.44 13.5±0.39
Thawing
Slow 29.1±0.25
570.9±0.25 57.7±0.41 13.2±0.25
Fast 29.3±0.27 70.7±0.27 57.4±0.43 13.2±0.22
P-value
2P × T NS NS NS NS
Period NS NS NS NS
Thawing NS NS NS NS
SD, standard deviation.
1
1, 3, 6, 12 (mon), storage periods in deep freezer; S (slow), F (fast), thawing methods.
2
Probability of contrast, NS, No significance,
*P<0.05,
**P<0.01.
3
Values are means±SD of 3 repetitions (3 samples per repetition).
4
Values are means±SD of 6 repetitions (3 samples per repetition).
5
Values are means±SD of 12 repetitions (3 samples per repetition).
amino acid content was not explained in the present study.
There was a significant difference in the content of essential amino acids, except methionine, based on storage time (P<0.05). Methionine content showed no significant change based on storage time. Most non-essential amino acids also showed a significant difference between the storage periods (P<0.05, P<0.01); tyrosine content did not change significantly during the storage period. Despite the significant difference of amino acid content among the treatments, no constant tendency of change was detected. There was no
significant effect of thawing method on the levels of either essential or non-essential amino acids.
This result is different from Al-Sabagh et al. (2016) who reported that all the essential amino acids and non-essential amino acids decreased in frozen meat regardless of freezing temperature.
CONCLUSION
There was no significant effect of thawing method on Table 8. Change of essential amino acid contents (%) of frozen duck breast meat by thawing methods and storage periods
Treatments
1Methionine Threonine Valine Iso-leucine Leucine Phenylalanine Lysine Histidine Arginine EAA 1-S 0.51±0.01
30.96±0.01
ab0.91±0.01
cd0.83±0.01
ab1.74±0.01
a0.80±0.01
bcd1.77±0.01
a0.59±0.01
ab1.31±0.02
a9.43±0.06
a1-F 0.52±0.01 0.98±0.01
a0.93±0.01
bc0.85±0.01
a1.76±0.02
a0.82±0.01
abc1.81±0.02
a0.61±0.01
a1.32±0.01
a9.60±0.11
a3-S 0.52±0.01 0.98±0.02
a0.90±0.01
cd0.85±0.02
a1.75±0.04
a0.84±0.02
a1.81±0.04
a0.61±0.01
a1.35±0.03
a9.61±0.21
a3-F 0.50±0.01 0.96±0.01
ab0.88±0.01
de0.85±0.01
a1.72±0.02
ab0.83±0.01
ab1.77±0.02
a0.58±0.01
ab1.32±0.02
a9.40±0.08
a6-S 0.50±0.01 0.93±0.01
bc0.85±0.01
e0.80±0.01
bcd1.65±0.01
bc0.80±0.01
bcd1.65±0.01
b0.54±0.01
cd1.20±0.01
b8.92±0.04
b6-F 0.51±0.01 0.90±0.02
c0.82±0.01
f0.77±0.01
d1.59±0.03
c0.78±0.01
d1.60±0.04
b0.51±0.02
d1.18±0.03
b8.67±0.18
b12-S 0.50±0.01 0.90±0.01
c0.95±0.02
b0.79±0.01
cd1.69±0.03
ab0.79±0.01
cd1.66±0.03
b0.52±0.01
cd1.20±0.03
b9.01±0.14
b12-F 0.51±0.01 0.95±0.01
ab0.99±0.01
a0.83±0.01
abc1.76±0.01
a0.82±0.01
ab1.73±0.01
a0.56±0.01
bc1.24±0.01
b9.38±0.03
aStorage period
1 0.52±0.01
40.97±0.01
a0.92±0.01
b0.84±0.01
a1.75±0.01
a0.81±0.01
b1.79±0.01
a0.60±0.01
a1.32±0.01
a9.52±0.07
a3 0.51±0.01 0.97±0.01
a0.89±0.01
c0.85±0.01
a1.73±0.02
a0.83±0.01
a1.79±0.02
a0.59±0.01
a1.34±0.02
a9.50±0.11
a6 0.51±0.01 0.91±0.01
b0.84±0.01
d0.78±0.01
c1.62±0.02
b0.79±0.01
b1.63±0.02
c0.53±0.01
b1.19±0.01
b8.80±0.11
c12 0.50±0.01 0.93±0.01
b0.97±0.01
a0.81±0.01
b1.72±0.02
a0.81±0.01
b1.70±0.02
b0.54±0.01
b1.22±0.02
b9.20±0.11
bThawing
Slow 0.51±0.01
50.94±0.01 0.90±0.01 0.82±0.01 1.70±0.02 0.81±0.01 1.72±0.01 0.57±0.01 1.27±0.02 9.24±0.11 Fast 0.51±0.01 0.95±0.01 0.91±0.02 0.82±0.01 1.71±0.02 0.81±0.01 1.73±0.03 0.56±0.01 1.27±0.02 9.26±0.12 P-value
2P × T NS
** ** ** ** ** ** ** ** **Period NS
** ** ** ** ** ** ** ** **Thawing NS NS NS NS NS NS NS NS NS NS
SD, standard deviation.
1
1, 3, 6, 12 (mon), storage periods in deep freezer; S (slow), F (fast), thawing methods.
2
Probability of contrast, NS, No significance,
*P<0.05,
**P<0.01.
3
Values are means±SD of 3 repetitions (3 samples per repetition).
4
Values are means±SD of 6 repetitions (3 samples per repetition).
5
Values are means±SD of 12 repetitions (3 samples per repetition).
physicochemical characteristic and chemical composition of duck meat in this study. However, some results such as WHC, protein content, amino acids content (except methionine and tyrosine), and γ-linoleic acid (C18:3n6) and eicosenoic acid (C20:1n9) level showed significant differences based on storage time. The quality of frozen duck meat and the physicochemical changes in that based on storage time have not been extensively studied thus far. Therefore, additional studies are needed to determine the influences of storage by
freezing on the quality and physicochemical characteristics of duck meat.
ACKNOWLEDGMENTS
This work was carried out with the support of “Cooperative Research Program for Agriculture Science & Technology Development (Project No. PJ01259001)”, Rural Development Administration, the Republic of Korea.
Table 9. Change of non-essential amino acid contents (%) of frozen duck breast meat by thawing methods and storage periods Treatments
1Cystine Aspartic
acid Serine Glutamic
acid Glycine Alanine Tyrosine Proline NEAA
1-S 0.24±0.01
ab31.90±0.02
a0.86±0.01
ab3.03±0.02
a0.91±0.02
ab1.23±0.01
ab0.66±0.01 0.75±0.02
a9.58±0.08
ab1-F 0.24±0.01
a1.93±0.02
a0.87±0.01
ab3.06±0.02
a0.90±0.02
ab1.26±0.01
ab0.68±0.01 0.72±0.02
a9.65±0.09
a3-S 0.24±0.01
a1.93±0.04
a0.87±0.02
a3.10±0.07
a0.93±0.03
a1.28±0.02
a0.68±0.02 0.74±0.01
a9.77±0.21
a3-F 0.23±0.01
bc1.89±0.02
ab0.86±0.01
ab3.04±0.03
a0.94±0.04
a1.26±0.02
ab0.67±0.01 0.73±0.01
a9.63±0.12
ab6-S 0.23±0.01
c1.82±0.01
bc0.84±0.01
bc2.89±0.02
b0.86±0.01
bc1.22±0.01
bc0.69±0.01 0.68±0.01
b9.22±0.05
cd6-F 0.24±0.01
ab1.76±0.04
c0.82±0.01
cd2.82±0.06
bc0.83±0.01
c1.18±0.01
c0.68±0.01 0.66±0.01
b8.97±0.15
cd12-S 0.23±0.01
bc1.80±0.03
c0.80±0.01
d2.70±0.03
c0.89±0.01
abc1.18±0.01
c0.65±0.01 0.67±0.01
b8.91±0.08
d12-F 0.23±0.01
bc1.87±0.01
ab0.85±0.01
ab2.86±0.01
b0.90±0.01
ab1.23±0.01
bc0.67±0.01 0.68±0.01
b9.29±0.02
bcStorage period
1 0.24±0.01
a41.91±0.01
a0.86±0.01
a3.05±0.02
a0.90±0.01
ab1.25±0.01
a0.67±0.01 0.74±0.01
a9.62±0.06
a3 0.24±0.01
a1.91±0.02
a0.86±0.01
a3.07±0.04
a0.94±0.02
a1.27±0.01
a0.68±0.01 0.73±0.01
a9.70±0.11
a6 0.23±0.01
b1.79±0.02
b0.83±0.01
b2.85±0.03
b0.84±0.01
c1.20±0.01
b0.68±0.01 0.67±0.01
b9.09±0.09
b12 0.23±0.01
b1.83±0.02
b0.82±0.01
b2.78±0.04
b0.89±0.01
b1.20±0.01
b0.66±0.01 0.67±0.01
b9.10±0.09
bThawing
Slow 0.23±0.01
51.86±0.02 0.84±0.01 2.93±0.05 0.90±0.01 1.23±0.01 0.67±0.01 0.71±0.01 9.37±0.11 Fast 0.24±0.01 1.86±0.02 0.85±0.01 2.95±0.04 0.89±0.02 1.23±0.01 0.67±0.01 0.70±0.01 9.38±0.11 P-value
2P × T
** ** ** ** * **NS
** **Period
* ** ** ** ** **NS
** **Thawing NS NS NS NS NS NS NS NS NS
SD, standard deviation.
1
1, 3, 6, 12 (mon), storage periods in deep freezer; S (slow), F (fast), thawing methods.
2
Probability of contrast, NS, No significance,
*P<0.05,
**P<0.01.
3
Values are means±SD of 3 repetitions (3 samples per repetition).
4
Values are means±SD of 6 repetitions (3 samples per repetition).
5