Long-term Variation of the Freezing Climate near the Han River and Seoul in Korea
Su-Bin Oh and Hi-Ryong Byun*
Department of Environmental Atmospheric Sciences, Pukyong National University, Busan 608-737, Korea
서울 관측소와 한강 결빙 기후의 장기 변동
오수빈ㆍ변희룡*
부경대학교 환경대기과학과, 608-737, 부산광역시 남구 용소로 45
Abstract: Daily minimum temperature and freezing data of the Seoul weather station (37o34'N, 126o57'E, Songwol-dong Jongno-gu Seoul, hereinafter Songwol) and freezing data of the Han River station (37o30'N, 126o57'E, hereinafter Han River) were used to study the long-term variation of the freezing climate for Seoul, Korea, for the period of 100 years from 1907 to 2006. ‘Freezing’ of Songwol is defined that the water in outdoor fields is frozen, and ‘freezing’ of the Han River located 6 km away from Songwol is defined as the region 100 meters upstream of the second and fourth piers in the south end of the Han River Bridge is fully frozen. The mean first freezing date for Songwol was October 28, and one for Han River was December 28; these showed a late tendency, with the rate of 0.78 days decade−1 and 3.47 days decade−1, respectively. The mean annual freezing days was 159.06 days for Songwol and 50.33 days for Han River; each showed a shorter tendency, with rates of 2.01 days decade−1 and 5.24 days decade−1, respectively. All the seven no-freezing years (1960, 1971, 1972, 1978, 1988, 1991, and 2006) for Han River came after 1950. The mean daily minimum temperatures of the first freezing dates for Songwol and Han River were 0.55oC and −12.22oC. The first freezing occurred after 6.43 days for Songwol and after 8.94 days for Han River with daily minimum temperature below 0oC. The annual minimum temperatures of Songwol and Han River exhibited positive correlations with the first freezing date and negative correlations with freezing days. The result shows that the freezing climate change is relevant to temperature change and is a part of overall climate change. By conducting additional studies with various methods and wider region, we will be able to monitor the freezing climate.
Keywords: freezing climate, first freezing date, freezing days, daily minimum temperature
요 약: 서울 기상 관측소(서울시 종로구 송월동, 37o34'N, 126o57'E, 이하 송월)의 일 최저기온과 결빙 자료, 그리고 인 근인 한강 관측소(37o30'N, 126o57'E, 이하 한강)의 결빙 자료를 사용하여, 1907-2006년(100년) 동안 한국 서울에서의 결빙기후의 장기 변동을 조사하였다. 송월의 결빙은 옥외 노장의 물이 동결하는 현상으로 정의하였고, 이곳에서 6 km 떨어진 한강의 결빙은 한강 대교 남단에서 2번째와 4번째 교각의 상류 100 m 부근이 완전히 얼었을 때로 정의한다. 평 균 첫 결빙일은 송월이 10월 28일, 한강이 12월 28일이며, 각각 0.78 days decade−1와 3.47 days decade−1로 점차 늦어 지는 추세를 나타냈다. 평균 연 결빙 일수는 송월이 159.06일, 한강이 50.33일이며, 각각 2.01 days decade−1와 5.24 days decade−1로 감소하는 추세를 보였다. 특히, 1950년대 후반을 기점으로 변화율이 급변하였는데, 한강에서 100년 동 안 발생한 7번의 무결빙해(1960, 1971, 1972, 1978, 1988, 1991, and 2006)도 모두 1950년대 이후에 발생하였다. 송월 과 한강에서 첫 결빙일의 일 최저기온은 평균적으로 각각 0.55oC와 −12.22oC이다. 영하의 일 최저기온이 송월은 6.43일, 한강은 8.94일 지속되고 난 뒤 첫 결빙이 발생하였다. 송월과 한강의 연 최저기온에 대해서 첫 결빙일은 양의 상관을 보였고, 결빙 일수는 음의 상관을 보였다. 이러한 결과는 결빙기후의 변화가 기후변화의 일환으로 나타나는 기온변화와 유관함을 보였다. 향후 더 넓은 지역에서 다양한 추가 연구를 실시함으로써, 지속적으로 결빙기후를 주시하고자 한다.
주요어: 결빙기후, 첫 결빙일, 결빙 일수, 일 최저기온
*Corresponding author: [email protected]
*Tel: +82-51-629-6640
*Fax: +82-51-629-6640
Introduction
Studies on long-term climate variations have mostly focused on changes of precipitation, temperature, and season progress (Parker et al., 1994; Jones and Hulme, 1996; Hulme et al., 1998; Brown, 2000; Kim et al., 2006). In recent years, ice changes also have attracted much interest. Specifically, when the ice-covered area decreases with a rise in temperature, the albedo of the surface reduces to increase the absorption of solar radiation, resulting in a feedback effect (Perovich et al., 2008) that leads to higher temperatures.
Along with this, the Arctic and Antarctic sea ice has experienced a trend of rapid decrease (Barry et al., 1993; Chang et al., 1998; Gloersen et al., 1999;
Chang et al., 2003; Chung et al., 2004; IPCC, 2007).
The mean sea ice thickness of the Arctic has been decreasing since the 1980s (Lindsay and Zhang, 2005;
Rigor et al., 2004), and the sea ice extent reached minimum values in 2007 and 2008 (Lindsay et al., 2009).
It has been reported that, apart from the polar regions, most places on Earth are experiencing fewer freezing days (Frich et al., 2001). More concretely, the lakes and rivers in the northern hemisphere from 1846 to 1995 (150 years) exhibited a tendency toward later first freezing dates and earlier last freezing dates (Magnuson et al., 2000). The central region of the United States has experienced a rapid decrease of about seven freezing days during the period from 1910 to 1998 (Eastering et al., 2000). However, this
study was limited in that it focused only on natural freezing that occurred on oceans, lakes, and rivers based on meteorological observations. Freezing at the observation field and in nature are different in the targeted ice for observation and the observation method of freezing. Thus, there are not concrete identified studies, the first freezing date, duration and temperature of freezing start are different. However, studies considering freezing at the observation field and in nature together have yet been found.
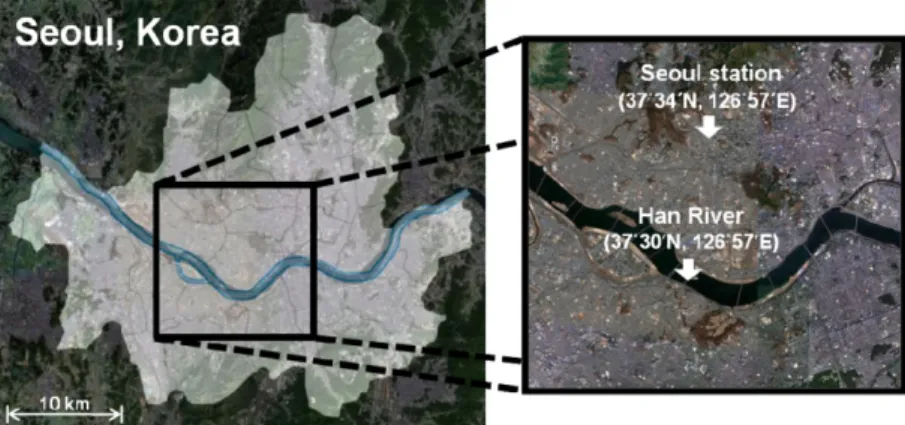
Thus, this study performs an analysis of freezing data by comparing a weather station and a nearby river. In Korea, the freezing data were recorded for more than 100 years at Seoul weather station and nearby Han River. Han River is about 1 km wide, and it penetrates the heart of Seoul; the Han River freezing observatory is located about 6 km away from Seoul weather station (Fig. 1). The freezing data from these two stations have so far been of little interest and have required additional study. Therefore, this study organized the freezing climate data not only by tracing the changes of the freezing environments of these two stations but also by trying to find correlations with climate changes.
Some prior studies regarding the relationship between freezing and temperature changes can be found. The extreme value of the low temperatures in winter, spring, and summer decreased in Canada, and this has contributed to an increase of frost-free days (Bonsal et al., 2001). Number of days with temperatures that enable freezing recently decreased in middle
Fig. 1. The observation sites of Songwol and Han River used in this study.
Europe, Australia, and New Zealand (Heino et al., 1999; Plummer et al., 1999; Collins et al., 2000).
These results agree with the theory of global warming.
In Korea, the annual mean temperatures from 1954 to 1999 (46 years) increased by 0.23oC decade−1, and the increase during winter was even greater (Jung et al., 2002). The increase of the temperatures in the interior was more rapid, namely, 1.39oC from 1973 to 2002 (30 years) in Seoul (Oh et al., 2004), and the frequency of abnormally high temperatures in winter from 1950 to 1999 (50 years) increased (Heo and Lee, 2006). It seems that the temperature increases associated with global warming might have great effects on the freezing climate, but studies involving both temperature increases and the freezing climate are rare.
This study compares the freezing climate of Seoul weather station and the freezing climate of nearby Han River. It focuses on the long-term variations of these two collections of freezing data and on the correlations of temperature with freezing.
Data and Method
Data
The daily minimum temperature, annual first freezing date, and annual freezing days from 1907 to 2006 (100 years) were used. The daily minimum temperature was taken from the Automatic Weather System (AWS) at the Seoul weather station (37o34'N, 126o57'E, Songwol-dong Chongro-gu Seoul, hereinafter Songwol). The annual first freezing date and freezing days were taken from Songwol and from the Han River freezing observatory (37o30'N, 126o57'E, hereinafter Han River); both locations are identified in Fig. 1. These data all are provided by Korean Meteorological Administration (KMA). Songwol and Han River are different in the observation method of freezing.
For Songwol, the freezing of water outside is defined as freezing. The annual freezing days correspond to the total freezing days observed from October to February of the following year.
For Han River, the freezing observation was made 100 m upstream of the second and fourth pier at the south end of the Han River Bridge; this is at the center of Han River, which penetrates Songwol. An inability to see through the water because of ice at this point is referred to as freezing, and a partial exposure of the river due to melted water on the surface is referred to as thawing. Thus, there may be multiple occurrences of freezing and thawing between the first freezing date and the last thawing date. The annual freezing days are defined as the dates from the first freezing date to the last thawing date. The thawing determination and the recording method might change significantly because of the long duration of subjective observations, so the thawing days within the freezing period were not considered reliable. The freezing data for Han River from the late 1940s to the mid-1950s are missing as a result of the Korean War.
Songwol is located at the downtown area, and it is judged based on the presence of freezing through thin ice at the field. It is impracticable to explain accurately freezing in nature by using a freezing phenomenon observed at the field. Thus, this study also investigated freezing using data of Han River. As Songwol and the Han River are situated closely together, and have similar weather conditions, they are fit for the comparison of freezing at the field and in nature.
Method
The variation of first freezing dates and freezing days at Songwol and Han River was analyzed by change point analysis (CPA). This statistical analysis method is mainly used to define the objective regime shift from the time series data. The t-values are calculated for each year, and the greater absolute value of the t-value shows the obvious change. When an increasing tendency is present at a certain point, the t- value is a negative number, and a decreasing tendency corresponds to a positive t-value. For more details about this analysis, please refer to the studies of Elsner et al., (2000) and Chu (2002).
Long-term Variation of Freezing Climate
First freezing date
Figure 2 shows the histograms and box plots of the distributions of the first freezing dates at Songwol and Han River. The mean first freezing date and standard deviation of each site are listed in Table 1.
The mean first freezing dates of the two observatories are October 28 and December 28- Songwol is about two months earlier than Han River.
The distribution of first freezing dates shows that Han River (standard deviation: 15.62 days) has greater variation than does Songwol (standard deviation: 9.31 days). For Songwol, the earliest first freezing date was October 10, 1911, 18 days earlier than the mean first
freezing date, and the latest first freezing date was November 20, 1975, 23 days later than the mean first freezing date. For Han River, the earliest first freezing date was December 4, 1934, 24 days earlier than the mean first freezing date, and the latest first freezing date was February 13, 1963, 45 days later than the mean. Han River has never frozen before Songwol.
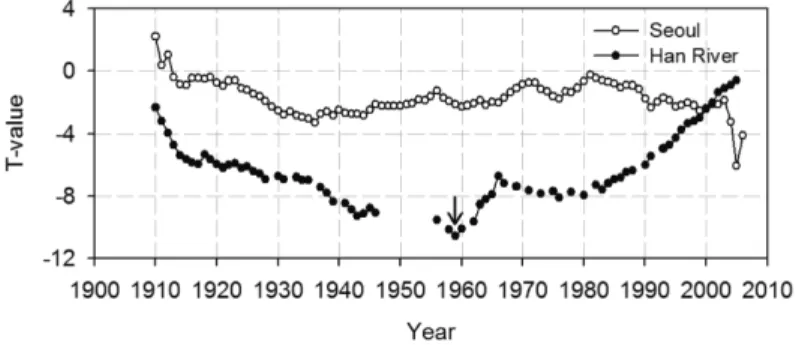
Figure 3 shows the annual variation of first freezing dates for Songwol and Han River. The first freezing dates are getting later by 0.78 days decade−1 and 3.47 days decade−1, respectively, and all these data exhibit P-values below 0.01, indicating noticeable results with 99% reliability. The result of CPA for the time series of first freezing dates shows that Han River is more variable than Songwol, except for the period after 2000 (Fig. 4). The regime shift is not clear for Songwol, but the data indicate that 1959 is an important point of change for Han River - the first freezing dates after 1959 were later than those before 1959.
Han River has seven no-freezing years (1960, 1971, 1972, 1978, 1988, 1991, and 2006), all of which come after 1959. Except for the no-freezing years, all ten earliest freezing years (1934, 1937, 1926, 1910, 1912, 1924, 1909, 1922, 1935, and 1939) come before 1959, and all ten latest freezing years (1963, 1977, 1999, 1987, 1997, 1989, 2003, 1959, 1992, and 1993) come after 1959.
Freezing days
Figure 5 shows the histograms and box plots of the annual period of the freezing days at Songwol and Han River. The mean freezing days for Songwol and Han River are 159.06 days and 50.33 days, respectively (Table 2). There are distinct differences between the two locations, but it seems they were also affected by the method of defining freezing days. The Fig. 2. Histograms and box plots of the first freezing date
in Songwol (gray bars) and Han River (dark gray bars) from 1907 to 2006. The left boundary of the box corresponds to the 1st quartile, the right boundary of the 3rd quartile, and vertical solid lines and dotted lines within the box corre- spond to the median (2nd quartile) and average value, respec- tively. The two perpendicular lines at the left and right of the box are referred to as “whisker”. The whiskers represent non-outlier boundary values of the box, and the circles repre- sent outliers.
Table 1. Mean and ratio of change of the first freezing date in Songwol and Han River. ‘**’ is significant at the 99% confi- dence level
Songwol Han River
Mean of the first freezing date (standard deviation) 28, October (9.31 days) 28, December (15.62 days)
Ratio of change +0.78 days decade−1** +3.47 days decade−1**
variation of freezing days at Han River (standard deviation: 30.58 days) is greater than that at Songwol (standard deviation: 13.62 days). The longest period of freezing days is 101 days (in both 1927 and 1935) for Songwol and 191 days (in both 1922 and 1973) for Han River.
Figure 6 shows the annual variation of freezing days for Songwol and Han River. The change rates of freezing days for Songwol and Han River are −2.01 days decade−1 and −7.57 days decade−1, respectively;
thus, both exhibit a decreasing tendency (Table 2). All of these data exhibit a P-value below 0.01, indicating noticeable results with 99% reliability. The decreasing tendency of the freezing days is stronger than the late tendency of first freezing dates, indicating that the last freezing date is getting earlier. This result agrees with prior observations that the freezing start date and end date of lakes and rivers in the northern hemisphere are getting earlier and later, respectively (Magnuson et al., 2000).
The result of CPA for the time series of the number of freezing days shows that Han River is more variable than Songwol, except for the period after 2000 (Fig. 7). The analysis identified the regime shifts of Songwol and Han River to be 1936 and 1958, respectively. This means that the freezing days were Fig. 4. T-values of the first freezing dates in Songwol (opened circle) and Han River (closed circle) from 1907 to 2006. Arrow indicates a regime shift year detected using change point analysis (CPA).
Fig. 3. Time series of the first freezing dates in Songwol (gray lines) and Han River (black lines) and their trend lines. ‘o’
denote seven no-freezing years in Han River from 1907 to 2006.
Fig. 5. Same as Fig. 2 but for the freezing period.
decreasing compared to the previous year. For Han River, the regime shift was very clear and was similar to the change point of the first freezing date in 1958.
Han River experienced long freezing-day years in nine out of ten years (1927, 1935, 1912, 1924, 1967, 1926, 1909, 1922, 1937, and 1910), all of which come before 1957.
Relationship between Freezing and Lowest Temperature
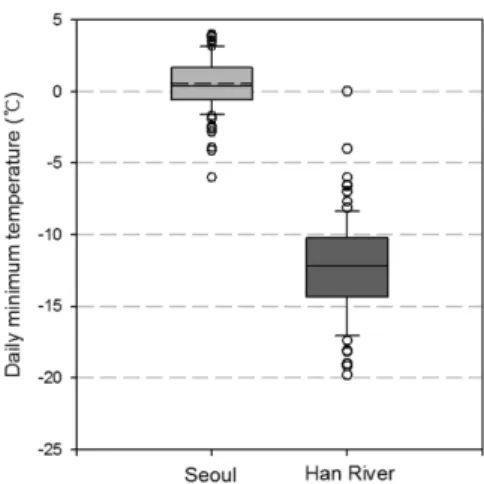
Figure 8 shows the box plot of the daily minimum temperature of the first freezing dates at Songwol and Han River; the mean daily minimum temperature was 0.55oC and −12.22oC, respectively, when the first freezing occurred. The standard deviations for
Songwol and Han River were 1.83oC and 3.45oC, respectively. This shows that Han River begins to freeze at a temperature that is 12.77oC lower than that at which Songwol freezes, and the temperature distribution is wide.
As the freezing is also affected by how long the cold weather lasts, an analysis was performed to determine how long the sub-zero temperature lasted before freezing occurred. For Songwol, the sub-zero daily minimum temperature was maintained for an average of 6.43 days just before the first freezing, and for Han River, it was maintained for an average of 8.94 days before the first freezing.
Table 3 lists the correlation coefficients between the annual minimum temperature and the first freezing date and between the annual minimum temperature Fig. 6. Same as Fig. 3 but for the freezing period.
Fig. 7. Same as Fig. 4 but for the freezing period.
Table 2. Mean and ratio of change of the freezing period in Songwol and Han River. ‘**’ is significant at the 99% confidence level
Songwol Han River
Mean of the freezing period (standard deviation) 159.06 days (13.62 days) 50.33 days (30.58 days)
Ratio of change -2.01 days decade−1** -5.24 days decade−1**
and the freezing days, where the annual minimum temperature is defined as the lowest temperature value from the daily minimum temperatures of October to February of the following year, in which the freezing occurred. The first freezing date and annual minimum temperature of Songwol and Han River exhibit a noticeable positive correlation with 99% reliability.
The freezing days exhibit a noticeable negative correlation with 95% and 99% reliabilities for Songwol and Han River, respectively.
Conclusion and Discussion
This study has compared the freezing climates of Songwol and nearby Han River using freezing data from 1907 to 2006 (100 years).
The first freezing dates of both Songwol and Han River are getting later, and both locations exhibit a decreasing tendency for freezing days. This shows that the freezing environment change is relevant to temperature change and is a part of overall climate
change. The important values are summarized in the abstract.
The results of this study are meaningful because both the observations and the natural freezing climates were handled together. The freezing climate changes of Songwol and Han River exhibit similarities, but the extent and regime shift are different; the freezing climate change was found more clearly in the Han River data, and analysis identified the late 1950s as the important point of change. Also, the freezing data taken from Han River show that freezing at Han River requires stronger cold weather than Songwol. The reason is difference of the freezing observation method of Songwol and the Han River. It is considered that the Han River is frozen when a layer of ice is thick not enough to be able to see the river. Thus, the temperature of first freezing date of the Han River must be lower than Songwol’s, because ice observed at the outside field is thin. This result means that the observed and natural freezing must be studied with categorization in future ice studies.
However, as these results were obtained from local data, they have a limited ability to explain global freezing climate changes. Therefore, this study needs to be expanded to wider regions. And since the variations in freezing years can be interpreted as the result, not of climate change, but of the meteorological characteristics of each year, a case study for these years is necessary. Also, a variety of approaches must be employed to analyze the freezing climate changes.
Studying the variation using periodical analysis is one method. Determining if the factor that affects freezing is the global average temperature change, polar temperature change, or some other factor also deserves attention. By conducting additional studies with these methods and emphases, we will be able to accurately track the change in the freezing climate.
Acknowledgments
This work was funded by the Korea Meteorological Administration Research and Development Program under Grant CATER 2006-2306.
Fig. 8. Box plots of the daily minimum temperature of the first freezing dates in Songwol (gray box) and Han River (dark gray box).
Table 3. Correlation coefficients between yearly minimum temperature and the first freezing date/the freezing period in Songwol and Han River. ‘**’ and ‘*’ are significant at the 99% and 95% confidence levels, respectively
Songwol Han River The first freezing date 0.49** 0.49**
The freezing period -0.20* -0.61**
References
Barry, R.G., Serreze, M.C., Maslanik, J.A., and Preller, R.H., 1993, The Arctic sea ice-climate system:
Observations and modeling. Reviews of Geophysics, 31, 397-442.
Bonsal, B.R., Zhang, X., Vincent, L.A., and Hogg, W.D., 2001, Characteristics of daily and extreme temperatures over Canada. Journal of Climate, 14, 1959-1976.
Brown, R.D., 2000, Northern Hemisphere snow cover variability and change, 1915-1997. Journal of Climate, 13, 2339-2355.
Chang, S.K., Lee, B.Y., Chung, H.S., and Kang, S.H., 2003, Global environmental changes and the Antarctic.
Journal of Korean Earth Science Society, 24, 216-233.
Chang, S.K., Lee, B.Y., Yoon, H.I., and Won, Y.I., 1998, Changes related to earth sciences parameter observed in the vicinity of the King Sejong Station off the Antarctic Peninsula. Journal of Korean Earth Science Society, 19, 533-548.
Chu, P.S., 2002, Large-scale circulation features associated with decadal variations of tropical cyclone activity over the central North Pacific. Journal of Climate, 15, 2678- 2689.
Chung, H.S., Lee, B.Y., Chang, S.K., Kim, J.H., and Kim, Y.D., 2004, Ice cliff retreat and sea-ice formation observed around King Sejong Station in King George Island, West Antarctica. Ocean and Polar Research, 26, 1-10.
Collins, D.A., Della-Marta, P.M., Plummer, N., and Trewin, B.C., 2000, Trends in annual frequencies of extreme temperature events in Australia. Australian Meteorological Magazine, 49, 277-292.
Easterling, D.R., Evans, J.L., Groisman, P.Y., Karl, T.R., Kunkel, K.E., and Ambenje, P., 2000, Observed variability and trends in extreme climate events.
Bulletin of American Meteorological Society, 81, 417- 425.
Elsner, J.B., Jagger, T., and Niu, X.F., 2000, Changes in the rates of North Atlantic major hurricane activity during the 20th century. Geophysical Research Letters, 27, 1743-1746.
Frich, P., Alexander, L.V., Della-Marta, P., Gleason, B., Haylock, M., Klein-Tank, A., and Peterson, T., 2001, Observed coherent changes in climatic extremes during the second half of the 20th Century. Climate Research, 19, 193-212.
Gloersen, P., Parkinson, C.L., Cavalieri, D.J., Comiso, J.C., and Zwally, H.J., 1999, Spatial distribution of trends and seasonality in the hemispheric sea ice covers: 1978- 1996. Journal of Geophysical Research, 104, 20827- 20836.
Heino, R., Brázdil, R., Forland, E., Tuomenvirta, H.,
Alexandersson, H., Beniston, M., Pfister, C., Rebetez, M., Rosenhagen, G., Rösner, S., and Wibig, J., 1999, Progress in the study of climatic extremes in northern and central Europe. Climatic Change, 42, 151-181.
Heo, I.H. and Lee, S.H., 2006, Changes of unusual temperature events and their controlling factors in Korea. Journal of the Korean Geographical Society, 41, 94-105.
Hulme, M., Osborn, T.J., and Johns, T.C., 1998, Precipitation sensitivity to global warming: Comparison of observations with HadCM2 simulations. Geophysical Research Letters, 25, 3379-3382.
IPCC, 2007, Climate Change 2007: The Physical Science Basis. IPCC, 996 p.
Jones, P.D. and Hulme, M., 1996, Calculating regional climatic time series for temperature and precipitation:
methods and illustrations. International Journal of Climatology, 16, 361-377.
Jung, H.S., Choi, Y., Oh, J.H., and Lim, G.H., 2002, Recent trends in temperature and precipitation over South Korea. International Journal of Climatology, 22, 1327-1337.
Kim, S.S., Jang, S.M., Baek, H.J., Choi, H.Y., and Kwon, W.T., 2006, Climatological variability of temperature and precipitation in Jeju. Journal of Korean Earth Science Society, 27, 188-197.
Lindsay, R.W. and Zhang, J., 2005, The thinning of arctic sea ice, 1988-2003: Have we passed a tipping point?
Journal of Climate, 18, 4879-4894.
Lindsay, R.W., Zhang, J., Schweiger, A., Steele, M., and Stern, H., 2009, Arctic Sea Ice Retreat in 2007 Follows Thinning Trend. Journal of Climate, 22, 165-176.
Magnuson, J.J., Robertson, D.M., Benson, J.B., Wynne, R.H., Livingstone, D.M., Arai, T., Assel, R.A., Barry, R.G., Card, V., Kuusisto, E., Granin, N.G., Prowse, T.D., Stewart, K.M., and Vuglinski, V.S., 2000, Historical trends in lake and river ice cover in the Northern hemisphere. Science, 289, 1743-1746.
Oh, S.N., Kim, Y.H., and Hyun, M.S., 2004, Impact of Urbanization on Climate Change in Korea, 1973-2002.
Journal of the Korean Meteorological Society, 40, 725- 740.
Parker, D.E., Jones, P.D., Folland, C.K., and Bevan, A., 1994, Interdecadal changes of surface temperature since the late nineteenth century. Journal of Geophysical Research, 99, 14373-14399.
Perovich, D.K., Richter-Menge, J.A., Jones, K.F., and Light, B., 2008, Sunlight, water, and ice: Extreme Arctic sea ice melt during the summer of 2007. Geophysical Research Letters, 35, L11501, doi:10.1029/2008GL034007.
Plummer, N., Salinger, M.J., Nicholls, N., Suppiah, R., Hennessy, K.J., Leighton, R.M., Trewin, B.C., Page, C.M., and Lough, J.M., 1999, Changes in climate
extremes over the Australian region and New Wealand during the twentieth century. Climatic Change, 42, 183- 202.
Rigor, I.G. and Wallace, J.M., 2004, Variations in the age of Arctic sea-ice and summer sea-ice extent. Geophysical Research Letters, 31, L09401, doi:10.1029/2004GL019492.
2011년 10월 4일 접수 2011년 12월 9일 수정원고 접수 2011년 12월 13일 채택