• 검색 결과가 없습니다.

Study on the Estimation of Drying Time of Biomass : 1. Larch Wood Chip

N/A
N/A
Protected

Academic year: 2021

Share "Study on the Estimation of Drying Time of Biomass : 1. Larch Wood Chip"

Copied!
10
0
0

로드 중.... (전체 텍스트 보기)

전체 글

(1)

Study on the Estimation of Drying Time of Biomass : 1. Larch Wood Chip 1

Hyoung-Woo Lee 2

ABSTRACT

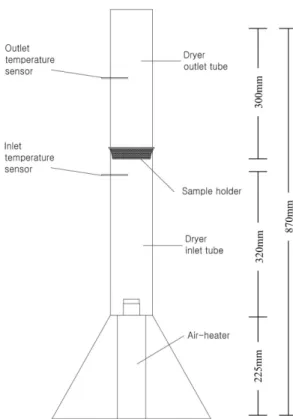
This study aims at modeling the rotary drying of wood chips in co-current mode and estimating the drying time of larch ( Larix kaemferi) wood chip. Drying data were obtained in a lab. scale fixed bed dryer operating with an air velocity of 1 m/sec. and at hot air inlet temperatures of 100 ℃, 200℃, and 300℃. The lab. scale fixed-bed drying rates for small, medium and large size larch wood chips that had been dried from 40%

wet-based moisture content (MC) to 10% MC at 200 ℃ drying temperature were 17.3 %/min., 10.2 %/min.

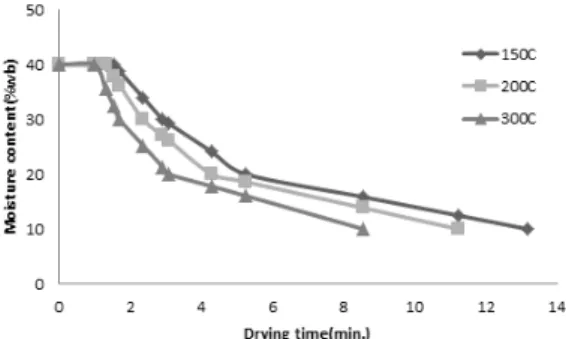
and 5.5 %/min., respectively. It was predicted that larch large size wood chips could be dried from 40%

MC to 10% MC in about 23.0, 34.6, and 44.7 minutes at 300 ℃, 200℃ and 150℃, respectively. Expected drying times for medium size chips were about 8.6, 11.2 and 13.2 minutes and those for small size chips were 4.3, 5.5 and 6.4 minutes, respectively.

Keywords : biomass, drying, wood chip, larch, drying time

1 Date Received December 9, 2014, Date Accepted December 30, 2014

2 College of Agriculture and Life Science, Chonnam National University, Gwangju 500-757, Korea

Corresponding author : Hyoung-Woo Lee (e-mail: [email protected])

1. INTRODUCTION

Biomass has been recognized as the most promising renewable energy resource. The bio- mass, in the form of wood chips, sawdust, bagasse, grass, and agricultural residues, is generated from trees, agricultural crops, or pur- pose-planted coppices, which absorb carbon dioxide needed for photosynthesis for their growth (Pang and Mujumdar 2010). In con- version of the biomass to energy and various

fuels, thermochemical conversion technologies are most promising technologies in short and medium terms (5 ∼15 years) including combus- tion, gasification, and pyrolysis (Bridgewater and Grassi 1991). For example, wood chip has been utilized as a fuel for space-heating and electrical power generation.

In order to increase energy efficiency, improve

energy product quality, and reduce carbon

emissions in its thermochemical energy con-

version, drying of the biomass to the required

(2)

moisture content is important in the develop- ment of energy production system. For example, the pyrolysis needs very dry biomass (less than 2% MC), gasification and pelletization needs the biomass at a moisture content of about 10%, and the direct combustion can handle wetter biomass (up to 20% MC). In addition, it was found that uniformity of drying also significantly affects the energy efficiency in heat plants (Xu and Pang 2008).

Lee (2006) performed tests on drying sawdust with direct contact thermal screw dryer.

However, most commonly used dryers for bio- mass are rotary dryer, barn dryer, fixed bed dryer, packed moving bed dryer, and pneumatic dryer (Pang and Mujumdar 2010). In industrial biomass dryers the temperature of hot gas as drying medium changed continuously during drying process. Therefore, it is necessary to predict the change of the gas temperature during drying to estimate the drying time of biomass with certain conditions. In co-current mode wet biomass is fed co-currently with hot gas and the temperature of hot gas decreases as biomass dries. In counter-current mode the biomass almost dried to target moisture content should contact with hot gas at very high tem- perature and biomass can be ignited. Lee (2007) studied on drying sawdust with fluid- ized-bed dryer. But the drying temperature was too low (20 ∼50℃) in that study.

The objective of this study is to develop a model to simulate the process of rotary drying, based on the results from the lab. scale con- stant-temperature drying experiments on the

chips of larch ( Larix kaemferi), which is one of the main softwood species in Korea, to provide information of the dryer design and operation optimization.

2. MATERIALS and METHODS 2.1. Material

Air-dried larch ( Larix kaemferi) wood chips were prepared and separated by a sieve shaker with sieves of aperture sizes of 4, 8 and 16 mm. Chips smaller than 4 mm were named as small size chips, chips between 4 and 8 mm as medium size chips, and chips between 8 ∼16 mm as large size chips.

All these chips were dipped into water for 48 hours to simulate green moisture content.

Water-soaked chips were left at room temper- ature for 24 hours to remove surface water.

Initial moisture content (wet-basis) before lab.

scale drying experiment ranged 74 ∼78, 66∼72 and 71 ∼74% for small, medium and large size chips, respectively.

2.2. Lab. scale constant-temperature drying experiment

Fig. 1 shows the schematics of lab. scale

fixed-bed dryer for constant-temperature drying

experiment. Inner diameter of drying tube was

80 mm and total length of drying tube was 620

mm. Depth of sample holder made with steel

wire screen was 25 mm. Air heater (electrical

power 2 kW, air temperature 70 ∼600℃, air

(3)

Fig. 1. Lab. scale fixed-bed dryer.

flow rate 0.15 ∼0.5 m 3 /min.) was located at the bottom of drying tube. Air flow rate was set at constant to maintain the hot air velocity in drying tube at 1 m/sec.

Inlet temperature of hot air was monitored to maintain the constant drying temperature and outlet air temperature was also measured.

Industrial rotary drying of biomass can gen- erally operate at drying temperatures from 200 ℃ to 500 ℃. At high temperatures, fire risk is high when the temperature of the dried biomass is over 250 ℃ (Pang and Mujumdar 2010), especially in the counter-current mode.

Therefore, each 30 grams of sample was put into the sample holder and drying test was per- formed at each drying temperature of 100 ℃, 200 ℃ and 300℃ for each chip size. Weight of sample was measured at 1 minute-interval to estimate drying characteristics curve.

2.3. Analysis of lab. scale drying characteristics curves

Regression analysis of lab. scale drying char- acteristics curves were performed to esti- mated the relationship between drying time and moisture content during drying according to chip size and drying temperature as equation [1].

    ··· [1]

M : moisture content of chip (%wb) t : drying time (min.)

Drying rate at each moisture content step is determined based on the drying times from

initial and final moisture content of each step.

Drying rate of wood chip depends largely on the initial moisture content of wood chip.

Drying rate decreases as initial moisture con-

tent of wood chip decreases. Initial moisture

content of wood chip depends largely on wood

species. In general initial moisture content of

wood chip does not exceed 50% (wet-basis). In

this study initial moisture content of larch wood

chip was assumed to be 50% for the

standardization. Target moisture content was

set at 10%. Four moisture content steps with

MC interval 10% were 50% ∼40%, 40%∼30%,

30% ∼20% and 20%∼10%. And drying rate

was estimated for each step using equation [2].

(4)

    

   

··· [2]

: drying rate at i

th

moisture content step (%/min.)

: initial moisture content at i

th

moisture content step (%wb)

: final moisture content at i

th

moisture content step (%wb)

: drying time at finishing the i

th

moisture content step (min.)

: drying time at initiating the i

th

moisture content step (min.)

2.4. Effect of initial moisture content and drying temperature on drying rate

The effect of initial moisture content on drying rate at a constant drying temperature was regression-analyzed for each chip size as equa- tion [3]. And the effect of drying temperature on drying rate at a constant initial moisture was also regression-analyzed for each chip size as equation [4].

      ··· [3]

    ··· [4]

: drying rate at a given temperature T ( ℃) (%/min.)

: drying rate at a given initial moisture content 

(%/min.)

   : coefficients

2.5. Simulation of drying process

Whole drying process can be simulated with the relationships from section 2.3. Basic conditions assumed for this simulation were as follows:

Chip initial moisture content (  ) = 40 %wb

Chip final moisture content ( 

) = 10 %wb Chip feed rate (  ) = 1,000 kg/hr Dried chip production rate (  ) = 600 kg/hr Heat efficiency of drying process () = 60 % Ambient temperature ( 

) = 15 ℃ Chip initial temperature (

) = 15 ℃

The heat efficiency of the dryer is defined as the ratio of the heat used for water evaporation to the total heat input to dryer. The heat effi- ciency of the rotary dryer is largely dependent on the differential temperatures between the inlet and exhaust gas, although the heat trans- fer is also influenced by the relationship be- tween the design of flights and the speed of rotation. Irrespective of the gas and material temperatures, however, the drying (or residence) time may be critical, as this is governed by the rate of diffusion of the water from the core to the surface of the material (Li and Finney 2010). Strumillo et al. (2006) reported that the heat efficiency of the industrial rotary dryer for drying solids ranged from 50% to 70%. In this study the heat efficiency of rotary dryer was assumed to be 60% for the standardization.

Assuming latent heat of water evaporation is constant at 539 kcal/kg, the net heat for evaporating water from feedstock for 1 hour and the gross heat flow rate required for 1 hour can be calculated as equations [5] and [6], respectively:

      ×  ··· [5]

    

 

··· [6]

 

: the net heat flow rate for evaporating water from

feedstock for 1 hour (kcal/hr)

(5)



: the gross heat flow rate required for 1 hour (kcal/hr)

The gas (hot air) outlet temperature from the dryer is predicted with the gas inlet temperature to the dryer using equation [7] suggested by Land (2012).

    ×   ··· [7]

: the gas outlet temperature from the dryer ( ℃)

: the gas inlet temperature to the dryer ( ℃)

Assuming the specific heat and density of gas (air) is constant at 0.24 kcal/kg/ ℃ and 1.2 kg/m 3 , respectively, the mass flow rate of gas required for 1 hour and the normal volumetric flow rate of gas required for 1 hour can be es- timated as equations [8] and [9], respectively:

         × 



··· [8]

   

 

··· [9]



: the mass flow rate of gas required for 1 hour (kg/hr)



: the normal volumetric flow rate of gas required for 1hour (m

3

/hr)

The heat capacity (specific heat) of wood de- pends on the temperature and moisture content of wood but is practically independent of den- sity or species. The specific heat of dry wood and water was assumed to be constant at 0.26 and 1.00 kcal/kg/ ℃, respectively (Forest Products Laboratory 1999). And it was as- sumed that water would not be evaporated from chips in heating period. Then the net heat flow rate required to preheat feedstock to 100 ℃

and the preheating time can be estimated using equation [10] and [11], respectively:

       ×  ×      ×

 ×    ×  ··· [10]

    



×  ··· [11]



: the net heat flow rate required to preheat feedstock to 100 ℃ (kcal/hr)

: the preheating time (min.)

The oven-dried weight of feedstock and the water evaporation rate in a drying step is cal- culated as equations [12] and [13], respectively:

   ×       ··· [12]

   

   



     

 

 

··· [13]



: the feeding rate of wood substance (oven-dried wood) (kg/hr)





: the water evaporation rate in a drying step  (kg/hr)

Therefore, the net heat flow rate for evaporat- ing water from feedstock in a drying stage for 1 hour is calculated as equation [14]:

    ×  ··· [14]

 

: the net heat flow rate for evaporating water from feedstock in a drying step  for 1 hour (kcal/hr)

Using  , the gas temperature drop and the

average gas temperature in a drying step  can

be determined with equation [15] and [16],

respectively:

(6)

Fig. 2. Lab. scale drying curves of larch large wood chips.

     × 

 



··· [15]

   

       

··· [16]



: the gas temperature drop ( ℃)



: the average gas temperature in a drying step  (℃)



: the inlet gas temperature in a drying step  (℃)

The drying time in a drying step  with the drying rate  at a hot gas temperature of

  can be estimated as equation [17]:

     

   

··· [17]

: the drying time (min.) in a drying step  (min.)



: the initial moisture content of feedstock in a drying step  (%wb)



: the final moisture content of feedstock in a drying step  (%wb)

Finally, the total drying time is predicted as equation [18]:

       ··· [18]

: the total drying time (min.)

3. RESULTS and DISCUSSION 3.1. Lab. scale drying characteristics

curves

Fig. 2 shows the drying curves of larch large size wood chips at three different drying (or hot gas) temperatures, 100 ℃, 200℃ and 300℃

and the coefficients of regression equations for the drying curves of three chip sizes are shown

on Table 1. As expected, the drying rate in- creased as drying temperature increased and the chip size deceased.

Drying rates from for five different moisture content steps of each chip size were estimated at each drying temperature using regression equations from Table 1.

From the drying rate data on Table 2 the ef- fect of initial moisture content at the constant drying temperature and the effect of drying temperature at the same initial moisture content on drying rate were investigated through regression analyses.

3.2. Simulation results

Whole drying processes were simulated based

on the drying rate data from the lab. scale dry-

ing characteristics curves and the basic

conditions. Total water removal was 333 kg/hr

from moisture content 40% to 10% and the

gross heat requirement was 378,211 kcal/hr

with heat lost during drying process. Simulation

results for the larch large wood chips at 300 ℃

(7)

Chip size Drying

temperature ( ℃) a b c R

2

Small

100 0.0181 -4.6638 76.093 0.9941

200 0.5398 -15.662 85.506 0.9463

300 0.3775 -18.508 83.663 0.9452

Medium

100 0.2089 -6.9759 68.093 0.9987

200 1.0493 -16.953 75.735 0.9858

300 1.6380 -22.595 75.386 0.9792

Large

100 0.0361 -3.3144 76.846 0.9956

200 0.1621 -7.5171 73.957 0.9951

300 0.3345 -13.018 72.248 0.9937

Table 1. Coefficients of regression equations for lab. scale drying curves of larch wood chips

Chip size Drying

temperature ( ℃)

Moisture content step (%wb)

50 ∼40 40 ∼30 30 ∼20 20 ∼10 50 ∼10

Small

100 5.742 5.042 4.233 3.202 4.340

200 27.310 23.352 18.274 10.514 17.285

300 35.262 30.273 24.270 15.833 24.148

Medium

100 5.697 4.789 3.646 1.488 3.044

200 16.315 13.796 10.745 5.984 10.212

300 23.279 20.107 16.320 11.204 16.457

Large

100 3.015 2.557 1.991 0.592 1.368

200 6.431 4.790 4.131 3.528 5.482

300 14.411 12.735 10.747 8.263 11.025

Table 2. Estimated drying rates (%MC/min) according to the chip size, moisture content step and drying temperature

was as Table 5. Drying curves predicted from the simulated results are shown on Figs. 3 ∼5.

There are large differences between lab. scale drying characteristics curves and simulated drying curves. In lab. scale experiments gas (or drying) temperatures are maintained at constant level. But in practical drying process hot input gas offers the heat for preheating material, evaporating water and compensating heat loss and the gas temperature decreases continuously as material dries through the dryer. In this simulation model the inlet gas temperature de-

creased gradually to the outlet gas temperature.

This means that the drying potential of hot gas decreases as drying progresses. Therefore it is not possible to estimate the drying time of materials precisely only with the test results at constant drying temperature.

Larch large size wood chips are predicted to

be dried from moisture content 40% to 10% in

about 23.0, 34.6 and 44.7 minutes at 300, 200

and 150 ℃, respectively. Medium size chips

about 8.6, 11.2 and 13.2 minutes and small size

chips 4.3, 5.5 and 6.4 minutes. Cairo et al.

(8)

Chip size Drying temperature ( ℃) a b c R

2

Small

100 -0.0008 0.1422 0.6944 0.9998

200 -0.0095 1.2200 -10.0060 0.9992

300 -0.0086 1.2463 -5.5740 0.9995

Medium

100 -0.0024 0.2430 3.2912 0.9921

200 0.0026 -0.0880 4.2957 0.9909

300 -0.0020 0.3457 2.1658 0.9999

Large

100 -0.0024 0.2430 3.2912 0.9921

200 0.0026 -0.0880 4.2957 0.9909

300 -0.0020 0.3457 2.1658 0.9999

Table 3. Coefficients of regression equations for drying rates of larch wood chips at three different hot gas temperature (

 



 )

Chip size Initial MC (%wb) a b c R

2

Small

50 0.00006 0.1108 -1.4721 0.9493

40 0.00005 0.0950 -1.2329 0.9515

30 0.00004 0.0736 -0.8927 0.9595

20 0.00005 0.0389 -0.3052 0.9878

Medium

50 0.00003 0.0710 -0.4288 0.9888

40 0.00004 0.0579 -0.3457 0.9902

30 0.00005 0.0416 -0.2488 0.9922

20 0.00009 0.0101 -0.1142 0.9966

Large

50 0.00010 0.0070 0.2511 0.9876

40 0.00010 0.0047 0.2229 0.9899

30 0.00010 0.0022 0.1815 0.9915

20 0.00010 -0.0040 0.1003 0.9942

(* MC : moisture content)

Table 4. Coefficients of regression equations for drying rates of larch wood chips at four different initial moisture content ( 

 

 )

Item Pre-

heating

Moisture content (%wb)

40 ∼30 30 ∼20 20 ∼10 Sum

Water removal (kg/hr) 0 143 107 83 333

Gross heat requirement (kcal/hr) 78,767 128,333 96,250 74,861 378,211

Gas inlet temperature ( ℃) 300 254 179 123 -

Gas temperature drop ( ℃) 46 75 56 44 -

Gas outlet temperature ( ℃) 254 179 123 80 -

Average gas temperature ( ℃) 277 217 151 101 -

Estimated drying rate (%/min.) 0 21.70 11.15 4.15 7.04

Time (min.) 0.49 0.46 0.90 2.41 4.26

Table 5. Simulation results of model for drying small size larch wood chips from moisture content 40% to 10%

at hot gas temperature of 300 ℃ with feed rate of 1,000 kg/hr

(9)

Fig. 3. Simulated drying curves of small size larch wood chips at hot gas temperature of 150 ℃, 200℃

and 300 ℃.

Fig. 4. Simulated drying curves of medium size larch wood chips at hot gas temperature of 150 ℃, 200℃

and 300 ℃.

Fig. 5. Simulated drying curves of large size larch wood chips at hot gas temperature of 150 ℃, 200℃

and 300 ℃.

(2012) reported that the drying time of oak chips from moisture content 33% to 16% was about 20 minutes at 165 ℃. With this simu- lation model at 150 ℃ the total drying time to dry larch large wood chips from moisture content 33% to 16% was estimated as 17.6 minutes. Considering the higher water diffusion rate in larch than oak this simulation result can be regarded to be consistent with practical observation.

4. CONCLUSION

Biomass is one of the most promising and sustainable resources for future production of energy and bio-liquid fuel. Rotary drying is a common drying technology for drying wood chips and sawdust, operating at drying temper- atures from 200 ℃ to 500℃. This study devel- oped a model for estimating the drying time of larch wood chips using co-current rotary dryer.

The developed model can be used for the optimization of the drying conditions or dryer design to achieve the target moisture content.

This model was developed based on the lab.

scale constant-temperature drying experiments.

The simulation results are consistent with

practical observations. It is believed that the

industrial scale tests will remove the uncertainty

of the model and give a more accurate pre-

diction on the dryer performance.

(10)

REFERENCES

Babrauskas, V. 2001. Ignition of wood: A review of the state of the art. Interflam 2001, interscience Communications Ltd., London.

Bridgewater, A.V., Grassi, G. 1991. Biomass py- rolysis liquids: Upgrading and utilization.

Elsevier Applied Science, New York.

Cairo, N., Colangelo, G., Starace, G. 2012.

Performance analysis of two industrial dryers (cross flow and rotary) for ligno-cellulosic bi- omass desiccation. International Conference on Renewable Energies and Power Quality (ICREPQ

’12), Spain, 28 th to 30 th March, 2012.

Forest Products Laboratory. 1999. Wood Handbook.

USDA Forest Service.

Land, C.M. van’t. 2012. Drying in the process industry. John Wiely & Sons.

Lee, H.W. 2006. Study on the fluidized-bed drying

characteristics of sawdust as a raw-material for wood-pellet fuel. Journal of the Korean Wood Science and Technology 34(2): 30 ∼36.

Lee, H.W. 2007. Experimental study on the direct contact thermal screw drying of sawdust for wood-pellet fuel. Journal of the Korean Wood Science and Technology 35(2): 23 ∼28.

Li, H., Finney, K. 2010. EPSRC Thermal manage- ment of industrial processes: A review of drying technologies. Sheffield University Waste Incineration Centre.

Pang, S., Mujumdar, A.S. 2010. Drying of woody biomass for bioenergy: Drying technologies and optimization for an integrated bioenergy plant.

Drying Technology, 28: 690 ∼701.

Xu, Q., Pang, S. 2008. Mathematical modeling of

rotary drying of woody biomass. Drying

Technology, 26: 1344 ∼1350.

수치

Fig. 1. Lab. scale fixed-bed dryer.
Fig. 2. Lab. scale drying curves of larch large wood chips. × ········································ [15]  ···························· [16]
Table 1. Coefficients of regression equations for lab. scale drying curves of larch wood chips
Table 5. Simulation results of model for drying small size larch wood chips from moisture content 40% to 10%
+2

참조

관련 문서