.
, .
,
, J. Kor. Soc. Fish. Tech., 44(4), 362 369, 2008
DOI:10.3796/KSFT.2008.44.4.362
A study on the optimum condition of electric snow melting and deicing system for the anti-freezing testing road
Kyu-Il H AN *
Division of Mechanical Engineering, Pukyong National University, Busan 608-739, Korea
The snow melting system by electric heating wires which is adopted in this research is a part of road facilities to keep surface temperature of the road higher than freezing point of water for melting the snow accumulated on it. The electric heating wires are buried under paved road at a certain depth and operated automatically and manually. Design theory, amount of heating, and installation standard vary according to economic situation, weather condition, installation place and each country applying the system. A main purpose of this study is figuring out the appropriate range of required heat capacity and installation depth and pitch for solving snowdrifts and freezing problems with minimum electric power consumption. This study was performed under the ambient air temperature( 2 C, 5 C), the pitches of the electric heating wires(200 mm, 300 mm), heating value(250 W/m
2, 300 W/m
2, 350 W/m
2).
Key words : Electric heating cable, Anti-freezing, Light weight electric traction system, Simulation
* Corresponding author: [email protected], Tel: 82-51-629-6194, Fax: 82-51-629-6188
(Shin and Seo, 1993).
,
, ,
.
.
.
, ,
(Nydahl et al., 1987).
1965 (Lawrie, 1965).
, 1977
1982 20
.
,
.
.
,
,
,
.
4 ( , ,
, )
.
.
.
(A
r)
(1) .
A
rA
f/ A
t(1)
0 A
r1, A
r1
. A
r1 . A
r0
. , 0, 0.5, 1 .
Chapman
(Chapman, 1952), Chapman
Katunich
(Chapman and Katunich,
1956), (2) .
q
0q
sq
mA
r(q
eq
h) (2)
. Table. 1 3
.
,
A
r1 (2)
235.1 W/m
2, 20%
300 W/m
2.
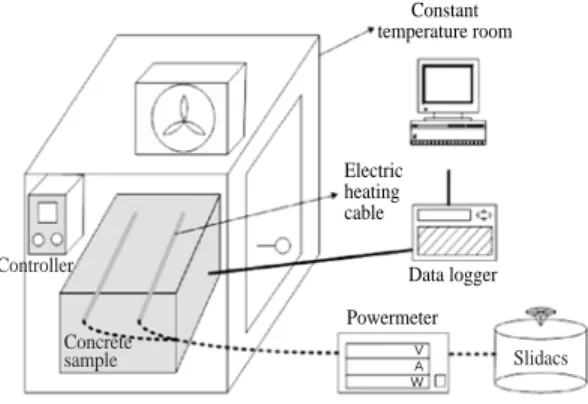
Fig. 1
.
,
, ,
.
.
, ,
(Powermeter) .
, .
T
type 32 ,
(yokogawa, DR 230) PC
, 10
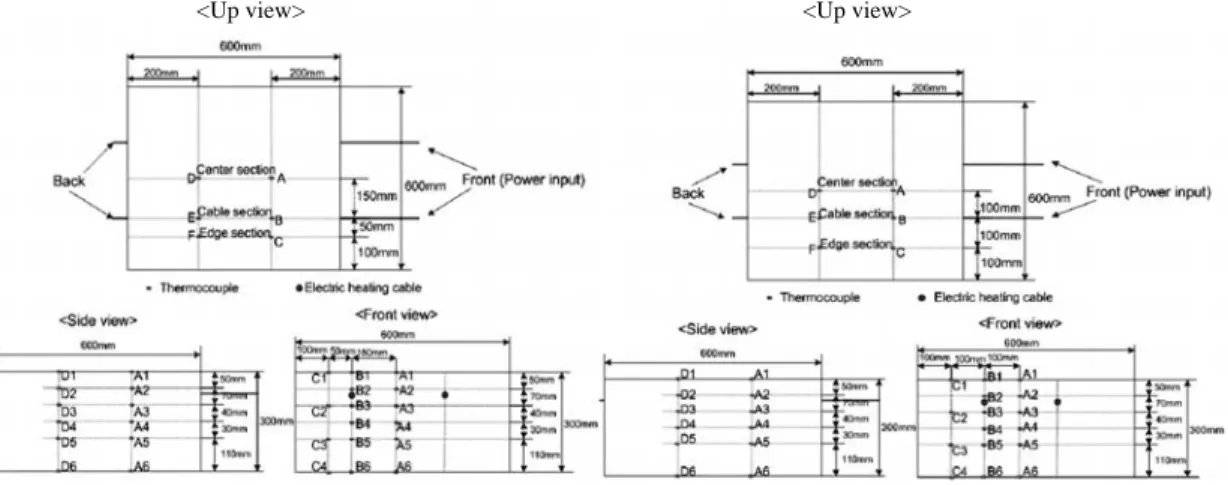
. Fig. 2 .
,
, 70 90
W/m .
.
70 mm ,
300 mm 200 mm .
2 C, 5 C .
.
250 W/m
2, 300 W/m
2,
350 W/m
2.
10mm .
Fig. 1. Schematic diagram of experimental apparatus.
Table 1. The average value of temperature and wind velocity
2004 2005 2006 Average Average
0.8 2.8 0.0 1.2
temperature( C) Average
wind velocity 3.7 3.5 3.6 3.6
(m/s)
Constant temperature room
Electric heating cable
Data logger Powermeter
V A W
Slidacs Concrete
sample Controller
3
2 C
5 C . Fig. 3 4
300 W/m
2, 300 mm,
. (0 C)
2 C 20 30
, .
Fig. 5 6 300 W/m
2, 5
C, 300 mm ,
. (a) Pitch of electric heating cable(300mm) (b) Pitch of electric heating cable(200mm) Fig. 2. A location of thermocouples.
<Up view> <Up view>
Fig. 3. Variation of surface temperature according to time( 2 C).
Fig. 4. Variation of surface temperature according to time ( 5 C).
10 8 6 4 2 0 -2 -4 -6
8 6 4 2 0 -2 -4 -6
Temperature( C) Temperature( C)
Time(hour)
Time(hour)
0 2 4 6 8
0 2 4 6 8
Fig. 5. Variation of surface temperature according to time(no ice condition).
8 6 4 2 0 -2 -4 -6
Temperature( C)
Time(hour)
0 2 4 6 8
A B C D E F
A B C D E F
A B C D E F
2 .
.
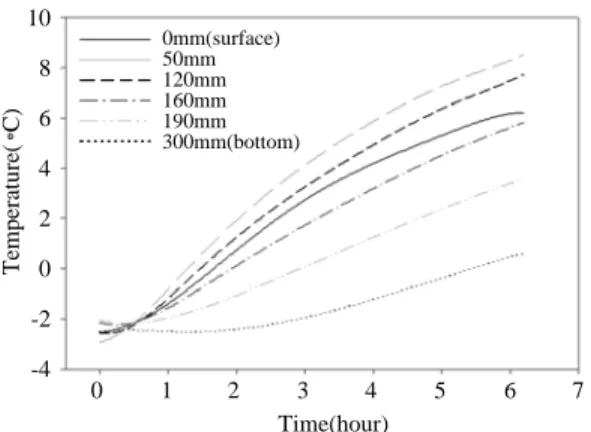
Fig. 7 8 300 W/m
2,
2 C,
,
. ,
Fig. 7 300 mm , Fig. 8
200 mm .
300 mm
200 mm 30 40
. 200 mm
300 mm 50 mm
,
.
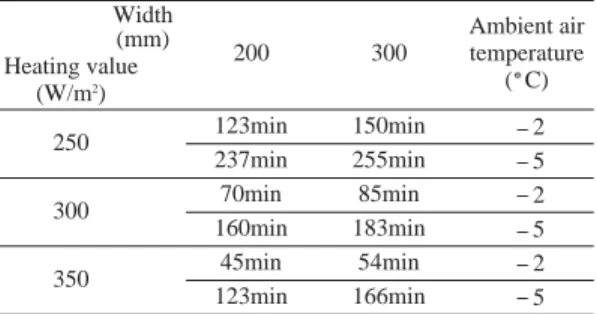
Table 2
.
4 (A, B, D, E)
. 4 ,
.
200 mm 10 30
. 200
mm
,
. 300 mm
. Fig. 6. Variation of surface temperature according to
time (ice condition).
8 6 4 2 0 -2 -4 -6 -8
Temperature( C)
Time(hour)
0 2 4 6 8 10 12 14 16 18 20
Fig. 7. Variation of temperature according to depth(pitch of heating cable : 300mm).
10 8 6 4 2 0 -2 -4
Temperature( C)
Time(hour)
0 2 4 6 8
A B C D E F
0mm(surface) 50mm 120mm 160mm 190mm 300mm(bottom)
Fig. 8. Variation of temperature according to depth(pitch of heating cable : 200mm).
10 8 6 4 2 0 -2 -4
Temperature( C)
Time(hour)
0 1 2 3 4 5 6 7
0mm(surface) 50mm 120mm 160mm 190mm 300mm(bottom)
,
(heat diffusion equation) . (3) (Incropera and Dewitt, 2007).
∂ ∂T ∂ ∂T ∂ ∂T ∂T
___ ∂x ( k___ ∂x ) ___ ∂y ( k___ ∂y ) ___ ∂z ( k___ ∂z ) ρc
p___ ∂t
(3)
.
1 , x, y, z 2
1 6
.
.
250 W/m
2, 300 W/m
2, 350 W/m
2. , 600
mm 300 mm
,
.
. Table 3 4
.
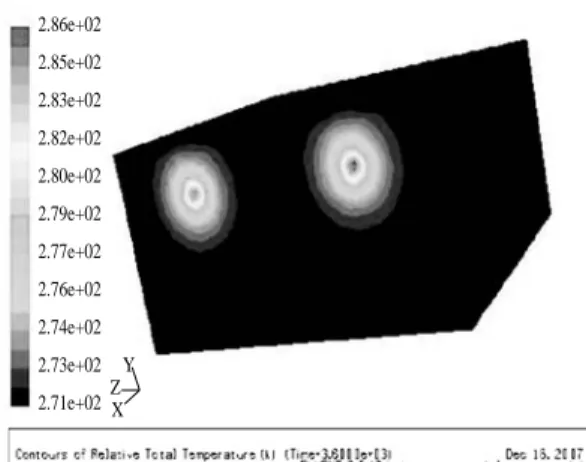
Fluent . Fig. 9 11
300 W/m2, 2 C,
300mm .
. Table 2. A comparison of melting point reaching time Table 3. Material properties
Material ρ c
pk
(kg/m
3) (J/kg K) (W/m K)
concrete 2700 1050 1.2
copper 8978 381 387.6
Table 4. Test conditions
ambient temperature( C) 2, 5 convection heat transfer
coefficient on surface(W/m
2K) 14.4
heating value(W/m
2) 250, 300, 350 Width
(mm) 200 300
Ambient air temperature Heating value ( C)
(W/m
2) 250
300
350
123min 237min 70min 160min
45min 123min
150min 255min 85min 183min
54min 166min
2 5 2 5 2 5
Fig. 9. Simulation interpretation diagram.
8
6
4
2
0
2
Temperature( C)
0 100 200 300 400 500 600 700 Time(min)
Simulation data Experiment data
50 ,
100 0 C
, 600 .
,
.
,
,
.
300 W/m
2, 300 mm ,
2 C 5 C
20 30 . 300 W/m
2,
300 mm , 5
C
2 .
200 mm 300 mm
(0 C) 40
. 2 (C, F) A,
B, D, E ,
2 .
200 mm 300 mm
, 300
mm .
350 W/m
2, 300 W/m
2.
300
W/m
2.
300 W/m
2,
2 , 300 mm ,
.
2007
.(PK 2007 024)
Chapman, W.P, 1952. Design of snow melting system.
Fig. 10. 1 hour later from initial set temperature of 2 C.
Fig. 11. 10 hours later from initial set temperature of 2 C.
2.86e+02 2.85e+02 2.83e+02 2.82e+02 2.80e+02 2.79e+02 2.77e+02 2.76e+02 2.74e+02 2.73e+02 2.71e+02
2.95e+02 2.93e+02 2.91e+02 2.88e+02 2.86e+02 2.84e+02 2.81e+02 2.79e+02 2.77e+02 2.74e+02 2.72e+02
Y Z X Y Z X