─ 169 ─
ISSN: 2288-1115(Print), 2288-1123(Online)ⓒ The Korean Society of Limnology. All rights reserved.
This is an open-access article distributed under the terms of the Creative Commons Attribution Non-Commercial License(http://creativecommons.org/licenses/by-nc/3.0/), which permits unrestricted non-commercial use, distribution, and reproduction in any medium, provide the original work is properly cited.
IntroductIon
Coastal lagoons are water bodies along with estuaries which are separated by barrier islands, coral reefs and sand bars from the adjacent ocean. And they are distinguished by shallow and slow water flow which is not the characteristics
of estuaries. Tidal currents transport water into and out of the lagoons by inlets which are cut through barriers, either by natural forces, winds, waves and tidal currents or man- made. Lagoons can be divided in three major categories as leaky lagoons, choked lagoons and restricted lagoons, considering the tidal channels and water exchange with the ocean (Kjerfve, 1986). Leaky lagoons are with wide tidal channels and water exchange with ocean without distur- bance and fast currents. But choked lagoons are in contrast with leaky lagoons, with restricted water exchange through
Long-term changes of Physicochemical Water Quality in Lake Youngrang, Korea
Bhattrai, Bal Dev (0000-0003-3457-1955) , Sungjin Kwak (0000-0003-0843-034X) , Kwansoon Choi
1(0000-0002-9358-0627) and Woomyung Heo* (0000-0001-9994-4658)
Department of Earth and Environmental Engineering, Kangwon National University, Samchok 25913, Republic of Korea
1
K-Water Institute, Korea Water Resources Corporation, Daejeon 34045, Republic of Korea
Abstract Physicochemical properties of water quality were analyzed to understand the long-term variations in Lake Youngrang from 1998 to 2015. Nonparametric statistical methods were applied to deduct correlation among water quality parameters and water quality trend. In total observations (N=64), the Secchi depth (SD) transparency showed significant positive correlation with salinity (r=0.458) and highly significant negative correlation with chlorophyll-a (r= -0.649) for p < 0.0001 in two-tailed test of Spearman’s rank correlation.
Significant negative correlations of SD were observed with chemical oxygen demand (COD), total phosphorus (TP) and total nitrogen (TN). These correlation patterns were very similar in rainy (N=25) and non-rainy (N=
39) periods too. Chlorophyll-a (Chl-a) had significant correlation with COD. Sen’s slope test was performed along with Mann-Kendall trend test (significance α=0.05, two-tailed) to find water quality trend. Positive trends were observed for SD and salinity with Sen’s slopes 0.012 and 0.385, respectively (p < 0.0001). Negative significant trends were observed for total nitrogen (TN) and Chl-a with Sen’s slopes -0.02 (p < 0.0001) and
- 0.346 (p=0.0010), respectively. Temperature, COD and phosphorus components had no trends. Carlson’s trophic state index (TSI) for SD, TP and Chl-a were obtained in the ranges of 46~80, 37~82 and 39~82, respectively. Trophic index values suggest that Lake Youngrang was mesoeutrophic to eutrophic and there could be possibility of anoxia during the summer and dominance of blue-green algae. Excess nutrient inputs from external and internal sources were the causes of eutrophication in this lake. The findings of this study would be helpful to recognize water quality variables to manage the water body.
Key words: eutrophication, temporal changes, water quality, trend analysis, salinity
Manuscript received 28 February 2017, revised 26 March 2017, revision accepted 4 April 2017
* Corresponding author: Tel: +82-33-570-6573, Fax: +82-33-574-7262, E-mail: [email protected]
one or more narrow channels with ocean in the coastline of high energy. And wind pattern play the major role for cir- culation within the lagoons. Restricted lagoons possess the mixed characteristics of leaky and choked lagoons. In the eastern coastal area of South Korea, there are 48 marine-or- igin natural lakes out of 57 natural lakes which were formed by sand dunes (Lee et al., 2006) and Lake Youngrang is one of the main lagoons in this region. Since it has one inlet channel to exchange water with East Sea, it can be the type of Choked lagoon. Water salinity of poor flushed lagoons;
slow inflowing fresh water and frequent intrusion of sea- water, in the eastern coastal region is over 0.5%, and are most of them are brackish in nature (Horne and Goldman, 1994; Heo et al., 2004).
Lagoons occupy the boundary between the ocean and land; and have unique habitats from ocean to inland. Along with the habitats of lagoons, there may be barrier islands, spits, beaches, sand dunes, salt marshes and seagrasses. The diverse ecosystem within the periphery of lagoons, gives rise not only to high species of diversity but also to the creation of ecotones-areas of transition between three hab- itats: freshwater, terrestrial and marine. In the recent years, these ecosystems were disturbed due to changes in climate and landscape of the region (Ouillon et al., 2005; Limoges et al. 2015; Das et al., 2016). Water quality of the lagoons have been deteriorating due to nutrient enrich from point and non-point sources. Eutrophication is the major threat to ecology and biological communities. Anthropogenic ac- tivities such as agriculture, urbanization, industrialization, aquaculture and recreational activities are major cause of the nutrients. Non-point source pollution from agricultural runoff and treated and untreated domestic water discharges are linked to the episodic eutrophic conditions and algal blooms which can be harmful too (Newton et al., 2003;
Roselli et al., 2009; Apau et al., 2012). Both lagoons and estuaries receive sediments from inland: estuaries from the catchment of rivers that flow into them and lagoons from surface runoff. Hence, coastal lagoons have a tendency to become filled in with sediments and thus disappear, in time, from the coastal landscape. Excess use of land and rapid industrialization are responsible to decrease the area of lagoons (Yoon et al., 2008; Kim et al., 2016). Human activ- ities are major threat to the existence and good health of the lagoons.
Coastal lagoons water quality is very important for the marine ecosystems as well as human health. Deterioration of water quality has negative impact on its surround, that’s why it is necessary to monitor coastal water bodies. The impact of natural and anthropogenic processes in the lagoon ecosystem identification requires continuous environmental monitoring. Changes in water quality, temporal and spatial, observed through monitoring help us to understand and analyze the long term trends. Any negative effect on the valuable natural environments could be predicted and miti- gated with proper actions (Bearman et al., 2011; Harris and Vinobaba, 2013). Urban wastewater treatment, dredging, artificial inlets, limits on urban development and changes in agricultural practices are best options for lagoons manage- ment (Newton and Mudge, 2005).
Previous literature of Lake Youngrang demonstrated short term water quality monitoring and analysis. Lake Young- rang recorded the highest values of TN/TP ratio (14) and TSI range (56~79) among the nine major eastern coastal lagoons in Korea (Heo et al., 1999). The shore length and area of lagoons were severely reduced due to urbanization and tourism purposes (Lee et al., 2006; Yoon et al., 2008).
The variation in stable C and N isotope ratios of pond smelt was low due to brackish nature of Lake Youngrang and salinity was observed high in July. The higher pond smelt δ
15N values in Lake Youngrang related to N sources from the watersheds, such as waste water and agricultural runoff (Lee et al., 2013). Lake Yeongrang could be described as eutrophic lagoon and suitable for phytoplankton growth (Moon et al., 2015).
In this study, we analyzed the state of physicochemical water quality and temporal variations in Lake Youngrang.
The data monitored through 17 years from 1998 to 2015 is
subjected for statistical analysis. To understand the seasonal
variations of water quality parameters, rainy and non-rainy
period were analyzed and comparison was done with the
total data. The non-parametric tests were selected to detect
correlation (Spearman’s rank correlation) and linear trends
of water quality. The Mann-Kendall test and Sen’s T test
were applied to detect trend (or no trend). Through the re-
search we would be able to obtain the knowledge of water
quality variations and trophic status of Lake Youngrang and
causes of water quality pollution.
MAterIALs And Methods
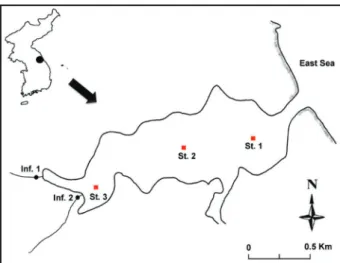
Lake Youngrang, located in the northern region of Sokcho city, is a shallow brackish lagoon (Fig. 1). The surface area of lagoon is 1.05 km
2with an average depth of 4.1 m (range;
1~8 m) and 10.28 km
2watershed area. Lagoon is connected with the east sea and Jangcheon stream is the main stream of freshwater inflow in this lake, which has watershed area of 4.74 km
2(Socho city, 2013). There are resorts and golf courses in the watershed of this lagoon.
Sokcho city meteorological data recorded average yearly precipitation of 1,400 mm and the yearly average air tem- perature of 12.9°C. From June to September, about 60~70
% of yearly precipitation was recorded. Monthly precipita- tion values were higher (about 600 mm) in 1998 and 2004 (Fig. 2). N and P generation in the drainage area was 167 kgN day
-1and 39 kgP day
-1respectively (Heo et al., 1999).
Water quality was monitored from 1998 to 2015 in a monthly basis in 64 episodes, non-rainy (March~May and Sept.~Nov.) and rainy period; monsoon season of Korea (June~Aug.), except severe winter (Dec.~Feb.). Data mea- surements of some parameters were done on the spot while collecting water sample and then collected samples were transported to laboratory within 24 hrs. As pretreatment, water samples were filtered with CF/C filter paper in the lab. The filter papers were kept frozen, and homogenized at the time of chlorophyll-a analysis. Lorenzen’s (1967)
method was used to calculate chlorophyll-a concentration.
Filtered water was then used to calculate dissolved nitrogen and phosphorus. TP was determined according to standard methods (APHA, 1992), employing persulfate digestion and ascorbic acid method. TN was determined by the cadmium reduction method after persulfate digestion, using a flow in- jection auto-analyzer (BRAN-LUEBBE, Auto Analyzer3).
Potassium permanganate alkaline method is used to deter- mine COD (APHA, 1992). Temperature, salinity, pH and DO were measured with a multi-probe meter (YSI, 6000).
The non-parametric correlation and trend test methods were performed for statistical analysis in SPSS software (IBM Corporation, Armonk, NY, USA).
1. spearman rank-order correlation
Spearman rank-order correlation is a nonparametric mea- sure of association based on the ranks of the data values.
The formula is
∑
i(R
i- R)(S
i- S) r=--- ∑
i(R
i- R)
2∑
i(S
i- S)
2Where R
iis the rank of x
i, S
iis the rank of y
i, R is the mean of the R
ivalues, and S is the mean of the S
ivalues.
Probability values for the Spearman correlation are com- puted by treating
r
21/2
t=(n-2)
1/2( --- )
1-r
2Fig. 1. Map of Lake Youngrang and monitoring sites. The geo-
graphic coordinates of the study area are Latitude 38°12ʹ 55ʺN Longitude 128°35ʹ03ʺE.
Fig. 2. Time series of monthly rainfall in Sokcho city from 1995~
2015.
Rainfall(mm)
1996 1998 2000 2002 2004 2006 2008 2010 2012 2014 Year
700 600 500 400 300 200 100 0
as coming from a t distribution with n-2 degrees of free- dom, where r is the sample Spearman correlation.
2. sen’s slope estimator
Sen (1968) slope method is given below, Linear model: f(t)=Q(t)+B
where, Q is slope and B is constant.
Estimate of the slope Q, the slopes of all data pairs are calculated
x
j- x
kQ
i=---, i=1,2,…N, j > k j-k
If there are n values x
jin the time series we get as many as N=n(n-1)/2 slope estimates Q
i.
The Sen’s slope estimator of the slope is the median of these N values of Q
i. The N values of Q
iare ranked from the smallest to the largest and the Sen’s estimator is
Q
N+1--- 2IF N is odd Q= { --- --- Q
N2+ Q
N+2--- 2IF N is even Confidence level,
C
α= Z
1-α-2VAR(S), Where,
VAR(S)= -
118[N(N-1)(2N+5)-∑
qp=1t
p(t
p- 1)(2t
p+ 5)]
Where q is the number of tied groups, t
pis the number of data values in the p
thgroup.
Next, M
1= (N-C
α) /2 and M
2= (N+C
α) /2.
The lower and upper limits of the confidence interval, Q
minand Q
max, are the M
1thlargest and the (M
2+1)
thlargest of the N ordered slope estimates Q
i.
3. Mann-Kendall test
The M-K test (Mann, 1945; Kendall, 1975) statistic S is calculated using the formula:
n-1 n
S= ∑
k=1∑
j=k+1sign(x
j- x
k)
+1 if x
j- x
k> 0 sign(x
j- x
k)= { 0 if x
j- x
k=0
-1 if x
j- x
k< 0
Where x
jand x
kare the annual values in years and j and k,j j > k, respectively.
The standard test statistic Z is computed as follows S-1
--- if S > 0 VAR(S) Z= { 0 if S=0 S+1
--- if S < 0 VAR(S)
Var(S) is given in Sen’s slope test.
The presence of a statistically significant trend is eval- uated using the Z values. A positive (negative) value of Z indicates an upward (downward) trend.
Trophic State Index (TSI) was calculated according to Carlson (1977). Below are the formulas:
TSI(P)=14.42*lnTP+4.15 TSI(Chl.a)=9.81*lnChl.a+30.6 TSI(SD)=60-14.41*lnSD
Where, TP and Chl.a are in μg L
-1and SD is in meters TSI=Carlson’s trophic state index and ln, natural loga- rithm.
resuLts
Physicochemical surface water quality variations were presented as total (Table 1), rainy period (Table 3) and non- rainy period (Table 5) and time series data along with slope was presented in Fig. 3. The mean water temperature in the lagoon of the total data was 18.3°C (range; 4.6~30.4°C).
Rainy period was of typical of Korean summer with mean 24.8°C (range; 20.6~30.4°C) and non-rainy period was of cool to mild-hot with mean 14.2°C (range; 4.6~23.7°C).
The mean value of SD was 0.9 m of total and ranges of SD
in rainy and non-rainy were 0.3~2.7 m and 0.4~1.8 m, res-
pectively. Salinity in Lake Youngrang varied from 0.4~32.3
psu with mean value 10.3 psu. As shown in time series plot
(Fig. 3), there was significant rise in salinity onward year
2007, while before that it was similar about 2 psu. Salinity
of non-rainy period was noted higher than the rainy period
with averages 9 psu and 11.1 psu, respectively. DO was
recorded as average of 10.3 mg L
-1with maximum 20.1 mg
table 1. Descriptive statistics of water quality parameters in Lake Youngrang (1998~2015).
Variable Maximum Minimum Mean Standard deviation Observations
Temp SD Sal DO COD SS TP DIP TN NO
3-N NH
3-N Chl-a
30.4 2.7 32.3 20.1 19.7 134.0 0.22 0.05 2.72 1.32 1.07 184.0
4.6 0.3 0.4 4.8 1.7 3.5 0.01 0.00 0.09 0.00 0.01 1.9
18.3 0.9 10.3 10.3 5.4 22.5 0.07 0.01 1.33 0.34 0.21 34.0
7.1 0.5 9.7 2.8 3.2 26.5 0.05 0.01 0.61 0.32 0.24 40.4
64 64 64 64 64 64 64 64 64 64 64 64
Temp, water temperature(°C); SD, Sechhi depth(m); Sal, Salinity(psu); DO, dissolved oxygen(mgL-1); COD, chemical oxygen demand(mgL-1); SS, suspended solids (mgL-1); TP, total phosphorus(mgL-1); DIP, dissolved inorganic phosphorus(mgL-1); TN, total nitrogen(mgL-1); NO3-N, nitrate nitrogen(mgL-1); NH3-N, ammonia nitrogen(mgL-1) and Chl-a, chlorophyll-a(mgm-3).table 2. Spearman’s rank correlation coefficients and p-values of water quality variables in Lake Youngrang.
Spearman Correlation Coefficients of total data (1998~2015), N=64 Prob
>|r| under H0: Rho=0
SD Sal DO COD SS TP DIP TN NO
3-N NH
3-N Chl-a
Temp SD Sal DO COD SS TP DIP TN NO
3-N NH
3-N
0.052 -0.122
0.458*** -0.205 -0.423**
-0.416**
-0.119 -0.415**
-0.253*
0.321**
-0.216 -0.062 0.449**
- 0.105 0.204
-0.204 -0.564***
-0.102 0.236 0.323**
0.066
0.053 -0.258 0.032 - 0.097 -0.047 -0.059 0.392**
-0.398**
-0.564***
-0.368*
0.411**
0.381**
-0.044 0.576***
0.281*
-0.352**
-0.307 -0.512***
0.255 0.149 -0.146 0.091 0.037 0.518***
-0.494***
0.021 -0.141 0.156 0.133 -0.047 0.104 - 0.039 0.414**
0.321**
-0.104 -0.649***
-0.295*
0.413**
0.597***
0.181 0.386**
0.037 0.441**
0.198 0.030
Singnificance level(α)=0.05, two-tailed.***p<0.0001, **p<0.01 and *p<0.05, bold, significantly correlated.
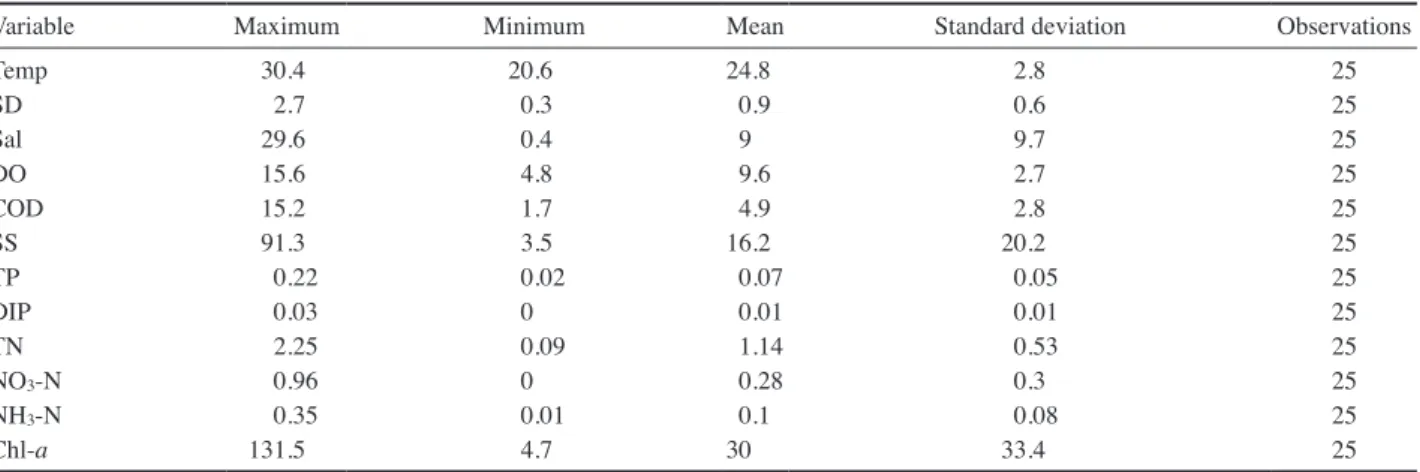
table 3. Descriptive statistics of water quality variables in Lake Youngrang of rainy period (June~August of 1998~2015).
Variable Maximum Minimum Mean Standard deviation Observations
Temp SD Sal DO COD SS TP DIP TN NO
3-N NH
3-N Chl-a
30.4 2.7 29.6 15.6 15.2 91.3 0.22 0.03 2.25 0.96 0.35 131.5
20.6 0.3 0.4 4.8 1.7 3.5 0.02 0 0.09 0 0.01 4.7
24.8 0.9 9 9.6 4.9 16.2 0.07 0.01 1.14 0.28 0.1 30
2.8 0.6 9.7 2.7 2.8 20.2 0.05 0.01 0.53 0.3 0.08 33.4
25 25
25 25
25 25
25 25
25 25
25 25
L
-1and minimum 4.8 mg L
-1. The average value of DO in rainy was 9.6 mg L
-1and non-rainy was 10.8 mg L
-1. The values of DO were observed higher in the non-rainy period than the rainy period. COD average concentrations in rainy period and non-rainy were observed as 4.9 mg L
-1and 5.4 mg L
-1, respectively. The SS mean concentration of the total data was 22.5 mg L
-1(range; 3.5~134.0 mg L
-1). The mean SS value of non-rainy period (26.6 mg L
-1) was higher than the mean SS value of rainy period (16.2 mg L
-1).
Nutrients factors, phosphorus and nitrogen components during the non-rainy period were observed higher than the rainy period. Among the phosphorus components average TP mean values were very similar in both periods. The mean TP values of rainy and non-rainy were 0.07 mg L
-1and 0.08 mg L
-1, respectively. Nitrogen components of lagoon TN,
NO
3-N and NH
3-N mean values were detected as 1.44, 0.37 and 0.28 in rainy and 1.14, 0.28 and 0.10 in non-rainy of mg L
-1. The higher values of nitrogen components mea- surements were seen during the non-rainy season than the rainy season. The lowest Chl-a concentration was detected toward 2014~2015. The mean values of Chl-a in rainy and non-rainy were 30 mg m
-3and 36.5 m
-3in the ranges of 4.7~
131.5 mg m
-3and 1.8~184.0 mg m
-3, respectively. Overall Chl-a mean value was 34 mg m
-3.
Box and whiskers plots of water quality parameters show- ing temporal variations were presented in Fig. 4a, b. The median values of temperature, DIP and Chl-a in rainy pe- riod were higher than the median of non-rainy period. But the reverse trend was observed for other parameters (Fig. 4.
a, b). Non-parametric statistical tests were performed since table 5. Descriptive statistics of water quality variables in Lake Youngrang of non-rainy data (March~May and Sept.~Nov. of 1998~2015).
Variable Maximum Minimum Mean Standard deviation Observations
Temp SD Sal DO COD SS TP DIP TN NO
3-N NH
3-N Chl-a
23.7 1.8 32.3 20.1 19.7 134 0.19 0.05 2.72 1.32 1.07 184
4.6 0.4 0.9 5.2 2.4 4.4 0.01 0 0.22 0 0.01 1.9
14.2 0.8 11.1 10.8 5.7 26.6 0.08 0.01 1.44 0.37 0.28 36.5
5.7 0.4 9.8 2.8 3.4 29.4 0.05 0.01 0.64 0.33 0.28 44.5
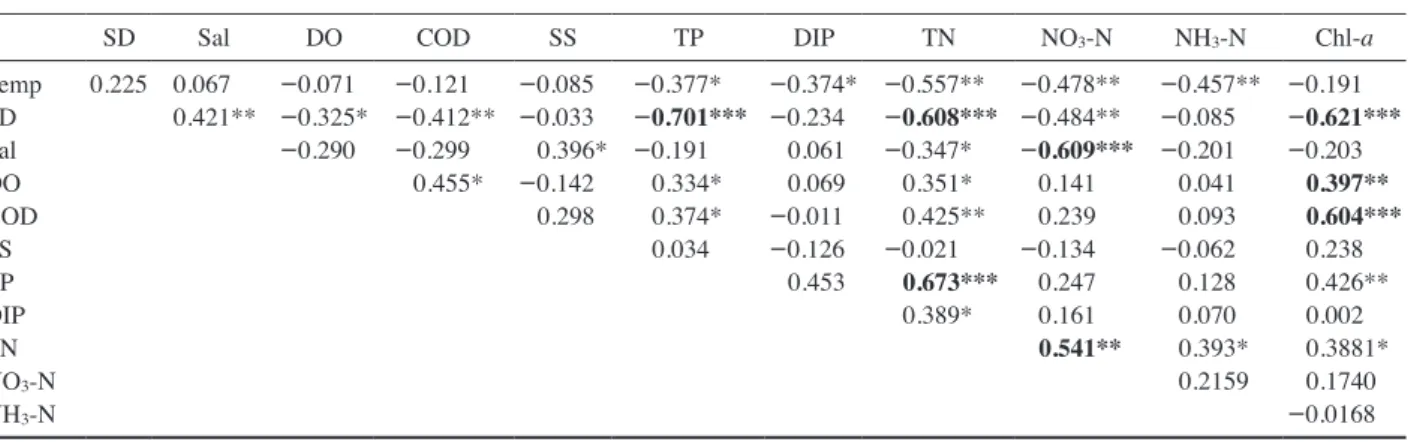
39 39 39 39 39 39 39 39 39 39 39 39 table 4. Spearman’s rank correlation coefficients and p-values of water quality variables in Lake Youngrang.
Spearman Correlation Coefficients of rainy period (June~August of 1998~2015), N=25 Prob
>|r| under H0: Rho=0
SD Sal DO COD SS TP DIP TN NO
3-N NH
3-N Chl-a
Temp SD Sal DO COD SS TP DIP TN NO
3-N NH
3-N
-0.165 0.043
0.565** -0.039 -0.630**
- 0.735***
-0.062 -0.454*
-0.247 0.124
0.186 -0.071 0.439*
-0.210 0.024
0.266 -0.408*
-0.041 0.009 0.235 0.026
0.198 -0.269 0.137 -0.289 0.034 0.189 0.430*
0.004 -0.483*
-0.507**
0.412*
0.207 -0.292 0.313 0.257
-0.272 -0.161 -0.452*
0.374 -0.017 -0.175 -0.154 -0.096 0.466*
-0.157 0.186 -0.323 0.082 0.074 -0.445*
-0.043 -0.030 0.386*
0.364
-0.168 -0.712***
-0.433*
0.474**
0.579**
0.095 0.326 0.138 0.481*
0.249 0.109
Singnificance level(α)=0.05, two-tailed.***p<0.0001, **p<0.01 and *p<0.05, bold, significantly correlated.
there were several outliers.
Spearman’s rank correlation coefficients (p < 0.05, two- tailed) were calculated for three data sets, total, rainy and non-rainy and were presented in Tables 2, 4 and 6. The result
showed that there was significant increase in SD along with
salinity, with correlation coefficient 0.0458. SD is negative-
ly correlated with COD, DO, TP, TN and Chl-a. SD and
Chl-a had significantly negative correlations in each data
Fig. 3. Plot of time series data of Lake Youngrang with slope b of linear regression, y=a+bx.
set. SD correlations values with salinity in rainy and non- rainy were positive, as 0.566 and 0.421, respectively. SD showed highly significant negative correlations with Chl-a of rainy and TP of non-rainy with correlation coefficients as -0.712 and -0.702, respectively. Nutrient components and Chl-a were positively correlated with COD. TSI index- es were presented in Table 7, and were in the range of the lowest 37 to the highest 82.
Depth profiles for four different periods, 1998~1999, 2004~2005, 2008~2009 and 2014~2015 were chosen for interpretation with water parameters Temperature, Salinity, DO and pH (Fig. 5a~d). Chemocline; well mixed layer, could be observed in all periods at 2~4 meter in the months of June to October when the warmer water of epilimnion sits on top of cooler water in hypolimnion causing oxygen deficiency at the bottom layer of lake. Hypoxia in 2008~
2009 period was very severe than the other three periods.
The hypoxia in 1998 and 1999 were next larger than the rest two. Period 2014~2015 observed the least.
Mann-Kendall trend test and Sen’s slope were obtained using SPSS (IBM Corporation, Armonk, NY, USA) and were presented in Table 8. Kendall’s tau values for SD and
Salinity were significantly positive with 0.399 and 0.553, respectively (p < 0.0001, α=0.05, two-tailed). Notable neg- ative values of Kendall’s tau were observed for TN, NO
3-N and Chl-a. Overall, temperature, COD, TP and DIP showed no trend. Decreasing trends were observed for DO, nitrogen components and Chl-a and increasing trends were observed for SD, Salinity and SS.
dIscussIon
Lake Youngrang surface water temperature showed slight increment throughout the monitoring period. Water temper- ature is taken as an important factor to run physicochemical and biological functions of water body (Jayakumar et al., 2013). The SD of this lagoon showed slight increment as the year progresses. The highest value of SD was detected in 2014~2015. SD of the lagoon was highly influenced by salinity and nutrient components and Chl-a which were shown in correlation charts (Tables 2, 4 and 6). Water in- flow and outflow in lagoon plays important role to control suspended solids, as river inflow, inflow form watershed, tides and winds are the key players (Roselli et al., 2009).
table 6. Spearman's rank correlation coefficients and p-values of water quality variables in Lake Youngrang.
Spearman Correlation Coefficients of non-rainy (March~May and Sept.~Nov. of 1998~2015) period, N=39 Prob
>| r | under H0: Rho=0
SD Sal DO COD SS TP DIP TN NO
3-N NH
3-N Chl-a
Temp SD Sal DO COD SS TP DIP TN NO
3-N NH
3-N
0.225 0.067
0.421** -0.071 -0.325*
-0.290
-0.121 -0.412**
-0.299 0.455*
-0.085 -0.033 0.396*
-0.142 0.298
-0.377*
-0.701***
-0.191 0.334*
0.374*
0.034
-0.374*
-0.234 0.061 0.069 -0.011 -0.126 0.453
-0.557**
-0.608***
-0.347*
0.351*
0.425**
-0.021 0.673***
0.389*
-0.478**
-0.484**
- 0.609***
0.141 0.239 -0.134 0.247 0.161 0.541**
-0.457**
-0.085 -0.201 0.041 0.093 -0.062 0.128 0.070 0.393*
0.2159
-0.191 -0.621***
-0.203 0.397**
0.604***
0.238 0.426**
0.002 0.3881*
0.1740 -0.0168
Singnificance level(α)=0.05, two-tailed.***p<0.0001, **p<0.01 and *p<0.05, bold, significantly correlated.
table 7. Carlson’s trophic state indexes in Lake Youngrang.
Trophic state index Total data Rainy data Non-rainy data
TSI(SD) TSI(P) TSI(Chl-a)
46~80 37~82 39~82
46~80 46~78 46~82
51~74
37~82
39~80
Salinity of Lake Youngrang was highly increased after year 2006. This increase was related to the restoration activity as mentioned in Sokcho city report in year 2013. The higher salinity fluctuation indicates an increase in water flux be-
tween the lagoon and the ocean with internal circulation throughout the lagoon. Sand removal from channel, connect- ing lagoon to eastern sea, and construction of dyke eased the water movement from sea and reduced sand accumula- Fig. 4(a). Box plots of water quality parameters. A line is drawn across the box at the median. The bottom of each box is at the first quartile (Q
1), and the top is at the third quartile (Q
3) value. The whiskers are the lines that extend from the top and bottom of the box to the adjacent values. The adjacent values are the lowest and highest observations that are still inside the region defined by the fol- lowing limits: Lower Limit: Q
1- 1.5(Q
3- Q
1). Upper Limit: Q
3+1.5(Q
3- Q
1). Outliers are points outside of the lower and upper limits and are plotted with dots (●).
Temp(℃)Salinity(psu)COD(mgL-1 ) SD(m)DO(mgL-1)SS(mgL-1)
Total Rainy Non-rainy Data period
Total Rainy Non-rainy Data period
35 30 25 20 15 10 5 0 35 30 25 20 15 10 5 0 22 20 18 16 14 12 10 8 6 4 2 0
3.0 2.5 2.0 1.5 1.0 0.5
0.0 25 20 15 10 5
0
160 140 120 100 80 60 40 20 0
tion at the channel. Salinity is a very influencing factor in lagoon (Jayaraman et al., 2007; Kim et al., 2016). Sea level rises could play a role in salinity as well (Rizzeteo and Tosi, 2012). Natural and anthropogenic factors have significant influence to control salinity by controlling the flow from stream and ocean (Dailidienė and Davulienė, 2008; Giskes et al., 2013; Tulipani et al., 2014). The average DO was low during summer monsoon period and lowest value was
recorded in rainy period too. Phytoplankton activities during spring and fall could be the reason of higher DO during non- rainy period and also added by wind and tidal circulation.
SS loading is mainly related to run-off with high load of solids and wastes from non-point sources of pollution like agricultural fields, open lands, and domestic areas (Gazzaz et al., 2012; Trabelsi et al., 2013). Suspended solid increased significantly during the rainy period which is a concern for Fig. 4(a). Continued.
TP(mgL-1)TN(mgL-1 )NH3-N(mgL-1 ) DIP(mgL-1) NO3-N(mgL-1)Chl-a(mgL-1 )
Total Rainy Non-rainy Data period
Total Rainy Non-rainy Data period
0.25 0.20 0.15 0.10 0.05
0.00 3.0 2.5 2.0 1.5 1.0 0.5
0.0 1.2 1.0 0.8 0.6 0.4 0.2 0.0
0.06 0.05 0.04 0.03 0.02 0.01
0.00 1.4 1.2 1.0 0.8 0.6 0.4 0.2
0.0 200 150
100 50 0
Fig. 5(a). Depth profile of water quality parameters in Lake Youngrang for four different periods (a: 1998~2000; b: 2004~2005, c:
2008~2009; d: 2014~2015).
Fig. 5(b). Continued.
Fig. 5(c). Continued.
Fig. 5(d). Continued.
management. Chemical oxygen demand and nitrate nitrogen are indicators of organic pollution and relate essentially to anthropogenic point sources like domestic sewage, waste- water treatment plants, and industrial facilities. The other sources of nitrates are agricultural areas where inorganic ni- trogen fertilizers are usually applied. The human activities in the lake surrounding have a great localized effect on water chemistry and nutrient loads and land uses had a significant impact on the hydrology system of water body and water quality (Lapido et al., 2011; Magyar et al., 2013;
Limoges et al., 2015; Marthe et al., 2015). Sedimentation of nutrients and their release due to suspension and re-sus- pension also plays important role (Conley et al., 1997;
Schallenberg et al., 2010; Zaaboub et al., 2014; Zirono et al., 2016). The decreasing trend of nitrogen nutrients was observed in the study. In the case of Chl-a, the trend was downward with sen’s slope -0.346 but still eutrophication is noticeable. Trophic equilibrium of the ecosystem could be affected by the accumulation of organic matter in the bottom of lake (Frascari et al., 2002; Christia et al., 2014).
Because of these nutrients, excess oxygen is required and releases the amount of carbon dioxide to cause serious dystrophy. The chemocline zone divides the hypoxia zones from the upper zone where photosynthesis occurs. Several cases of fish kill were recorded by Sokcho city which could be related to the nutrient pollution (Sokcho city, unpublished data). In 2006, 246 individuals of fish kill were observed from September to December, most probably related to nutrient pollution. Winter fish kill of 25 individuals of carp
fish were reported in January of 2007. In 2008, more than ten thousand fish kill were reported in the months of July (8,000 individuals) and September (6,000 individuals) due to blockage of sea water. Tens of thousands individual fish kill was occurred in October of 2011. This particular epi- sode was related to proliferation of ammonia from benthic zone sediment due to gales which created hypoxia. Despite the conservation efforts in Lake Youngrang, trophic state of lagoon is not decreasing. Internal and external loading of nutrients are the big factors to be considered to achieve the sustainable water environment of the lagoon. Reclamation of water body through dredging and enhancing water cir- culation could be the long term goals (Markou et al., 2007;
Perilla et al., 2012; Acquavita et al., 2015).
The changes in water quality of Lake Youngrang in 17 years were demonstrated. The results give us a better under- standing of temporal lagoon water quality variations thro ugh physicochemical properties analyses. Though reduction in nutrient variations and increase in salinity were observed, eutrophication of lake is still a serious concern. Watershed management of Lake Youngrang considering sustainable development could be the step toward healthy environment of lagoon.
concLusIons
Salinity had increased significantly due to better water circulation with sea by sand removal from the channel and table 8. Results of Mann-Kendall tests and Sen’s slope of water quality variables in Lake Youngrang (1994~2015).
Mann-Kendall trend tests Sen’s slope estimator
Trend
Kendall’s tau p-value Sen’s slope Confidence interval
Temp SD Sal DO COD SS TP DIP TN NO
3-N NH
3-N Chl-a
0.004 0.399 0.553 -0.265 -0.149 0.210 -0.162 -0.079 -0.427 -0.333 -0.182 -0.281
0.9680
<
0.0001
<
0.0001 0.002 0.8300 0.0140 0.0600 0.3600
<
0.0001 0.0000 0.0340 0.0010
0.002 0.012 0.385 -0.052 -0.024 0.157 -4.257E-4 -3.113E-5 -0.02 -0.007 -0.002 -0.346
-2.199 -0.080 -0.624 -0.768 -0.770 -4.051 -0.014 -0.002 -0.169 -0.079 -0.062 -10.168
2.259 0.121 1.730 0.720 0.694 5.637 0.011 0.002 0.119 0.081 0.045 7.779
O P N P O P O O N N N N
Significance level alpha=0.05; two-tailed.Trend: O, No trend; P, Positive trend and N, negative trend.