343
ABBREVIATIONS: AA, arachidonic acid; CLP, collagen-like polymer;
MDA, malondialdehyde; PGE
2,prostaglandin E
2; ROS, reactive oxygen species.
Corresponding to: Sang Soo Sim, Department of Pathophysiology, College of Pharmacy, Chung-Ang University, 221, Huksuk-dong, Dongjak-gu, Seoul 156-756, Korea. (Tel) 82-2-820-5615, (Fax) 82-2-821-7680, (E-mail) [email protected]
The Effect of Caffeic Acid on Wound Healing in Skin-incised Mice
Ho Sun Song
1, Tae Wook Park
1, Uy Dong Sohn
2, Yong Kyoo Shin
3, Byung Chul Choi
1, Chang Jong Kim
1, and Sang Soo Sim
1Departments of
1Pathophysiology and
2Pharmacology, College of Pharmacy,
3Department of Pharmacology, College of Medicine, Chung-Ang University, Seoul 156-756, Korea
This study was carried out to investigate the wound healing effect of caffeic acid in skin-incised mice. Caffeic acid showed significant effects on anti-inflammatory activity and wound healing, such as myeloperoxidase activity, lipid peroxidation, phospholipase A
2activity and collagen-like polymer synthesis, in incised-wound tissue. On the other hand, it significantly stimulated collagen-like polymer synthesis in NIH 3T3 fibroblast cells, while inhibited both silica-induced reactive oxygen species generation and melittin-induced arachidonic acid release and PGE
2production in Raw 264.7 cells, and histamine release in RBL 2H3 cells stimulated by melittin or arachidonic acid. Therefore, caffeic acid appears to have a potent antioxidant and anti-inflammatory effect in cell culture system, which may be related to wound healing in skin-incised mice.
Key Words: Caffeic acid, Histamine, Arachidonic acid, Collagen, Wound healing
INTRODUCTION
Wound healing involves a variety of processes such as acute inflammation, cell proliferation and contraction of the collagen lattice formed (Bodeker & Hughes, 1996). Several types of cells are recruited to the site of injury to carry out the processes of repair. Following neutrophils and mon- ocytes, fibroblasts are attracted to the site to initiate the proliferative phase of repair. Fibroblasts secrete collagens and glycosaminoglycans of new granulation tissue, sub- sequently affecting the remodeling of granulation tissue in- to mature dermis (Clark, 1993). It has been shown that in- creasing the number of fibroblasts in an artificial dermal substitutes leads to improved healing in experimental wounds (Lamme et al, 2000).
However, the healing process may be prevented by the presence of ROS or microbial infection, since the type of cells to be first recruited to the site of injury is the neu- trophil which has a role in anti-microbial defense and the production of ROS. ROS (Reactive oxygen species) are pro- duced in response to cutaneous injury (Gupta et al, 2002) and may cause cellular damage by peroxidation of mem- brane lipids, inactivation of sulphydryl enzymes, cross-link- ing of proteins and breakdown of DNA (Russo et al, 2002).
These observations suggest that improving local anti- oxidant activity might be beneficial to healing outcome (James et al, 2001).
Many antioxidants such as vitamin E and plant extracts are used to eliminate the negative effects of ROS on wound healing (Suguna et al, 2002). Caffeic acid is an active com- ponent of honeybee propolis (Sudina et al, 1993), and has
been shown to have anti-inflammatory, immunomodulatory and antioxidant effects and also to suppress lipid perox- idation (Pascual et al, 1994; Natarajan et al, 1996).
Although caffeic acid has antioxidant effects, its effect on cutaneous wound healing has not yet been investigated.
Therefore, the aim of the present study was to investigate the effect of caffeic acid on dermal wound healing in mice.
METHODS Materials
[
3H]arachidonic acid and enzyme-linked immunosorbent assay (ELISA) kit for the determination of prostaglandin E
2(PGE
2) was provided by Amersham Pharmacia (Piscata- way, NJ, USA), and 1-palmytoyl-2-(10-pyrendecanoyl) - sn-glycero-3-phosphorylcholine (10-pyren PC) was from Molecular Probes (Eugene, OR, USA). Caffeic acid and oth- er reagents were purchased from Sigma Chemical Co.
(USA).
Animals
Six-week-old BALB/c male mice, weighting 24 to 31 g,
were purchased from HanLim Animal (Hwasung-gun,
Gyunggi-do, Korea), and were housed in a normal environ-
mentally controlled animal room (temperature 24±2
oC, hu-
midity 50±5%, illumination 300∼500 Lux). Animal proto-
cols were approved by the ethics committee for care and
use of laboratory animals at Chung-Ang University. The
animals were anaesthetized with xylazine hydrochloride (2
∼5 mg/kg) and ketamine hydrochloride (40∼50 mg/kg).
Their backs were shaved and cleaned with poly- vidone-iodine. A linear full-thickness incision of 20 mm in length was made on the back of each mouse and sutured with 4/0 atraumatic silk suture under sterile conditions.
The animals were randomly divided into two groups of equal number. Caffeic acid was suspended in 1% carbox- ymethyl cellulose, and further dilutions were made with saline. After incision, caffeic acid (10 mg/kg) was orally ad- ministered to the treatment group (n=15), while 1% carbox- ymethyl cellulose in equal volume was orally administered to the control group (n=15). Caffeic acid and saline were administered once daily during the study period. On days 5, 10 and 15, five animals in each group were randomly selected and killed with the same anaesthetic solution.
Zones of about 1mm in thickness were taken from the edges of the wounds for biochemical analysis.
Malondialdehyde assay
Malondialdehyde (MDA) level was assessed as an index of lipid peroxidation according to the slightly modified method of Gan et al. (2006). Briefly, reaction substrate con- sisting of 0.1 ml of 8.1% sodium dodecylsulfate, 0.8 ml of acetic acid buffer, 0.8 ml of 0.8% thiobarbituric acid and 0.2 ml of distilled water was added to 0.1 ml of each sample and tetraethoxypropane as standard. Then, all reaction mixtures were incubated at 100
oC for 1 h. After cooling on ice-water, 2 ml of n-butyl alcohol was added into the re- action mixtures, and samples were centrifuged for 10 min at 3,000×g. The absorbance of organic layer was measured at 532 nm and results were expressed as μg/mg protein.
Protein concentration was measured by the bicinchoninic acid (BCA) method to correct the differences between prep- arations (Smith et al, 1987).
Myeloperoxidase assay
Tissue samples were assessed biochemically with the neutrophil marker enzyme, myeloperoxidase (MPO), using the method of Bradley et al. (1982). Dorsum tissues were thawed, weighted (50 mg) and homogenized in 10 volumes of ice-cold 80 mM sodium phosphate buffer (SPB), pH 5.4, containing 0.5% hexadecyl trimethyl ammonium bromide with a Polytron homogenizer (Art-Miccra D-8, Moderne ART Lab., Germany) 3 times for 30 sec each on ice. The supernatant (30 μl) was added to a 200 μl of reaction mix- ture containing 100 μl of 80 mM SPB (pH 5.4), 85 μl of 0.22 M SPB (pH 5.4), and 15 μl of 0.017% H
2O
2. The re- action started by the addition of 20 μl of 18.4 mM 3,3’,5,5’-tetramethyl benzidine in 8% aqueous N,N-dimethyl formamide. The mixture was incubated for 3 min at 37℃
and then placed on ice. The reaction was stopped by addi- tion of 30 μl of 1.46 M sodium acetate (pH 3.0). Enzyme activity was determined by measuring absorbance at 620 nm using a spectrophotometer (FL600 Microplate Reader, Bio-Tek, USA).
Collagen-like polymer assay
Collagen-like polymer (CLP) was assessed using the method of Yin et al (2002). Tissues or NIH 3T3 cells were homogenized in buffer (5 mM CaCl
2, 20 mM Tris-HCl, pH 7.5) and tissue debris was then removed by centrifugation at 12,000 rpm for 20 min. The supernatant (crude tissue
lysate) was collected. Crude tissue lysate was then treated at 80℃ for 10 min and centrifuged at 12,000 rpm for 20 min to remove the precipitated non-CLP proteins. The ab- sorbance was increased by the amino acids and peptides liberated from CLP when hydrolyzed by 300 U/ml collage- nase type III (Sigma C 0255). Absorbance was spectrophoto- metrically measured at 570 nm. The content of CLP in tis- sue was calculated as a μg/mg protein.
PLA
2assay with 10-pyren PC
PLA
2activity was measured using pyrene-labeled phos- pholipids (10-pyrene PC) (Radvanyi et al, 1989). Tissue ho- mogenate (20 μl) was incubated in the reaction mixture containing 50 mM Tris-HCl (pH 7.5), 100 mM NaCl, 1 mM EDTA , and 10 μl of 0.2 mM 10-pyren PC (2 μM final con- centration, 10 μl of 10% bovine serum albumin solution and 6 μl of 1 M CaCl
2for 20 min. The fluorescence was measured using excitation and emission wavelengths of 345 and 398 nm, respectively (FL600, Microplate Fluorescene Reader, Bio-Tek).
Cell culture
Raw 264.7 cells, RBL 2H3 cells and NIH 3T3 cells ob- tained from the Korean Cell Line Bank (Seoul, Korea) were cultured in DMEM supplemented with 10% heat-in- activated FBS and antibiotic-antimycotic (100 IU/ml pen- icillin G, 100 μg/ml of streptomycin and 0.25 μg/ml of am- photericin B) at 37
oC with 5% CO
2.
Measurement of ROS generation
The level of intracellular ROS was quantified by fluo- rescence with DCF-DA. Raw 264.7 cells were suspended in 20 ml of Krebs buffer [137 mM NaCl, 2.7 mM KCl, 0.4 mM Na
2HPO
4, 0.5 mM MgCl
2, 10 mM HEPES (pH 7.4), 1.8 mM CaCl
2, 5 mM glucose] and incubated with 20 μM DCF-DA for 1 h at 37
oC. The cells were washed twice with Krebs buffer and were suspended in Krebs buffer at the density of 10
6cells/ml. The cells were incubated with caffeic acid for 10 min, and ROS generation was then induced by 1 mg/ml silica for 30 min at 37
oC. The fluorescence intensity was measured using excitation and emission wavelengths of 485 and 535 nm, respectively. (Boland et al, 2000).
Values were expressed as percentage of fluorescence in control.
Measurement of [
3H]AA release
Raw 264.7 cells were harvested with Krebs buffer and labeled with [
3H]AA (0.4 μCi/ml) at 37
oC for 2 h. The cells were washed with Krebs buffer containing 0.5 mg/ml BSA to trap the [
3H]AA liberated. The release of AA was induced by 0.5 μM melittin in the presence or absence of caffeic acid for 30 min. After centrifugation, the supernatant and pellet were transferred to liquid scintillation vial for radio- activity measurement by liquid scintillation counter (Balboa et al, 1999). Percent release of [
3H]AA = super- natant/(supernatant+pellet)×100
Measurement of prostaglandin E
2Total amount of cellular prostaglandin E
2in Raw 264.7
cells which were stimulated with melittin was assayed us-
Control Caffeic acid
* *
0 3 6 9 12
Lipid peroxidation (μg/mg protein) PLA2 (μmol/min/mg protein)
*
0 5 10 15 20 25
*
0 20 40 60 80 100
Normal 5 10 15
Days after skin incision
Myeloperoxidase (mU/mg protein)
* *
0 50 100 150 200 250
Normal 5 10 15
Days after skin incision Collagen like polymer (μg/mg protein)
A
C D
B
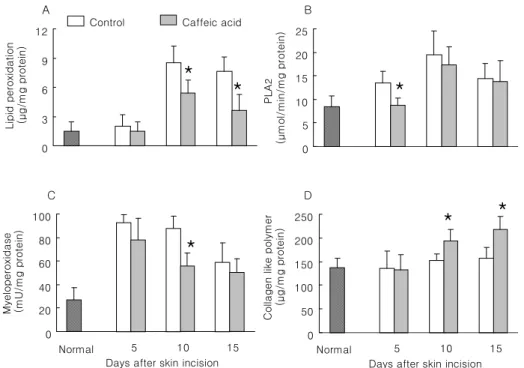
Fig. 1. Effect of caffeic acid on wound healing in skin-incised mice. Two cm long incision wound perforating the skin was made on the dorsal skin of mice. Mice were orally treated daily with 1% carboxymethyl cellulose solution (CMC; Control) and 10 mg/kg caffeic acid in 1% CMC solution during the study period. On days 5, 10 and 15, zones of about 1mm in thickness were taken from the edges of the wounds for biochemical analysis, such as lipid peroxidation (A), phospho- lipase A
2(B), myeloperoxidase (C) and collagen-like polymer (D). Results are means±SD from 5 mice. *Significantly different from control (p<0.05).
0 50 100 150 200
Control 0.1 1 10 100
Caffeic acid (μM) Co lla g en l ik e p o ly m e r (μ g /mg p ro tei n )
*
* *
*
Fig. 2. Effect of caffeic acid on collagen-like polymer production in NIH 3T3 cells. NIH 3T3 cells were incubated with caffeic acid at 37
oC for 48 h. Control was the cells treated with 1% DMSO. Results are means±SD from 5 separate experiments. *Significantly diffe- rent from control (p<0.05).
ing an enzyme immunoassay protocol provided by Amersham Pharmacia Biotech and expressed as ng/mg protein. Protein concentration was measured by the BCA method to correct for differences between preparations.
Histamine assay
RBL-2H3 cells were treated with caffeic acid for 10 min, and then histamine release was induced by melittin and arachidonic acid for 30 min at 37
oC. The histamine released was assayed using the fluorometric method (Shore et al, 1959). After centrifugation, histamine contents in both su- pernatant and pellet were measured with 0.1 ml of 1%
o-phthaldialdehyde in methanol. The fluorescence intensity was measured using excitation and emission wavelengths of 355 and 455 nm, respectively. Data are expressed as % release (histamine contents in supernatant / histamine con- tents in supernatant and pellet×100).
Data analysis
The results are represented as means±S.D. and analyzed statistically by analysis of variance (ANOVA), and differ- ences between groups were determined with Newman- Keuls test. The level of significance was set at less than 5%.
RESULTS Wound healing effect of caffeic acid
There was a progressive increase in the level of lipid per- oxidation in skin-incised tissue on day 10 and showed a slight decrease on day 15 (Fig. 1A). Caffeic acid was shown to significantly reduce tissue lipid peroxidation levels on days 10 and 15 as compared with control. The change of phospholipase A
2activity in the skin-incised tissue was
similar to that of lipid peroxidation. PLA
2activity of caffeic acid-treated group showed a significant difference on day 5 as compared with control (Fig. 1B).
After wounding, several types of cells, such as neu- trophils, monocytes and fibroblasts, are recruited into the site of injury to carry out the repair processes. Therefore, myeloperoxidase activity was used to determine the recruit- ment of neutrophils into injury site. Fig. 1C shows that myeloperoxidse activity in incised-skin showed a peak level on day 5 and gradually declined to the basal level on day 15. Caffeic acid significantly reduced myeloperoxidse activ- ity on day 10 (Fig. 1C) and progressively increased colla- gen-like polymer levels with a significant difference on days 10 and 15 as compared with control (Fig. 1D).
In order to investigate the effect of caffeic acid on colla-
gen-like polymer synthesis, we next measured the amount
of collagen-like polymer in NIH 3T3 fibroblast cells. Caffeic
acid stimulated collagen-like polymer production, the peak
0 3 6 9 12 15
Control Melittin 10 30 100
Caffeic acid (μM)
% Release of AA
0 4 8 12 16 20
Melittin 10 30 100
Caffeic acid (μM)
PGE2 (ng/mg protein)
Control
*
*
* *
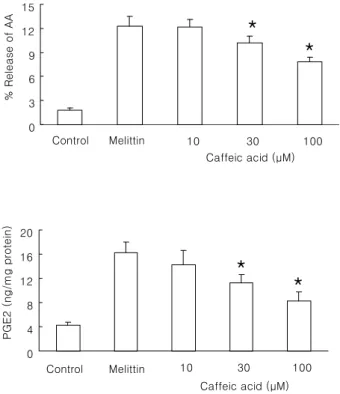
Fig. 4. Effect of caffeic acid on melittin-induced arachidonic acid release and PGE
2production in Raw 264.7 cells. The cells were stimulated with 0.5 μM melittin in the presence or absence of caffeic acid at 37
oC for 30 min. Control was treated with 1% DMSO in the absence of melittin. Intracellular amount of PGE
2was measured using PGE
2assay kit. Results are means±SD from 4 separate experiments. *Significantly different from control (p<0.05).
0 100 200 300 400
0 10 30 100
Caffeic acid (μM)
% Change of ROS
*
* *
Fig. 3. Effect of caffeic acid on reactive oxygen species (ROS) generation in Raw 264.7 cells. DCF-loaded Raw 264.7 cells were preincubated with caffeic acid and stimulated with 1 mg/ml silica at 37
oC for 30 min. Results are means±SD from 5 separate experiments. *Significantly different from control (p<0.05).
Melittin-induced histamine release
0 10 20 30 40 50 60
Control 0 10 30 100
Caffeic acid (μM)
% Release of histamine
AA-induced histamine release
0 20 40 60 80
Control 0 10 30 100
Caffeic acid (μM)
% Release of histamine