http://e-nrp.org
Factors associated with anemia among female adult vegetarians in Malaysia
Zi Fei Chai
1, Wan Ying Gan
1§, Yit Siew Chin
1,2, Yuan Kei Ching
1and Mahenderan Appukutty
31Department of Nutrition and Dietetics, Faculty of Medicine and Health Sciences, University Putra Malaysia, 43400 Serdang, Selangor Darul Ehsan, Malaysia
2Research Centre of Excellence for Nutrition and Non-Communicable Diseases, Faculty of Medicine and Health Sciences, University Putra Malaysia, 43400 Serdang, Selangor, Malaysia
3Sports Science Programme, Faculty of Sport Science and Recreation, University Teknologi MARA, 40450 Shah Alam, Selangor, Malaysia
BACKGROUND/OBJECTIVES: A large number of studies on anemia have focused mostly on pregnant women or children. The vegetarian population, which is another potential risk group for anemia, remains largely unexplored. Therefore, this cross-sectional study examined the associations of the sociodemographic, lifestyle, nutritional, and psychological factors with the anemia status among female adult vegetarians.
SUBJECTS/METHODS: A total of 177 female vegetarians were recruited from a Buddhist and Hindu organization in Selangor, Malaysia. The participants completed a self-administered questionnaire, which analyzed their sociodemographic characteristics, physical activity level, sleep quality, depression, anxiety, and stress. The body weight, height, waist circumference, and body fat percentage of the participants were also measured. A 3-day dietary recall was conducted to assess their dietary intake.
Blood samples (3 ml) were withdrawn by a nurse from each participant to determine the hemoglobin (Hb) level.
RESULTS: The findings revealed 28.2% of the participants to be anemic. The age group (AOR = 2.46, 95% CI = 1.19-5.05), marital status (AOR = 2.69, 95% CI = 1.27-5.71), and percentage of energy from protein (AOR = 5.52, 95% CI = 1.41-21.65) were the significant predictors of anemia.
CONCLUSIONS: Anemia is a public health problem among female vegetarians in this study. Health promotion programs that target female adult vegetarians should be conducted to manage and prevent anemia, particularly among those who are married, aged 50 and below, and with an inadequate protein intake.
Nutrition Research and Practice 2019;13(1):23-31; https://doi.org/10.4162/nrp.2019.13.1.23; pISSN 1976-1457 eISSN 2005-6168
Keywords: Anemia, hemoglobin, obesity, vegetarians, malaysia
INTRODUCTION
4)Tracing back to ancient Greece, vegetarianism has often been related to either ethics or health but has a checkered history among different religious doctrines, such as Buddhism, Hinduism, and Seventh Day Adventists [1]. On the other hand, it was only until the 19
thcentury that scientists began to assess the health advantages of a plant-based diet [2]. To date, several studies on the prevalence of vegetarians have revealed varying results. For example, the prevalence of vegetarianism was found to be much higher in India (36%) [3] than in other countries, such as the United Kingdom (UK; 5%) [4]. In light of the global epidemic of chronic diseases, the idea of an ‘ideal diet’, which also includes a vegetarian diet, has been pursued desperately with the aim of resolving the problem once and for all [5].
The vegetarian diet may have some health advantages but it does not necessarily equal an adequate balanced nutrient intake. Some debate still exists as to whether vegetarians, especially vegans, can derive an optimal amount of vital
nutrients, such as vitamins B
12and D, iron, calcium, and long- chain n-3 fatty acids [6]. In terms of bioavailability, the non-heme iron that can be obtained from grains, cereals, nuts, legumes, and vegetables in plant-based diets is inferior to heme iron in animal products because the human body can absorb heme iron more easily than non-heme iron [7]. Therefore, the iron status of vegetarians is a matter of concern considering that anemia is one of the commonest micronutrient deficiencies in the world [8].
The results from earlier studies have shown that more females adopt a vegetarian lifestyle than males [9, 10]. One possible explanation for this might be the greater health-consciousness and adherence towards less risk-taking behaviors and social life among women [11]. Nevertheless, females appear to be a high-risk group of individuals who are often diagnosed with anemia compared to males because of their physiological function in nature, particularly concerning their experience in iron losses during menstruation and pregnancy [12]. Further- more, hormone testosterone is responsible for raising the red
This research was funded by Putra Graduate Initiative (IPS) (Grant number: GP-IPS/2017/9533200) provided by University Putra Malaysia.
§Corresponding Author: Wan Ying Gan, Tel. 603-89472469, Fax. 603-8942676, Email. [email protected] Received: November 21, 2018, Revised: December 21, 2018, Accepted: January 15, 2018
This is an Open Access article distributed under the terms of the Creative Commons Attribution Non-Commercial License (http://creativecommons.org/licenses/by-nc/3.0/) which permits unrestricted non-commercial use, distribution, and reproduction in any medium, provided the original work is properly cited.
blood cell count, which stimulates erythropoietin (EPO) that helps boost the hemoglobin concentrations in adult men [13].
Therefore, females tend to be more vulnerable to anemia biologically.
Globally, half of anemia cases have been attributed to iron deficiency (ID) [8]. Moreover, the most affected group is non-pregnant reproductive women (estimated 468 million) [8].
Anemia is still growing and has been posed as a health threat even in developed countries, such as the United States (US) with a prevalence ranging from 4.0% to 7.0% between 2003-2004 and 2011-2012 [14]. In Malaysia, the National Health and Morbidity Survey (NHMS) 2015 reported that the prevalence of anemia among Malaysians was 24.6%, which can be divided into 35.5% and 14.3% of females and males, respectively [15]. Existing research recognizes a high prevalence of anemia among the vegetarian population. For example, a cross-sectional study was conducted among women aged 15 to 49 years in an urban slum from Mumbai, India who had been taking a mixed diet (47.4%), and the results showed that they were less anemic than those who were vegetarians (64.4%) [16].
Another cross-sectional study in Rajasthan, India showed that all of the female vegetarians were anemic [17].
The major health consequences of anemia, which include declined immunity, elevated morbidity, and impaired cognitive performance, are still regarded as a significant burden to the worldwide population [18]. In addition, the interactions between various potential etiologies have also made anemia mitigation extremely challenging. Anemia is not merely a medical condi- tion, but also an important social issue because it commonly leads to decreased work performance and insufficient earning.
Recent evidence indicates several factors associated with anemia among women, which include the demographic factors (age and marital status [19]), nutritional status (overweight/
obesity [20]), lifestyle factors (physical activity [21] and sleep quality [22]), and psychological factors (depression [23]). On the other hand, previous research examining the factors associated with anemia focused more on the non-vegetarian population.
Little is known about anemia in vegetarians. Therefore, it is important to understand the anemia status of Malaysian vege- tarians and its associated factors due to the increasing interest in vegetarianism among Southeast Asians. In response to this matter, the present study examined the factors associated with anemia among female vegetarians in Malaysia.
SUBJECTS AND METHODS
Study population and designThis cross-sectional study was conducted at a Buddhist and Hindu organization located in Selangor, Malaysia. Buddhists and Hindus were selected as the participants of this study because they are the main groups of vegetarians in Malaysia [24]. A convenience sampling method was used to recruit the participants by placing an advertisement on notice boards at these organizations. The exclusion criteria were pregnant or lactating women as well as those with chronic illnesses (such as diabetes mellitus, heart disease, kidney disease, and liver disease) or undergoing medical treatment.
Ethical clearance was granted from the Ethics Committee for
Research Involving Human Subjects of University Putra Malaysia (Reference No.: FPSK (FR16) P023). Permission to conduct this study at the Buddhist and Hindu organizations was also obtained, while written informed consent was obtained from all the participants prior to the process of data collection.
Sociodemographic, lifestyle, and psychological characteristics
A self-administered questionnaire was distributed to the participants to obtain information on their sociodemographic background, lifestyle, and psychological condition. Information on the participants, such as age, ethnicity, marital status, education level, household size, and household income, was included as the sociodemographic details.
The WHO Global Physical Activity Questionnaire (GPAQ) [25]
was administered to determine the level of physical activity of the participants. A total of 16 questions regarding physical activity (PA) were asked in the questionnaire. The first six items (i.e. Q1-Q6) measured the activity at work, whereas the next nine items (i.e. Q7-Q15) measured the physical activity that were related to leisure and recreation. Finally, the last item (Q16) measured the sedentary behavior, or in other words referred to sitting/reclining without the incorporation of sleep time. The participants were divided into different PA levels, which are represented as low (< 600 MET-min/week), moderate (at least 600-2,999 MET-min/week), or high (3,000+ MET-min/week).
The Depression Anxiety Stress Scale (DASS-21) [26] was used to measure the symptoms of the three emotional states, namely depression, anxiety, and stress. In particular, each of these three emotions in DASS-21 contained a total of seven items that were rated on a 4-point Likert scale from zero (“did not apply to me at all”) to three (“applied to me most of the time”). The subscale scores were then added. No reverse-scored item was used. The participants were categorized into different severity rating indices, which included normal, mild, moderate, severe, and extremely severe [26]. This scale revealed a good internal consistency reliability in the present study (Cronbach’s α = 0.89 for DASS-21 total score, 0.78 for DASS-Depression, 0.65 for DASS-Anxiety, and 0.82 for DASS-Stress subscales score).
The Pittsburgh Sleep Quality Index (PSQI) [27] was also used in the current research to measure the sleep quality over a one-month time interval. The seven subscales of the PSQI ranged from zero to three (no difficulty to severe difficulty).
The sum of the seven subscale scores provided the overall PSQI score ranging from zero to 21. A higher score represented poorer sleep quality, in which poor sleep quality was indicated with a score of five or more. The index demonstrated a good internal consistency reliability (Cronbach’s α = 0.75) in the current study.
Anthropometric measurements
The body weight, height, waist circumference (WC), and body
fat percentage (BF%) of the participants were measured using
a TANITA Digital Weighing Scale HD319 (TANITA Corp., Tokyo,
Japan), a SECA Portable Stadiometer 213 (SECA, Hamburg,
Germany), a Lufkin Executive Diameter steel tape W606PM
(Cooper Hand Tools, Raleigh, North Carolina, USA), and an
Omron Body Fat Monitor HBF-306 (Omron Healthcare Co. Ltd.,
Kyoto, Japan), respectively. The body mass index (BMI) was
Characteristics
Mean±SD / n (%) Normal
(n = 127)
Anemic (n = 50)
Total (n = 177) Sociodemographic Factors
Age (yrs) 48.8 ± 12.4 47.1 ± 12.0 48.4 ± 12.3
≤ 30 15 (11.8) 4 (8.0) 19 (10.7)
31-40 13 (10.3) 6 (12.0) 19 (10.7)
41-50 31 (24.4) 24 (48.0) 55 (31.1)
> 50 68 (53.5) 16 (32.0) 84 (47.5)
Ethnicity
Chinese 80 (63.0) 28 (56.0) 108 (61.0)
Indian 47 (37.0) 22 (44.0) 69 (39.0)
Marital status
Single 37 (29.1) 10 (20.0) 47 (26.6)
Divorced 13 (10.2) 1 (2.0) 14 (7.9)
Widowed 11 (8.7) 2 (4.0) 13 (7.3)
Married 66 (52.0) 37 (74.0) 103 (58.2)
Education level
No formal education 2 (1.6) 1 (2.0) 3 (1.7)
Primary 18 (14.2) 3 (6.0) 21 (11.9)
Secondary 69 (54.3) 34 (68.0) 103 (58.2)
Tertiary 38 (29.9) 12 (24.0) 50 (28.3)
Occupation
Managers 16 (12.6) 7 (14.0) 23 (13.0)
Professionals 29 (22.8) 14 (28.0) 43 (24.3)
Technician and other workers 25 (19.7) 13 (26.0) 38 (21.5) Housewives/unemployed 51 (40.2) 15 (30.0) 66 (37.3)
Students 6 (4.7) 1 (2.0) 7 (4.0)
Household members
≤ 2 30 (25.4) 9 (19.1) 39 (22.0)
3-4 40 (33.9) 20 (42.6) 60 (33.9)
5-6 35 (29.7) 16 (34.0) 51 (28.8)
> 6 13 (11.0) 2 (4.3) 15 (8.5)
Monthly household income (USD)1)
Low (< 553) 41 (32.8) 21 (42.0) 62 (35.0)
Middle (553-1345) 46 (36.8) 17 (34.0) 63 (35.6)
High (≥ 1346) 38 (30.4) 12 (24.0) 50 (28.2)
Vegetarian category
Lacto-ovo 66 (52.0) 21 (42.0) 87 (49.1)
Ovo 6 (4.7) 3 (6.0) 9 (5.1)
Lacto 32 (25.2) 17 (34.0) 49 (27.7)
Vegan 23 (18.1) 9 (18.0) 32 (18.1)
Total yrs of being vegetarian 15.6 ± 11.9 14.3 ± 8.4 13.9 ± 9.9
< 5 23 (18.1) 8 (16.0) 31 (17.5)
≥ 5 104 (81.9) 42 (84.0) 146 (82.5)
Lifestyle Factors
Sleep quality 5.32 ± 2.74 4.66 ± 1.80 5.14 ± 2.52
Good 43 (33.9) 24 (48.0) 67 (37.9)
Poor 84 (66.1) 26 (52.0) 110 (62.1)
Physical activity level
Low 71 (55.9) 21 (42.0) 92 (52.0)
Moderate 38 (29.9) 18 (36.0) 56 (31.6)
High 18 (14.2) 11 (22.0) 29 (16.4)
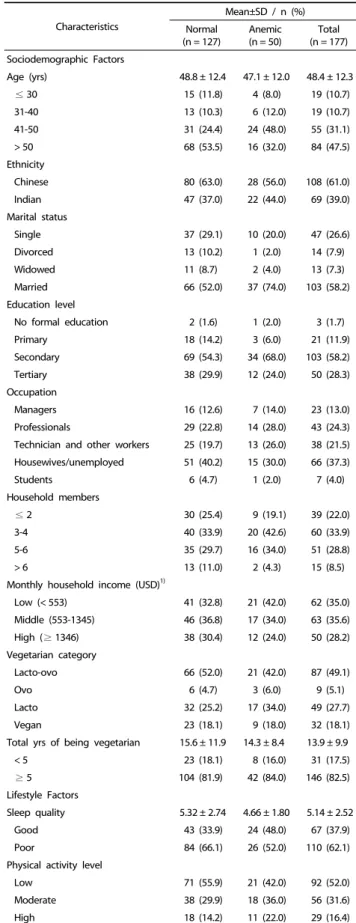
Table 1. General characteristics of the participants according to their anemia status (n = 177)
calculated as the weight (kg) divided by the height (m) squared;
the classification of the BMI from the World Health Organization (WHO) [28] was used. A WC ≥ 80 cm for Asian adult women [29] was categorized as abdominal obesity. The BF% was ranked based on four groups as follows: too low (≤ 8%); acceptable, lower end (9-23%); acceptable, higher end (24-31%); and too high (≥ 32%) [30].
Dietary intake assessment
A face-to-face interview on a three-day dietary recall (two weekdays and one weekend) was conducted to assess the dietary intake of the participants. Household measurement cups and spoons were used to estimate the portion size and quantities of food consumed. The dietary intake data were analyzed using Nutritionist Pro
TMNutrition Analysis Software version 3.2.0 (First Data Bank, USA, 2011). The Malaysian Food Composition Table [31] was used to analyze the diet data.
Dietary adequacy was evaluated by comparing the mean values for energy and nutrient intake with the Recommended Nutrient Intake (RNI) for Malaysians [32]. For adults, it is recommended that 50%-65% of the total daily energy intake be derived from carbohydrates, 10%-20% from protein, and 25%-30% from fat [32]. For micronutrient intake (vitamins A, B
12, C, calcium, folate, iron, and zinc), participants who met or exceeded 100% of the RNI for micronutrients were considered to have an adequate micronutrient intake.
Determination of anemia status
A nurse was assigned to withdraw 3 mL of venous blood from the participants for Hb analysis. The Hb level of the participants was measured using an automated hematology analyzer, Sysmex Analyzer. A hemoglobin level < 11.9 g/dL indicates that a woman is anemic and can be further categ- orized into three groups: mild (10.0-11.9 g/dL), moderate (7.0-9.9 g/dL), and severe (< 7.0 g/dL) [33].
Statistical analysis
Statistical analysis was performed using IBM SPSS Statistics 24 (IBM Corp., Armonk, NY, USA). Descriptive statistics, which are also known as the absolute (n) and relative (%) frequencies are presented for the categorical variables, whereas the means and standard deviations (SD) are reported for the continuous variables. Logistic regression analysis was used to determine the association between the various potential risk factors with the anemia status among vegetarians. The crude odds ratios (ORs) with 95% confidence interval (CIs) were calculated from simple logistic regression analysis. All variables with a P-value of < 0.25 in simple logistic regression analysis were analyzed further in the final multiple logistic regression analysis model. Finally, a stepwise method was adopted to determine the adjusted odds ratios for the variables in the final model, while the level of statistical significance was set to P < 0.05.
RESULTS
Sociodemographic, nutritional, lifestyle, and psychological chara- cteristics according to anemia status
A total of 177 participants out of the initial total of 225 female
Characteristics
Mean±SD / n (%) Normal
(n = 127)
Anemic (n = 50)
Total (n = 177) Psychological Factors
Depression 4.03 ± 5.27 4.12 ± 5.69 4.06 ± 5.38
Normal 107 (84.3) 41 (82.0) 148 (83.6)
Mild 15 (11.8) 6 (12.0) 21 (11.9)
Moderate 3 (2.3) 2 (4.0) 5 (2.8)
Extreme 2 (1.6) 1 (2.0) 3 (1.7)
Anxiety 6.44 ± 5.70 6.68 ± 5.86 6.51 ± 5.73
Normal 81 (63.8) 30 (60.0) 111 (62.7)
Mild 10 (7.9) 4 (8.0) 14 (7.9)
Moderate 26 (20.5) 11 (22.0) 37 (20.9)
Severe 6 (4.8) 3 (6.0) 9 (5.1)
Extreme 4 (3.1) 2 (4.0) 6 (3.4)
Stress 9.09 ± 7.49 9.20 ± 7.59 9.12 ± 7.50
Normal 105 (82.7) 41 (82.0) 146 (82.5)
Mild 13 (10.2) 6 (12.0) 19 (10.7)
Moderate 3 (2.4) 1 (2.0) 4 (2.3)
Severe 4 (3.1) 1 (2.0) 4 (2.3)
Extreme 2 (1.6) 1 (2.0) 3 (1.7)
n, number; SD, standard deviation
1)United States Dollar (USD) = 4.15 Malaysian Ringgit (MYR) Table 1. continued
Characteristics
Mean±SD / n (%) Normal
(n = 127) Anemic
(n = 50) Total (n = 177) Body mass index (BMI; kg/m2) 22.9 ± 3.9 23.2 ± 3.9 23.1 ± 3.9 Underweight (< 18.5) 12 (9.4) 8 (16.0) 20 (11.3) Normal weight (18.5-24.9) 74 (58.3) 26 (52.0) 100 (56.5) Overweight (25.0-29.9) 34 (32.3) 13 (26.0) 47 (26.6)
Obesity (≥ 30.0) 7 (5.5) 3 (6.0) 10 (5.6)
Waist circumference (WC; cm) 81.8 ± 12.1 75.9 ± 9.4 80.2 ± 11.7
No risk (< 80) 76 (59.8) 23 (46.0) 99 (56.0)
Abdominal obesity (≥ 80) 51 (40.2) 27 (54.0) 78 (44.0) Body fat percentage (BF%) 35.3 ± 6.5 30.9 ± 5.4 34.1 ± 6.5
Unhealthy, too low (≤ 8) 1 (0.8) 0 (0) 1 (0.6)
Acceptable, lower end (9-23) 2 (1.6) 5 (10.0) 7 (4.0) Acceptable, higher end (24-31) 20 (15.7) 22 (44.0) 42 (23.7) Unhealthy, too high (≥ 32) 104 (81.9) 23 (46.0) 127 (71.8) n, number; SD, standard deviation
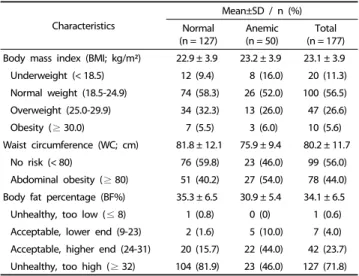
Table 2. Nutritional status of the participants according to their anemia status (n = 177)
vegetarians who registered to participate in this study consented and fulfilled the recruitment criteria, producing a response rate of 78.7%. The mean Hb level of the participants was 12.6 ± 1.2 g/dL (range 8.7-15.4 g/dL). More importantly, the prevalence of anemia among the vegetarians was 28.2%, where 46 of them were regarded as mild anemic (26.0%) and four as moderate anemic (2.3%). As shown in Table 1, the mean age of the participants was 48.4 ± 12.3 years. The majority of the partici- pants were Chinese (61.0%), less than 50 years old (52.5%), and married (58.2%). Moreover, most of the vegetarians had
completed secondary (58.2%) and tertiary education (28.3%).
In terms of the vegetarian category, 49.1% were lacto-ovo vegetarians, 27.7% were lacto-vegetarians, 18.1% were vegans, and 5.1% were ovo-vegetarians. More than half of the participants reported a poor sleep quality (62.1%) and low PA level (52.0%). Moreover, the prevalence of depression, anxiety and stress were 16.4%, 37.3%, and 17.5%, respectively.
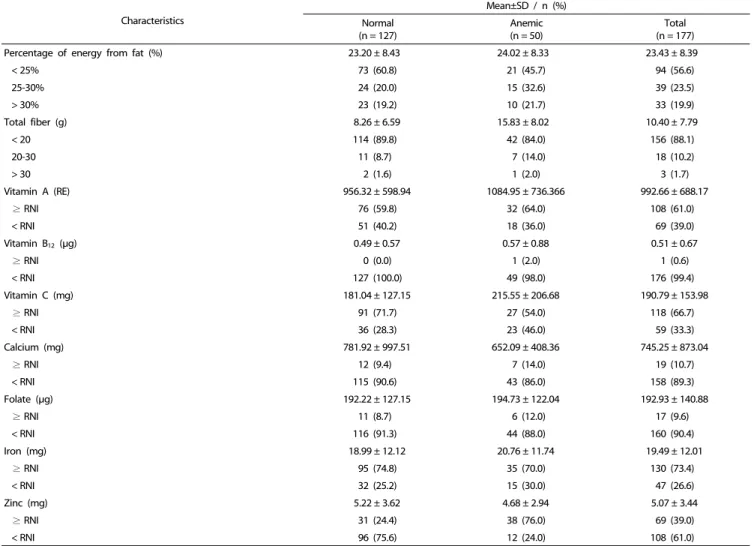
As shown in Table 2, approximately one third of participants were overweight (26.6%) and obese (5.6%). Almost half of the participants were abdominally obese (44.0%). More than two thirds of them had a body fat percentage that was not within the healthy range (71.8%). In terms of dietary intake, more than half of the participants did not have an adequate intake of energy (59.3%), protein (56.5%), fiber (88.1%), vitamin B
12(99.4%), calcium (89.3%), folate (90.4%), and zinc (52.0%), as listed in Table 3.
Characteristics
Mean±SD / n (%) Normal
(n = 127)
Anemic (n = 50)
Total (n = 177)
Energy (kcal) 1,747.84 ± 772.84 1,862.78 ± 766.31 1,780.31 ± 770.57
≥ RNI1) 52 (40.9) 20 (40.0) 72 (40.7)
< RNI 75 (59.1) 30 (60.0) 105 (59.3)
Protein (g) 57.84 ± 27.91 57.48 ± 26.08 57.74 ± 27.34
≥ RNI 54 (42.5) 23 (46.0) 77 (43.5)
< RNI 73 (57.5) 27 (54.0) 100 (56.5)
Percentage of energy from protein (%) 13.16 ± 2.96 12.58 ± 2.48 12.99 ± 2.84
< 10% 9 (7.5) 10 (21.7) 19 (11.4)
10-20% 109 (90.8) 35 (76.1) 144 (6.7)
> 20% 2 (1.7) 1 (2.2) 3 (1.8)
Carbohydrate (g) 277.46 ± 122.92 284.29 ± 129.56 279.39 ± 124.49
Percentage of energy from carbohydrate (%) 63.62 ± 9.15 63.34 ± 8.64 63.54 ± 8.98
< 50% 14 (11.7) 3 (6.5) 17 (10.2)
50-65% 48 (40.0) 28 (60.9) 76 (45.8)
> 65% 58 (48.3) 15 (32.6) 73 (44.0)
Total fat (g) 46.46 ± 25.30 48.28 ± 30.99 46.97 ± 26.95
Table 3. Dietary intake of the participants according to their anemia status (n = 177)
Characteristics Simple logistic regression Crude OR (95% CI) P-value Age groups (yrs)
> 50 1.00
≤ 50 2.45 (1.23, 4.88) 0.011
Ethnicity
Chinese 1.00
Indian 1.34 (0.69, 2.59) 0.391
Marital status
Single/divorced/widowed 1.00
Married 2.63 (1.28, 5.41) 0.009
Education level
No formal education/primary education 1.00
Secondary education 2.46 (0.78, 7.78) 0.124
Tertiary education 1.58 (0.45, 5.53) 0.475
Occupation
Managers 1.00
Professionals 1.10 (0.37, 3.29) 0.860
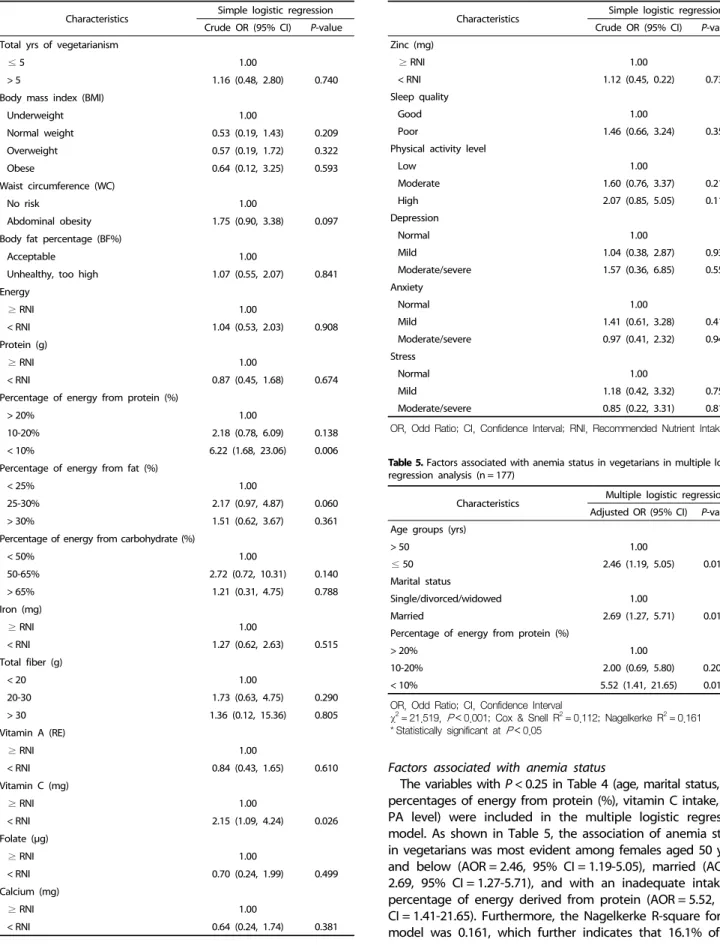
Table 4. Factors associated with anemia status in vegetarians in simple logistic regression analysis (n = 177)
Characteristics Simple logistic regression Crude OR (95% CI) P-value Technicians and other workers 1.19 (0.39, 3.62) 0.761
Housewives/unemployed 0.67 (0.23, 1.94) 0.462
Students 0.38 (0.04, 3.78) 0.410
Household members
≤ 2 1.00
3-4 1.67 (0.67, 4.17) 0.276
5-6 1.52 (0.59, 3.94) 0.385
> 6 0.51 (0.97, 2.71) 0.432
Monthly household income
Low 1.00
Medium 0.72 (0.34, 1.55) 0.403
High 0.62 (0.27, 1.42) 0.256
Vegetarian category
Lacto-ovo 1.00
Ovo 1.57 (0.36, 6.84) 0.547
Lacto 1.67 (0.78, 3.59) 0.190
Vegan 1.23 (0.49, 3.07) 0.657
Table 4. continued Characteristics
Mean±SD / n (%) Normal
(n = 127)
Anemic (n = 50)
Total (n = 177)
Percentage of energy from fat (%) 23.20 ± 8.43 24.02 ± 8.33 23.43 ± 8.39
< 25% 73 (60.8) 21 (45.7) 94 (56.6)
25-30% 24 (20.0) 15 (32.6) 39 (23.5)
> 30% 23 (19.2) 10 (21.7) 33 (19.9)
Total fiber (g) 8.26 ± 6.59 15.83 ± 8.02 10.40 ± 7.79
< 20 114 (89.8) 42 (84.0) 156 (88.1)
20-30 11 (8.7) 7 (14.0) 18 (10.2)
> 30 2 (1.6) 1 (2.0) 3 (1.7)
Vitamin A (RE) 956.32 ± 598.94 1084.95 ± 736.366 992.66 ± 688.17
≥ RNI 76 (59.8) 32 (64.0) 108 (61.0)
< RNI 51 (40.2) 18 (36.0) 69 (39.0)
Vitamin B12 (μg) 0.49 ± 0.57 0.57 ± 0.88 0.51 ± 0.67
≥ RNI 0 (0.0) 1 (2.0) 1 (0.6)
< RNI 127 (100.0) 49 (98.0) 176 (99.4)
Vitamin C (mg) 181.04 ± 127.15 215.55 ± 206.68 190.79 ± 153.98
≥ RNI 91 (71.7) 27 (54.0) 118 (66.7)
< RNI 36 (28.3) 23 (46.0) 59 (33.3)
Calcium (mg) 781.92 ± 997.51 652.09 ± 408.36 745.25 ± 873.04
≥ RNI 12 (9.4) 7 (14.0) 19 (10.7)
< RNI 115 (90.6) 43 (86.0) 158 (89.3)
Folate (μg) 192.22 ± 127.15 194.73 ± 122.04 192.93 ± 140.88
≥ RNI 11 (8.7) 6 (12.0) 17 (9.6)
< RNI 116 (91.3) 44 (88.0) 160 (90.4)
Iron (mg) 18.99 ± 12.12 20.76 ± 11.74 19.49 ± 12.01
≥ RNI 95 (74.8) 35 (70.0) 130 (73.4)
< RNI 32 (25.2) 15 (30.0) 47 (26.6)
Zinc (mg) 5.22 ± 3.62 4.68 ± 2.94 5.07 ± 3.44
≥ RNI 31 (24.4) 38 (76.0) 69 (39.0)
< RNI 96 (75.6) 12 (24.0) 108 (61.0)
n, number; SD, standard deviation
1)RNI, Recommended Nutrient Intake [32]
Table 3. continued
Characteristics Multiple logistic regression Adjusted OR (95% CI) P-value Age groups (yrs)
> 50 1.00
≤ 50 2.46 (1.19, 5.05) 0.014*
Marital status
Single/divorced/widowed 1.00
Married 2.69 (1.27, 5.71) 0.010*
Percentage of energy from protein (%)
> 20% 1.00
10-20% 2.00 (0.69, 5.80) 0.200
< 10% 5.52 (1.41, 21.65) 0.014*
OR, Odd Ratio; CI, Confidence Interval
χ2= 21.519, P< 0.001; Cox & Snell R2= 0.112; Nagelkerke R2= 0.161
* Statistically significant at P< 0.05
Table 5. Factors associated with anemia status in vegetarians in multiple logistic regression analysis (n = 177)
Characteristics Simple logistic regression Crude OR (95% CI) P-value Total yrs of vegetarianism
≤ 5 1.00
> 5 1.16 (0.48, 2.80) 0.740
Body mass index (BMI)
Underweight 1.00
Normal weight 0.53 (0.19, 1.43) 0.209
Overweight 0.57 (0.19, 1.72) 0.322
Obese 0.64 (0.12, 3.25) 0.593
Waist circumference (WC)
No risk 1.00
Abdominal obesity 1.75 (0.90, 3.38) 0.097
Body fat percentage (BF%)
Acceptable 1.00
Unhealthy, too high 1.07 (0.55, 2.07) 0.841
Energy
≥ RNI 1.00
< RNI 1.04 (0.53, 2.03) 0.908
Protein (g)
≥ RNI 1.00
< RNI 0.87 (0.45, 1.68) 0.674
Percentage of energy from protein (%)
> 20% 1.00
10-20% 2.18 (0.78, 6.09) 0.138
< 10% 6.22 (1.68, 23.06) 0.006
Percentage of energy from fat (%)
< 25% 1.00
25-30% 2.17 (0.97, 4.87) 0.060
> 30% 1.51 (0.62, 3.67) 0.361
Percentage of energy from carbohydrate (%)
< 50% 1.00
50-65% 2.72 (0.72, 10.31) 0.140
> 65% 1.21 (0.31, 4.75) 0.788
Iron (mg)
≥ RNI 1.00
< RNI 1.27 (0.62, 2.63) 0.515
Total fiber (g)
< 20 1.00
20-30 1.73 (0.63, 4.75) 0.290
> 30 1.36 (0.12, 15.36) 0.805
Vitamin A (RE)
≥ RNI 1.00
< RNI 0.84 (0.43, 1.65) 0.610
Vitamin C (mg)
≥ RNI 1.00
< RNI 2.15 (1.09, 4.24) 0.026
Folate (μg)
≥ RNI 1.00
< RNI 0.70 (0.24, 1.99) 0.499
Calcium (mg)
≥ RNI 1.00
< RNI 0.64 (0.24, 1.74) 0.381
Table 4. continued
Characteristics Simple logistic regression Crude OR (95% CI) P-value Zinc (mg)
≥ RNI 1.00
< RNI 1.12 (0.45, 0.22) 0.735
Sleep quality
Good 1.00
Poor 1.46 (0.66, 3.24) 0.350
Physical activity level
Low 1.00
Moderate 1.60 (0.76, 3.37) 0.214
High 2.07 (0.85, 5.05) 0.112
Depression
Normal 1.00
Mild 1.04 (0.38, 2.87) 0.934
Moderate/severe 1.57 (0.36, 6.85) 0.552
Anxiety
Normal 1.00
Mild 1.41 (0.61, 3.28) 0.419
Moderate/severe 0.97 (0.41, 2.32) 0.949
Stress
Normal 1.00
Mild 1.18 (0.42, 3.32) 0.751
Moderate/severe 0.85 (0.22, 3.31) 0.819
OR, Odd Ratio; CI, Confidence Interval; RNI, Recommended Nutrient Intake Table 4. continued
Factors associated with anemia status
The variables with P < 0.25 in Table 4 (age, marital status, WC, percentages of energy from protein (%), vitamin C intake, and PA level) were included in the multiple logistic regression model. As shown in Table 5, the association of anemia status in vegetarians was most evident among females aged 50 years and below (AOR = 2.46, 95% CI = 1.19-5.05), married (AOR = 2.69, 95% CI = 1.27-5.71), and with an inadequate intake of percentage of energy derived from protein (AOR = 5.52, 95%
CI = 1.41-21.65). Furthermore, the Nagelkerke R-square for the
model was 0.161, which further indicates that 16.1% of the
variance in the anemia status of female vegetarians in this study could be explained by these three factors.
DISCUSSION
The findings of the present study revealed a 28.2% prevalence of anemia among female vegetarians, which further indicates that anemia is a moderate public health problem [33]. This result is consistent with the WHO report, which stated that 30% of adult women in Malaysia were anemic [34]. Furthermore, partici- pants aged 50 years and younger were more likely to have anemia than those aged more than 50 years old. Menstruation is among the factors that could be associated with anemia due to periodic blood loss [12], which explains the rationale of the classification of age groups in this study, provided that the average year of menopause among Malaysian women is 50 years old [12]. On the other hand, a study in India reported that women from the age group below 25 years old tended to be more affected by anemia [16]. A possible explanation for the variation might be the common occurrence of teenage pregnancy in India considering that half of them usually fall pregnant with a maternal age below 20 years old, while more than one fourth fall pregnant before 18 years old [35].
The marital status was found to be positively associated with anemia in the present study. Recent evidence regarding the association between marriage and anemia has been two sided.
Entry into high-quality marriage could help encourage healthy behaviors and promote longevity [36]. Nevertheless, married life has also been identified as a risk factor that leads to a poor nutritional status. In many cases, the husband or wife may no longer be concerned with their body image, resulting in an increase in fast food consumption, excessive television watching, and prolonged sedentary habits [37]. In addition, married women play the roles as both mothers and wives. Hence, they are always required to carry their responsibility in taking care of the needs of the household, which sometimes causes them to neglect their own needs, resulting in a poor nutritional status [38].
A high prevalence of overweight and obesity (32.2%) was reported among female vegetarians in this study, suggesting that overweight and obesity is a public health problem among female vegetarians. Anemic participants showed a higher mean BMI than their counterparts, which is in line with the obesity- anemia mechanism, in which pro-inflammatory cytokines induced by adipose tissue can inhibit iron absorption and retain iron in the bone marrow macrophages [20]. On the other hand, none of the anthropometric indices in the present study, which included the BMI, WC, and BF%, had an association with anemia.
Data from previous studies showed conflicting results whereby a meta-analysis [39] reported that obesity is emerging risk factor for anemia. In contrast, in the studies conducted in China [40]
and Bangladesh [38], anemia was found to be more prevalent among underweight women. Consistent with the present finding, BMI had no association with anemia in US adults based on the findings reported in the third National Health and Nutrition Examination Survey (NHANES III) [41]. Limited studies were conducted to examine the associations of WC and BF%
with the anemia status, particularly among vegetarians.
The findings of this study showed that vegetarians with inadequate energy intake from protein were 5.52 times more likely to develop anemia compared to those who had adequate energy intake from protein. Similar studies in US [42] and Saudi Arabia [43] support this finding. Of the three macronutrients, protein has the greatest influence on the iron metabolism. The effects of protein on the anemia status have been discussed in many studies in terms of the protein food source. For example, soy is high in iron and ferritin, and it contains fiber, polyunsaturated fat, and phytoestrogens, which all can lower the levels of inflammatory markers and reduce the metabolic causes of anemia [44]. In addition, egg white protein was also shown to have power in anemia recovery because of the negative carboxylate sites (-CO
2-) on the molecule surface of ovalbumin, which have a strong binding effect of iron [45]. In contrast, egg yolk protein reduces the iron bioavailability when the resistant protein, phosvitin, combines with dietary iron and forms an insoluble iron complex in the small intestine [46]. Vegetarians have a high intake of these food sources, which might explain the significant association between the percentage of energy intake from protein and anemia. Further studies will be needed to confirm this finding.
Surprisingly, vitamin C and iron intake of the anemic participants were higher than the non-anemic participants, but no association between these nutrients with anemia status was reported. This might be because some anemic vegetarians might realize their symptoms of anemia and increase their dietary intake of vitamin C and iron. On the other hand, the recovery of symptoms took a certain period and could be delayed due to other factors, such as inflammation. Hence, more studies will be needed to confirm this finding.
Physical activity had no association with the anemia status in this study. Exercise-induced anemia is more common in endurance sports, which further explains the non-significant relationship between anemia and physical activity in non- athletic persons. The present study also failed to detect any significant relationship between anemia and psychological factors. Psychological factors might be more prominent and convincing among elderly if their anemia status is more severe [47]. All vegetarian participants in the current study were either Buddhists or Hindus, in which high religiosity could be a protective factor against poor mental health. The influence of sleep quality in adults with anemia is complex. A previous study positively correlated the sleep quality with the Hb level among dialysis patients [48]. Nevertheless, sleep quality was found to have no association with anemia among vegetarians in the present study.
This study had several limitations. First, the results were limited to being a cross-sectional study. Thus, a determination of a possible temporal relationship between anemia and the risk factors will require further prospective cohort studies.
Second, this study employed a convenience sample of female
adult vegetarians, in which the findings cannot be generalized
to all vegetarians. Furthermore, the current research was limited
by the inability to differentiate the specific types of anemia
because other biochemical indicators, such as vitamin B
12,
folate, ferritin, and iron, were not included. Moreover, this study
did not involve a non-vegetarian group; hence, a comparison
between vegetarian and non-vegetarian groups could not be made. Another limitation of this study refers to the fact that the menstruation status, which may be one of the factors associated with anemia in females, was not investigated in the present study.
In conclusion, anemia appears to be a public health issue that is regarded as a critical concern among female adult vegetarians in Malaysia. More importantly, age, marital status, and percen- tage of energy derived from protein intake were found to be significant predictors of anemia. Therefore, nutrition education and intervention programs on anemia among vegetarians should be carried out by targeting married individuals aged 50 and below. In addition, these programs should focus on educa- ting vegetarians on the importance of having an adequate energy intake from protein to prevent anemia. Anemia is a disease that is readily preventable and treatable. Therefore, more studies will be needed to confirm these findings.
ACKNOWLEDGMENTS
The authors would like to express their gratitude to every individual who participated in this study. Furthermore, the authors would also like to thank Dr. Thavamaran Kanesan’s group for their effort in proofreading this manuscript.
CONFLICT OF INTEREST
The authors declare no potential conflicts of interests.
ORCID
Zi Fei Chai: https://orcid.org/0000-0003-4448-8557 Wan Ying Gan: http://orcid.org/0000-0002-9016-3414 Yuan Kei Ching: http://orcid.org/0000-0002-1012-3122 Yit Siew Chin: http://orcid.org/0000-0002-7609-1944
Mahenderan Appukutty: https://orcid.org/0000-0001-8114-5575 REFERENCES
1. Nath J. ‘God is a vegetarian’: the food, health and bio-spirituality of Hare Krishna, Buddhist and Seventh-Day Adventist devotees.
Health Soc Rev 2010;19:356-68.
2. Leitzmann C. Vegetarian nutrition: past, present, future. Am J Clin Nutr 2014;100 Suppl 1:496S-502S.
3. Key TJ, Appleby PN, Rosell MS. Health effects of vegetarian and vegan diets. Proc Nutr Soc 2006;65:35-41.
4. Henderson L, Gregory J, Swan G. The National Diet & Nutrition Survey: Adults Aged 19 to 64 Years. London: The Stationary Office;
2002.
5. Piccoli GB, Clari R, Vigotti FN, Leone F, Attini R, Cabiddu G, Mauro G, Castelluccia N, Colombi N, Capizzi I, Pani A, Todros T, Avagnina P. Vegan-vegetarian diets in pregnancy: danger or panacea? A systematic narrative review. BJOG 2015;122:623-33.
6. Craig WJ. Health effects of vegan diets. Am J Clin Nutr 2009;89:
1627S-33S.
7. Pizarro F, Olivares M, Hertrampf E, Mazariegos DI, Arredondo M.
Heme-iron absorption is saturable by heme-iron dose in women.
J Nutr 2003;133:2214-7.
8. de Benoist B, McLean E, Egli I, Cogswell M. Worldwide Prevalence of Anemia 1993-2005: WHO Global Database on Anemia. Geneva:
World Health Organization; 2008.
9. Mihrshahi S, Ding D, Gale J, Allman-Farinelli M, Banks E, Bauman AE. Vegetarian diet and all-cause mortality: evidence from a large population-based Australian cohort - the 45 and up study. Prev Med 2017;97:1-7.
10. Bedford JL, Barr SI. Diets and selected lifestyle practices of self-defined adult vegetarians from a population-based sample suggest they are more ‘health conscious’. Int J Behav Nutr Phys Act 2005;2:4.
11. Harris CR, Jenkins M, Glaser D. Gender differences in risk assessment:
why do women take fewer risks than men? Judgm Decis Mak 2006;1:48-63.
12. Abdullah B, Moize B, Ismail BA, Zamri M, Mohd Nasir NF. Prevalence of menopausal symptoms, its effect to quality of life among Malaysian women and their treatment seeking behaviour. Med J Malaysia 2017;72:94-9.
13. Bachman E, Travison TG, Basaria S, Davda MN, Guo W, Li M, Connor Westfall J, Bae H, Gordeuk V, Bhasin S. Testosterone induces erythro- cytosis via increased erythropoietin and suppressed hepcidin:
evidence for a new erythropoietin/hemoglobin set point. J Gerontol A Biol Sci Med Sci 2014;69:725-35.
14. Le CH. The prevalence of anemia and moderate-severe anemia in the US population (NHANES 2003-2012). PLoS One 2016;11:e0166635.
15. Institute for Public Health (IPH). National Health and Morbidity Survey 2015 (NHMS 2015). Vol. II: Non-Communicable Diseases, Risk Factors & Other Health Problems. Kuala Lumpur: Ministry of Health Malaysia; 2015.
16. Lilare RR, Sahoo DP. Prevalence of anemia and its epidemiological correlates among women of reproductive age group in an urban slum of Mumbai. Int J Community Med Public Health 2017;4:2841-6.
17. Mahajani K, Bhatnagar V. Comparative study of prevalence of anaemia in vegetarian and non vegetarian women of Udaipur City, Rajasthan. J Nutr Food Sci 2015;S3:1-6.
18. Kassebaum NJ, Jasrasaria R, Naghavi M, Wulf SK, Johns N, Lozano R, Regan M, Weatherall D, Chou DP, Eisele TP, Flaxman SR, Pullan RL, Brooker SJ, Murray CJ, Pullan RL, Brooker SJ, Murray CJ. A systematic analysis of global anemia burden from 1990 to 2010.
Blood 2014;123:615-24.
19. Bharati S, Pal M, Som S, Bharati P. Temporal trend of anemia among reproductive-aged women in India. Asia Pac J Public Health 2015;27:NP1193-207.
20. Aigner E, Feldman A, Datz C. Obesity as an emerging risk factor for iron deficiency. Nutrients 2014;6:3587-600.
21. Choudhary S, Rajnee, Binawara BK. Effect of exercise on serum iron, blood haemoglobin and cardiac efficiency. J Postgrad Med Inst 2012;26:13-6.
22. Murat S, Ali U, Serdal K, Süleyman D, İlknur P, Mehmet S, Bahattin A, Tunahan U. Assessment of subjective sleep quality in iron deficiency anaemia. Afr Health Sci 2015;15:621-7.
23. Noorazar SG, Ranjbar F, Nemati N, Yasamineh N, Kalejahi P.
Relationship between severity of depression symptoms and iron deficiency anemia in women with major depressive disorder. J Anal Res Clin Med 2015;3:219-24.
24. Gan WY, Boo S, Seik MY, Khoo HE. Comparing the nutritional status of vegetarians and non-vegetarians from a Buddhist organization in Kuala Lumpur, Malaysia. Malays J Nutr 2018;24:89-101.
25. World Health Organization. Global Physical Activity Questionnaire (GPAQ) Analysis Guide. Geneva: World Health Organization; 2012.
26. Lovibond SH, Lovibond PF. Manual for the Depression Anxiety Stress Scales. Sydney: Psychology Foundation of Australia; 1995.
27. Buysse DJ, Reynolds CF 3rd, Monk TH, Berman SR, Kupfer DJ. The Pittsburgh sleep quality index: a new instrument for psychiatric practice and research. Psychiatry Res 1989;28:193-213.
28. World Health Organization. Obesity: Preventing and Managing the Global Epidemic. Report of a World Health Organisation Consultation.
WHO Technical Report Series 894. Geneva: World Health Organization;
2000.
29. World Health Organization Regional Office for the Western Pacific.
The Asia-Pacific Perspective: Redefining Obesity and its Treatment.
Sydney: Health Communications Australia; 2000.
30. Lee RD, Nieman DC. Nutritional Assessment. New York (NY):
McGraw-Hill; 2013.
31. Tee ES, Mohd Ismail N, Mohd Nasir A, Khatijah I. Nutrient Composition of Malaysian Foods. Kuala Lumpur: Malaysian Food Composition Database Programme, Institute for Medical Research;
1997.
32. National Coordinating Committee on Food and Nutrition. Recom- mended Nutrient Intakes for Malaysia. Kuala Lumpur: Ministry of Health Malaysia; 2017.
33. World Health Organization. Hemoglobin Concentrations for the Diagnosis of Anemia and Assessment of Severity. Geneva: World Health Organization; 2011.
34. McLean E, Cogswell M, Egli I, Wojdyla D, de Benoist B. Worldwide prevalence of anaemia, WHO vitamin and mineral nutrition information system, 1993-2005. Public Health Nutr 2009;12:444-54.
35. International Institute for Population Sciences (IIPS) and Macro International. National Family Health Survey (NFHS-3), 2005-06.
Mumbai: IIPS; 2007.
36. Wilson SE. Marriage, gender and obesity in later life. Econ Hum Biol 2012;10:431-53.
37. Tzotzas T, Vlahavas G, Papadopoulou SK, Kapantais E, Kaklamanou D, Hassapidou M. Marital status and educational level associated to obesity in Greek adults: data from the national epidemiological survey. BMC Public Health 2010;10:732.
38. Kamruzzaman M, Rabbani MG, Saw A, Sayem MA, Hossain MG.
Differentials in the prevalence of anemia among non-pregnant, ever-married women in Bangladesh: multilevel logistic regression analysis of data from the 2011 Bangladesh demographic and health survey. BMC Womens Health 2015;15:54.
39. Zhao L, Zhang X, Shen Y, Fang X, Wang Y, Wang F. Obesity and iron deficiency: a quantitative meta-analysis. Obes Rev 2015;16:
1081-93.
40. Qin Y, Melse-Boonstra A, Pan X, Yuan B, Dai Y, Zhao J, Zimmermann MB, Kok FJ, Zhou M, Shi Z. Anemia in relation to body mass index and waist circumference among Chinese women. Nutr J 2013;12:10-2.
41. Ausk KJ, Ioannou GN. Is obesity associated with anemia of chronic disease? A population-based study. Obesity (Silver Spring) 2008;16:
2356-61.
42. Thomson CA, Stanaway JD, Neuhouser ML, Snetselaar LG, Stefanick ML, Arendell L, Chen Z. Nutrient intake and anemia risk in the women's health initiative observational study. J Am Diet Assoc 2011;111:532-41.
43. Alzaheb RA, Al-Amer O. The prevalence of iron deficiency anemia and its associated risk factors among a sample of female university students in Tabuk, Saudi Arabia. Clin Med Insights Womens Health 2017;10:1179562X17745088.
44. Azadbakht L, Kimiagar M, Mehrabi Y, Esmaillzadeh A, Hu FB, Willett WC. Soy consumption, markers of inflammation, and endothelial function: a cross-over study in postmenopausal women with the metabolic syndrome. Diabetes Care 2007;30:967-73.
45. Hider RC. Nature of nontransferrin-bound iron. Eur J Clin Invest 2002;32 Suppl 1:50-4.
46. Goulas A, Triplett EL, Taborsky G. Oligophosphopeptides of varied structural complexity derived from the egg phosphoprotein, phosvitin.
J Protein Chem 1996;15:1-9.
47. Onder G, Penninx BW, Cesari M, Bandinelli S, Lauretani F, Bartali B, Gori AM, Pahor M, Ferrucci L. Anemia is associated with depression in older adults: results from the InCHIANTI study. J Gerontol A Biol Sci Med Sci 2005;60:1168-72.
48. Pai MF, Hsu SP, Yang SY, Ho TI, Lai CF, Peng YS. Sleep disturbance in chronic hemodialysis patients: the impact of depression and anemia. Ren Fail 2007;29:673-7.