Progress in Superconductivity and Cryogenics
Vol.15, No.3, (2013), pp.9~12 http://dx.doi.org/10.9714/psac.2013.15.3.009
```
1. INTRODUCTION
Finding a current-voltage characteristic model of superconducting material is very useful for design and evaluation process of superconducting devices. And the characteristic itself is researched by many researchers in various ways [1]-[6]. Two major models are suggested to describe current-voltage characteristic of superconducting materials. One is known as E-J power model shown in (1).
This model is based on the numerical analysis with measurement data [1]-[3].
𝑉(𝐼) = 𝑉0 (𝐼/𝐼𝑐)𝑛 (1) I is current through superconductor and V is the terminal to terminal voltage of given sample. Ic is the critical current of superconductor and V0 is critical voltage criterion. And n is a constant called n-value which describes the sharpness of superconductivity to normal transition.
Another model is called exponential model which is described in (2). This model is focused on the physical characteristic of superconductor [4]-[5].
𝑉(𝐼) = 𝑉0exp [γ(1 − 𝐼/𝐼𝑐)𝜇] (2) In this model γ and μ are some constants like n-value in E-J power model.
Both of two models can successfully describe superconductivity to normal transition of superconductor wire under critical current range. However there is no parameter related the resistance of stabilizer in superconductor wire in suggested models. Therefore these two models are not efficient to model the effect of stabilizer variation in superconducting wire. And for some
devices such as superconducting fault current limiter the effect of stabilizer cannot be ignored because of its large current operating condition.
In this paper a modeling method of a superconducting wire with stabilizer consideration is proposed and tested with high temperature superconductor (HTS) tape with and without stabilizer condition.
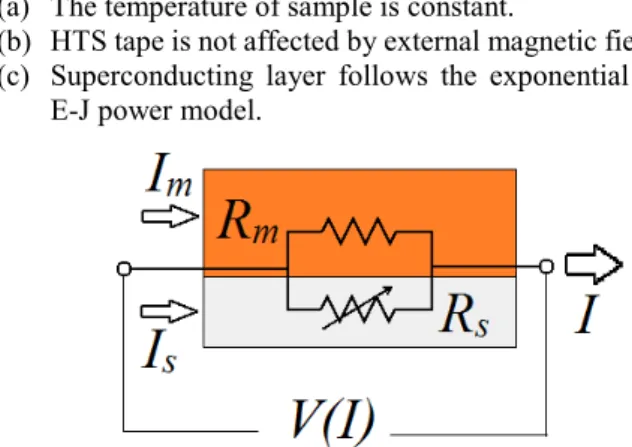
2. Modeling Method with Stabilizer Resistance 2.1. Equivalent Circuit of HTS Tape
HTS tape has superconductor layer and stabilizer layer in electrical point of view. Therefore the simplified equivalent circuit of HTS tape can be expressed as Fig. 1 [7].
Some assumptions are needed to analyze the equivalent circuit in Fig. 1.
(a) The temperature of sample is constant.
(b) HTS tape is not affected by external magnetic field.
(c) Superconducting layer follows the exponential or E-J power model.
Fig. 1. Equivalent circuit of HTS tape. Current is shared into superconductor layer and stabilizer layer.
A study on a modeling method about current-voltage characteristic of HTS tape considering resistance of stabilizer
W. S. Lee a, J. Lee a, S. Nam a, and T. K. Ko*, a
a Yonsei University, Seoul, Korea
(Received 19 August 2013; revised or reviewed 27 September 2013; accepted 28 September 2013)
Abstract
Current-voltage characteristic models of superconducting material are suggested by many researchers. These current-voltage characteristic models are important because they can be used for design or simulation of superconductor devices. But widely used current-voltage models of superconductor wire still have some limitations. For example, a standard E-J power model has no parameters related with stabilizer’s resistance in superconductor wire. In this paper, a current-voltage characteristic modeling method for high temperature superconductor (HTS) tape with considering the effect of stabilizer is introduced. And a current-voltage characteristic of a HTS tape is measured under different stabilizer conditions. Those measured current-voltage characteristics of the HTS tape modeled with proposed modeling method and the modeling results are compared.
Keywords : Current-voltage curve, E-J power, Exponential, HTS I-V curve, Stabilizer resistance
* Corresponding author: [email protected]
A study on a modeling method about current-voltage characteristic of HTS tape considering resistance of stabilizer
(d) The resistance of stabilizer is constant.
Based on assumptions (a) to (d), the current-voltage relationship can be expressed by following equations.
𝐼 = 𝐼𝑚+ 𝐼𝑆 (3) 𝑉(𝐼) = 𝑅𝑚𝐼𝑚= 𝑉0 (𝐼𝑠/𝐼𝑐)𝑛 (4) Im is the current through stabilizer layer, Is is the current through superconducting layer and Rm is the resistance of stabilizer layer.
𝑉0 (𝐼𝑠/𝐼𝑐)𝑛− 𝑅𝑚(𝐼 − 𝐼𝑠) = 0 (5) If superconducting layer follows exponential model, (5) becomes like (6).
𝑉0 exp [γ(1 − 𝐼/𝐼𝑐)𝜇− 𝑅𝑚(𝐼 − 𝐼𝑠) = 0 (6) If I, Rm and n (or γ and μ) values are given, voltage value at given current I can be calculated from Is value which is a solution of (5) or (6).
2.2. Parameter Determination from Measurement Data Because of the current is distributed to superconducting layer and stabilizer layer in HTS tape, actual critical current of superconducting layer is needed to be calculated from measured critical current value.
𝑉(𝐼𝑐𝑚) = 𝑉0 (7) 𝐼𝑐= 𝐼𝑐𝑚− 𝑉0/𝑅𝑚 (8) Icm is measured critical current value and Ic is critical current of pure superconducting layer. At the measured critical current value, voltage meets critical criterion V0
like (7). By subtracting bypassed current through stabilizer layer as written in (8), we can calculate Ic.
Since the current-voltage characteristic of HTS tape is not possible to be linearized, non-linear curve fitting method is needed for parameter determination from measurement data. The parameters with minimum error which is defined (9) are used to make model of current-voltage characteristic of HTS tape.
𝐸𝑟𝑟(𝐼, 𝑉𝑚, 𝑅𝑚, 𝑛) = �∫{𝑉𝑚− 𝑉(𝐼)}2 𝑑𝐼 (9) Vm is measured voltage data and Err is root mean square (RMS) error between model and measurement data.
3. Modeling Result Comparison with Measurement 3.1. Result Comparison without Additional Stabilizer A current-voltage characteristic of a HTS tape is measured and modeled with four different method, E-J power model, E-J power model with stabilizer consideration, exponential model, and exponential model with stabilizer consideration. The specifications of tested HTS tape are shown in table I.
TABLE I
UNITS FOR MAGNETIC PROPERTIES.
Parameter Specification
Critical Current ( Ic ) 78 A (@ 77 K, self field)
Tape Width 4 mm
Sample Length 13 cm
Voltage Tap 6 cm
Stabilizer Stainless Steel
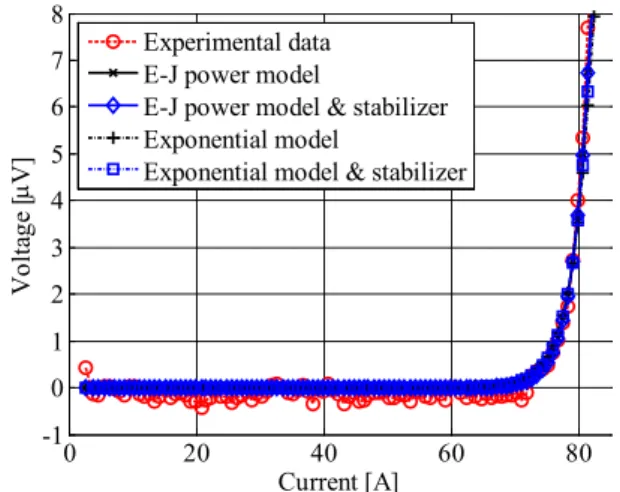
Fig. 2. Single tape voltage measurement data and modeling results with current range 0 A to 95 A. Region (a) is 0 A to 80 A range result and region (b) is 80 A to 95 A result.
Fig. 3. Large scaled graph of region (a) from Fig. 2. Within this current range, all modeling method showed little errors compared to the measurement data.
The HTS sample is immersed in liquid nitrogen environment and current ramping rate is fixed as 0.5 A/s.
The n-value of conventional E-J power model is 30.8.
And the resistance considered E-J power model, n-value is 29.0. The γ and μ values of conventional exponential model are 1.0 and 0.36. And the γ and μ values of resistance considered exponential model are 1.0 and 0.34.
Fig. 2 shows measured current-voltage characteristic and four different modeled current-voltage characteristic
0 20 40 60 80 100
-0.1 0 0.1 0.2 0.3 0.4 0.5 0.6 0.7
Current [A]
Voltage [mV]
Experimental data E-J power model
E-J power model & stabilizer Exponential model
Exponential model & stabilizer
0 20 40 60 80
-1 0 1 2 3 4 5 6 7 8
Current [A]
Voltage [µV]
Experimental data E-J power model
E-J power model & stabilizer Exponential model
Exponential model & stabilizer Region (a)
Region (b)
10
Woo Seung Lee, Jiho Lee, Seokho Nam, and Tae Kuk Ko
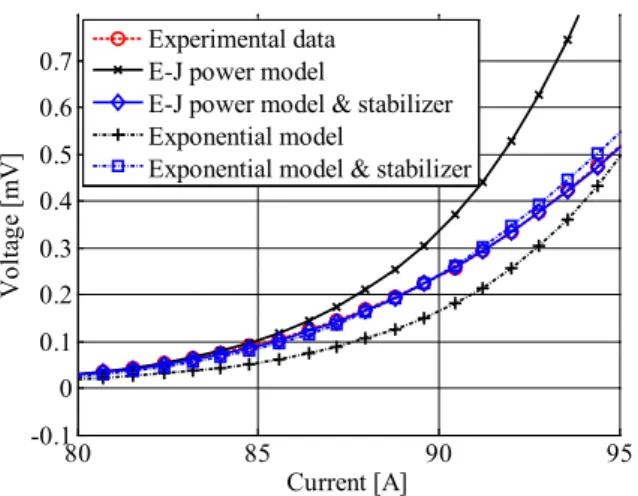
Fig. 4. Large scaled graph of region (b) from Fig. 2.
Conventional modeling results without stabilizer consideration showed large model error.
The superconducting state to normal state transition itself is possible to be expressed with all four methods. Fig. 3 shows four modeled results and measured data of region (a). The errors between measured data and modeled data are just within few nV scale which can be considered as noise component.
However the modeled results from region (b) show different characteristic. Both of conventional model errors, E-J power model and exponential model without stabilizer resistance consideration are rapidly increased and curve shape is distorted from measurement data. Fig. 4 shows measurement data and modeled results of region (b).
The average RMS error calculated by using (9) with different range of current and the result is summarized in table II. All modeled result has ignorable error values in region (a). But in region (b), especially E-J power model has 17 times larger error compared with stabilizer considered model. As a consequence, the total average error increased in both of conventional models.
3.2. Result Comparison with Additional Stabilizer To investigate effect of stabilizer variation in modeling method, same experiment is conducted with a HTS tape sample soldered to additional copper tape stabilizer. The specification of additional copper stabilizer is summarized in table III. Pb-Sn solder is used for soldering process and sample is heated up to 190 oC with flat heat plate.
The n-value of conventional E-J power model is 18.6.
And the resistance considered E-J power model, n-value is
TABLEIII COPPER TAPE SPECIFICATIONM
Symbol Quantity
Resistance per Unit Length 0.13 mΩ / cm
Tape Width 4 mm
Sample Length 13 cm
Voltage Tap 6 cm
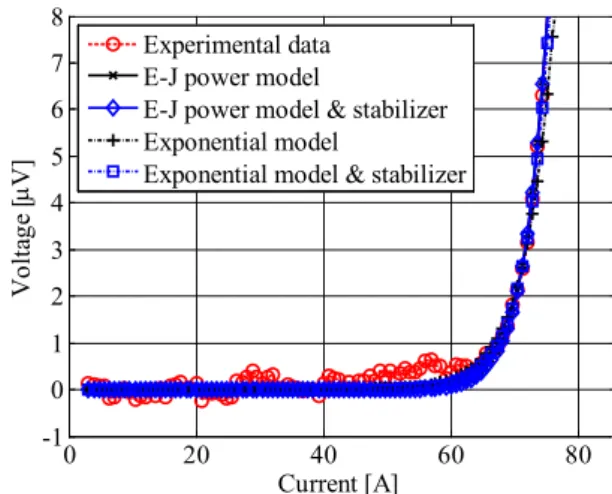
Fig. 5. Stabilizer added sample tape voltage modeling results with current range 0 A to 95 A. Region (a) is 0 A to 80 A range result and region (b) is 80 A to 95 A result.
Fig. 6. Large scaled graph of region (a) from Fig. 5. This result shows little difference compared to simple single tape result.
20.6. The γ and μ values of conventional exponential model are 1.0 and 0.26. And the γ and μ values of resistance considered exponential model are 1.0 and 0.22.
Fig. 5 shows measured current-voltage characteristic and four different modeled results. Compared with Fig. 5 and Fig. 2, curves from conventional modeling methods have more distortion to the measured data. But magnifying the region (a) of Fig. 5, these curves showed also little difference compared with measured data or stabilizer considered model results.
The most of errors are appeared in large current region
0 20 40 60 80 100
-0.1 0 0.1 0.2 0.3 0.4 0.5 0.6 0.7
Current [A]
Voltage [mV]
Experimental data E-J power model
E-J power model & stabilizer Exponential model
Exponential model & stabilizer
0 20 40 60 80
-1 0 1 2 3 4 5 6 7 8
Current [A]
Voltage [µV]
Experimental data E-J power model
E-J power model & stabilizer Exponential model
Exponential model & stabilizer TABLEII
AVERAGE RMSERROR FOR SIMPLE SINGLE HTS TAPE MODELING. Modeling Method RMS Error by Current Range (unit : μV)
Region (a)
(0 A~80 A) Region (b)
(80 A~95 A) 0 A~95 A
E-J power model 0.018 17.153 2.750
E-J power model
with stabilizer 0.018 1.047 0.169
Exponential model 0.020 5.111 0.821
Exponential model
with stabilizer 0.019 1.703 0.274
Region (a)
Region (b)
80 85 90 95
-0.1 0 0.1 0.2 0.3 0.4 0.5 0.6 0.7
Current [A]
Voltage [mV]
Experimental data E-J power model
E-J power model & stabilizer Exponential model
Exponential model & stabilizer 11
A study on a modeling method about current-voltage characteristic of HTS tape considering resistance of stabilizer
Fig. 7. Large scaled graph of region (b) from Fig. 5. The error of conventional modeling methods increased.
Fig. 7 shows magnified curves in the region (b). Simple E-J power model result shows rapid voltage increase over 85 A and simple exponential model also shows curve distortion compared with measurement data. The average RMS error calculated in table IV. Compared with the result in table II, the errors of conventional modeling results with additional stabilizer case are increased 7~27 μV larger than simple single HTS tape results in region (b). But variations of modeling with stabilizer resistance consideration results are ignorable.
From these results, we can conclude that the modeling method with stabilizer consideration is more accurate than conventional methods in large current range modeling.
4. Conclusion
A modeling method for current-voltage characteristic of HTS tape is proposed and tested. The method is based on measurement data and considers the resistance of stabilizer.
Conventional methods and suggested method showed little different below the critical current range modeling. But over the critical current range modeling, the model error from conventional methods is larger than proposed method.
And the error increased with addition of copper stabilizer.
Still, proposed modeling method can only be used in very limited situation. To design superconducting devices, consideration about thermal, mechanical, and magnetic dependence of modeling parameters such as n-value or critical current should be researched to make more accurate superconducting wire modeling.
ACKNOWLEDGMENT
This research was supported by National R&D Program through the National Research Foundation of Korea(NRF) funded by the Ministry of Science, ICT & Future Planning (No. 2012M1A7A1A02034484).
REFERENCES
[1] L.F. Goodrich, and F.R. Fickett, "Critical current measurements: a compendium of experimental results", Cryogenics, vol. 22, no. 5, pp.
225-241, 1982.
[2] Jeffrey O. Willis, J. Yates Coulter, and Martin W. Rupich, "n-Value Analysis of Position-Dependent Property Variability in Long-Length Coated Conductors", IEEE T. Appl. Supercon., vol. 21, no.3, pp. 2988-2991, 2011.
[3] G. Nishijima, H. Kitaguchi, S. Awaji, and H.-S. Shin, "Transport property measurement of practical coated conductor with copper stabilizer", AIP Conf. Proc. 1435, pp. 258, 2012; doi:
10.1063/1.4712104
[4] R.G. Mints, and A.L. Rakhmanov, "Current-voltage characteristics and superconducting state stability in composites", J. Phys. D: Appl.
Phys., vol. 15, pp. 2297-2306, 1982.
[5] K.H. Fischer, and T. Nattermann, "Collective flux creep in high-Tc superconductors", Phys. Rev. B, vol. 43, no. 13, pp. 10372-10382, 1991.
[6] M. V. Feigel'man, V. B. Geshkenbein, A. I. Larkin, and V. M.
Vinokur, "Theory of Collective Flux Creep", Phys. Rev. Lett., vol.
63, no. 20, pp. 2303-2306, 1989.
[7] Y. Iwasa, Case Study in Superconducting Magnet, 2nd ed., Springer, pp. 371-376, 2009.
80 85 90 95
-0.1 0 0.1 0.2 0.3 0.4 0.5 0.6 0.7
Current [A]
Voltage [mV]
Experimental data E-J power model
E-J power model & stabilizer Exponential model
Exponential model & stabilizer
TABLEIV
AVERAGE RMS ERROR FOR SIMPLE SINGLE HTS TAPE MODELING. Modeling Method RMS Error by Current Range (unit : μV) 0 A~80 A 80 A~95 A 0 A~95 A
E-J power model 0.023 44.339 7.106
E-J power model
with stabilizer 0.025 0.597 0.097
Exponential model 0.175 12.377 1.986
Exponential model
with stabilizer 0.067 3.018 0.485
12