Introduction
Small for gestational age (SGA) neonates refer to those with a birth weight (BW) <10th percentile for gestational age [1].
Preterm prelabor rupture of membranes (PPROM) is defined as rupture of membranes before 37 weeks [2]. Both SGA and PPROM infants are at an increased risk for adverse outcomes [2-4], and SGA appears to complicate pregnancies with preterm labor and PPROM more often than uncomplicated pregnancies [5,6]. Therefore, the accurate prediction of SGA in pregnancies with PPROM will assist in creating surveillance protocols to reduce such adverse outcomes [7].
Detection of small for gestational age in preterm
prelabor rupture of membranes by Hadlock versus the Fetal Medicine Foundation growth charts
Jose Duncan, MD
1,2, Karla Leavitt, MD
2, Kristin Duncan, RN
3, Gustavo Vilchez, MD
4Department of Obstetrics and Gynecology,
1University of Tennessee Health Science Center, Memphis, TN;
2University of South Florida, Tampa, FL;
3
Labor and Delivery Unit, Tampa General Hospital, Tampa, FL;
4Department of Obstetrics and Gynecology, University of Missouri at Kansas, Kansas City, MO, USA
Objective
The primary outcome was to compare the diagnostic accuracy of neonatal small for gestational age (SGA) by the Hadlock and Fetal Medicine Foundation (FMF) charts in our cohort, followed by the ability to predict composite severe neonatal outcomes (SNO) in pregnancies with preterm prelabor rupture of membranes (PPROM).
Methods
This study was a secondary analysis of a prospective cohort of pregnancies with PPROM from 2015 to 2018, from 23 to 36 completed weeks of gestation. Sensitivity, specificity, and positive and negative predictive values for the primary and secondary outcomes of the Hadlock and FMF fetal charts were calculated. The discriminatory ability of each chart was compared using the area under the receiver’s operating curves of clinical characteristics.
Results
Of the 106 women who met the inclusion criteria, 48 (45%) were screened positive using the FMF fetal growth chart and 22 (21%) were screened positive using the Hadlock chart. SGA was diagnosed in 12 infants (11%). Both fetal growth charts had comparable diagnostic accuracies and were statistically significant predictors of SGA (Hadlock: area under the receiver operating characteristic curves [AUC], 0.76, risk ratio [RR], 7.6, 95% confidence interval [CI], 2.5-23;
and FMF: AUC, 0.76 RR, 13.3 95%CI 1.8-99.3). Both growth standards were poor predictors of SNO.
Conclusion
The Hadlock and FMF fetal growth charts have a similar accuracy to predict SGA in pregnancies complicated by PPROM. The FMF fetal growth chart may result in a 2-fold increase in positive screens, potentially increasing fetal surveillance.
Keywords: Fetal growth restriction; Preterm prelabor rupture of membranes
Received: 2020.09.06. Revised: 2020.11.09. Accepted: 2020.11.25.
Corresponding author: Jose Duncan, MD
Department of Obstetrics and Gynecology, University of South Florida, 2 Tampa General Circ # 6000 Tampa, Fl 33606, USA E-mail: [email protected]
https://orcid.org/0000-0001-8464-9744
Articles published in Obstet Gynecol Sci are open-access, distributed under the terms of the Creative Commons Attribution Non-Commercial License (http://creativecommons.
org/licenses/by-nc/3.0/) which permits unrestricted non-commercial use, distribution, and reproduction in any medium, provided the original work is properly cited.
Copyright © 2021 Korean Society of Obstetrics and Gynecology https://doi.org/10.5468/ogs.20267
eISSN 2287-8580
The prevalence of fetal growth restriction (FGR) varies ac- cording to the definition used. In the United States, the most commonly used definition is an estimated fetal weight (EFW)
<10th percentile for gestational age; however, this definition will most likely include those that are constitutionally small [1].
Therefore, a new definition of FGR based on the Delphi crite- ria has been proposed by a group of international experts [8].
However, a recent study found that although the implemen- tation of this definition was associated with a slight increase in the detection of adverse outcomes when compared to the definition endorsed by the American Congress of Obstetri- cians and Gynecologists (ACOG), both were poor predictors of adverse neonatal outcomes [9].
The ability to detect SGA by the EFW varies according to the formula used to calculate the EFW and the fetal growth chart utilized to assign the EFW percentile according to ges- tational age [10-12]. The Hadlock et al. [13] formula is the most commonly used method to calculate the EFW, as it ap- pears to be an accurate predictor of the BW [10]. Multiple studies have attempted to identify the most accurate fetal growth chart, and most of their results suggest that none of the recently developed charts appears to be superior to the Hadlock et al. [14] growth chart in predicting SGA [11,15,16].
Despite the accuracy of the EFW to predict BW, there is a discrepancy between fetal growth charts and neonatal growth charts, specifically in the preterm period [17,18]. This lack of correlation is most likely due to the inclusion of mul- tiple risk factors that are associated with both FGR and pre- maturity [19]. To address this issue, the Fetal Medicine Foun- dation (FMF) developed a unified fetal and neonatal growth chart [20]. However, this chart has not been validated in specific obstetrical populations, such as PPROM.
We hypothesize that the FMF chart improves the detection of SGA and adverse outcomes in pregnancies with PPROM and FGR. Thus, our aim was to compare the detection ac- curacy for SGA using the Hadlock fetal versus the FMF fetal and neonatal weight chart in pregnancies complicated by PPROM.
Materials and methods
This study was a secondary analysis of a prospective cohort of pregnancies complicated by PPROM managed in an aca- demic hospital affiliated to the University of Tennessee Health
Science Center from October 2015 to June 2018.
Inclusion criteria included singleton pregnancies of mothers aged 13-46 years, from 23 weeks to 36 completed weeks of gestation, with an EFW within 2 weeks prior to delivery.
We excluded pregnancies with complex fetal anomalies, those with fetal demise, and those with incomplete data. In our institution, the diagnosis of PPROM is confirmed by the visualization of amniotic fluid passing from the cervical canal and pooling in the vagina. When diagnosis is not confirmed, a pH test of the vaginal fluid showing an arborization (fern- ing) of the dried vaginal fluid test, and the amniotic fluid was measured. If the diagnosis is uncertain, the amniodye test was done to confirm or exclude the final diagnosis.
All included participants signed an informed consent form.
Demographic and clinical characteristics including the ma- ternal age, parity, self-reported race, body mass index at presentation, gestational age at PPROM, presence of hyper- tension, diabetes, chorioamnionitis, latency, gestational age at delivery, and BW were extracted from maternal medical records. Neonatal outcomes such as the presence of respira- tory distress (RDS), grade III-IV intraventricular hemorrhage
Treated with PPROM=127
Declined participation=2
Twin gestations=2
Fetal anomalies=4
Confirmed not ruptured=9
No EFW 2 week before
delivery=3
Fetal demise=1
Patients included=106
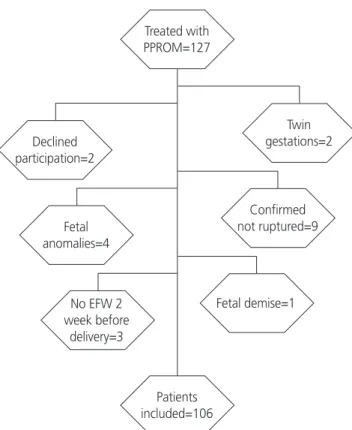
Fig. 1. Study population. PPROM, preterm prelabor rupture of
membranes; EFW, estimated fetal weight.
(IVH), neonatal sepsis, necrotizing enterocolitis (NEC) stages 2 and 3, and neonatal death, were obtained from the in- fants’ electronic medical records.
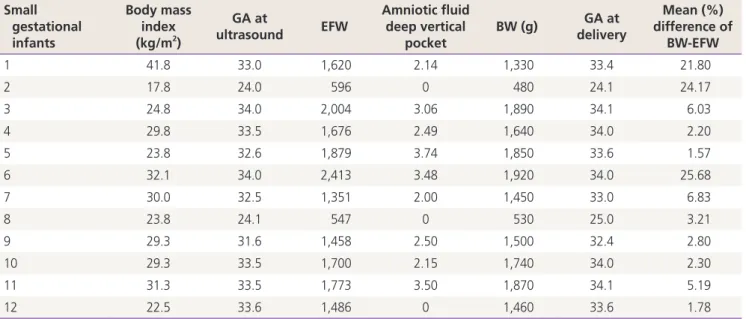
The primary outcome of this study was to calculate and compare the diagnostic accuracy for neonatal SGA using the Hadlock and FMF charts in our cohort. SGA was suspected when FGR was detected (EFW <10th percentile) using the Hadlock or FMF chart. Neonatal SGA was diagnosed with a BW <10th percentile based on the Alexander et al. [21] BW chart as this is used in the study’s institution.
The secondary outcome was to compare the ability of FGR on both growth charts to predict a composite of severe neo- natal outcomes (SNO) when at least one of the following were diagnosed: RDS, IVH, NEC, neonatal sepsis, and peri- natal death. We also calculated the rate accuracy of the FMF fetal growth chart to diagnose SGA using the proposed FMF neonatal BW chart [22]. The rate of SGA was also obtained using this approach. In this study, RDS was defined as having a clinical and radiologic evidence of surfactant deficiency [23], and grade III and IV IVH were defined according to the Papile
et al. [24] classification. NEC stages 2 and 3 were defined ac- cording to Bell’s staging [25], neonatal sepsis was confirmed with positive blood cultures, and perinatal death comprised deaths occurring from 20 weeks of gestation to the first year of life. Gestational age was assessed using the ACOG guide- lines [26]. We defined low amniotic fluid as a deep vertical pocket (DVP) <2 cm.
Ultrasounds (USs) were performed using a GE Voluson E8 (GE Healthcare, Chicago, IL, USA) with a maternal-fetal med- icine fellow or an obstetric and gynecology resident. Both residents and fellows received training by certified sonogra- phers and maternal-fetal medicine specialists. The EFW was calculated every 2 weeks using the Hadlock et al.’s formula [13].
1. Statistical analysis
Statistical analysis was performed using STATA 15 (StataCorp., College Station, TX, USA). Categorical data were compared using χ
2test or Fischer’s exact text where appropriate and were presented as numbers (%). For continuous variables,
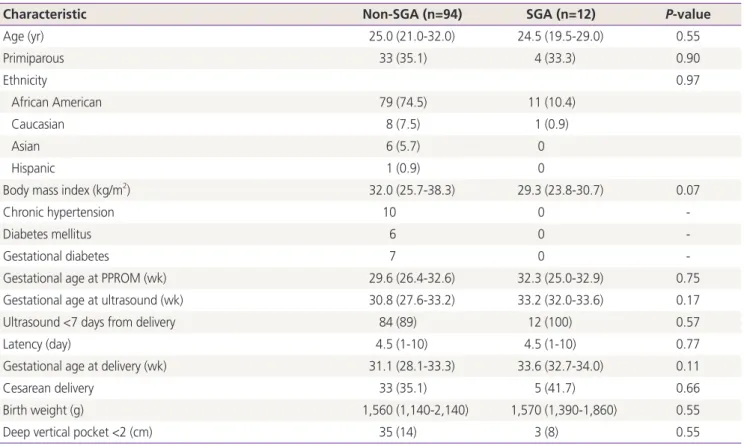
Table 1. Obstetrical characteristics of SGA
Characteristic Non-SGA (n=94) SGA (n=12) P-value
Age (yr) 25.0 (21.0-32.0) 24.5 (19.5-29.0) 0.55
Primiparous 33 (35.1) 4 (33.3) 0.90
Ethnicity 0.97
African American 79 (74.5) 11 (10.4)
Caucasian 8 (7.5) 1 (0.9)
Asian 6 (5.7) 0
Hispanic 1 (0.9) 0
Body mass index (kg/m
2) 32.0 (25.7-38.3) 29.3 (23.8-30.7) 0.07
Chronic hypertension 10 0 -
Diabetes mellitus 6 0 -
Gestational diabetes 7 0 -
Gestational age at PPROM (wk) 29.6 (26.4-32.6) 32.3 (25.0-32.9) 0.75
Gestational age at ultrasound (wk) 30.8 (27.6-33.2) 33.2 (32.0-33.6) 0.17
Ultrasound <7 days from delivery 84 (89) 12 (100) 0.57
Latency (day) 4.5 (1-10) 4.5 (1-10) 0.77
Gestational age at delivery (wk) 31.1 (28.1-33.3) 33.6 (32.7-34.0) 0.11
Cesarean delivery 33 (35.1) 5 (41.7) 0.66
Birth weight (g) 1,560 (1,140-2,140) 1,570 (1,390-1,860) 0.55
Deep vertical pocket <2 (cm) 35 (14) 3 (8) 0.55
Data presented as number (%) or median (interquartile range).
SGA, small for gestational age; PPROM, preterm prelabor rupture of membranes.
the distribution of the data was judged by the skewness and kurtosis tests. The Wilcoxon rank sum test was used for sta- tistical analysis when the data were not normally distributed;
continuous variables were presented as median and inter- quartile ranges.
The risk ratios (RRs) and 95% confidence interval (CI) were estimated using the non-SGA group as the reference group.
Sensitivity, specificity, and positive and negative predictive values for the primary and secondary outcomes using these
fetal weight standards were calculated. The discriminatory ability of each fetal growth chart was compared using the area under the receiver operating characteristic curves (AUC).
A P-value <0.05 was consider significant.
Results
A total of 127 women were treated for PPROM in our insti- tution during the study period. Of these, 106 women met the inclusion criteria and were included in the analysis (Fig. 1).
All of our patients completed at least one course of beta- methasone prior to delivery. Among them, 48 (45%) were screened positive for SGA using the FMF fetal growth chart and 22 (21%) were screened positive using the Hadlock method (RR, 7.6, 95% CI, 2.4-24.3, P<0.001). SGA was diag- nosed in 12 infants (11%). Of the 106 women included, 96 had an US within 7 days of delivery; 3 of the 12 infants in the SGA group had low amniotic fluid, and 35 of 90 participants (4 did not have documented DVP) had a low amniotic fluid measurement in the non-SGA group. The EFW percentage within 10% of the BW was comparable in those with SGA and those without SGA (75% vs. 65%; P=0.73). Demograph- ics and obstetrical characteristics did not significantly differ among infants with SGA and those without SGA (Table 1).
Both fetal growth charts had similar prediction accuracy and were statistically significant predictors of SGA (Hadlock:
Sensitivity
1.00 0.75 0.50 0.25
0.00
0.00 0.25 0.50 0.75 1.00 1-Specificity
FGR Hadlock ROC area: 0.7589 FGR FMF ROC area: 0.7615 Reference
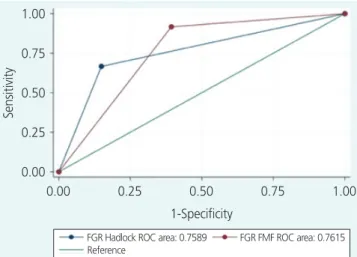
Fig. 2. Area under the receiver operating characteristics (ROC) curves for the prediction of small for gestational age by fetal growth restriction Fetal Medicine Foundation (FGR FMF) and the Hadlock fetal growth chart (FGR Hadlock).
Table 2. Detection of SGA and a composite of SNO and fetal growth restriction by the Hadlock and FMF weight charts in pregnancies complicated by PPROM (n=106)
Characteristic
Detection of SGA (n=12) Detection of SNO (n=42) Hadlock
a)FMF
b)SGA by FMF fetal
and neonatal charts
c)Hadlock
a)FMF
b)FMF neonatal chart
d)Sensitivity 66.7 91.7 74.4 19.0 52.3 47.6
Specificity 85.1 60.6 74.6 78.1 59.4 64.0
Positive predictive value 36.4 22.9 66.7 54.7 56.6 57.6
Negative predictive value 95.2 98.3 81.0 39.6 39.6 39.6
Positive screening tests 21.0 45.0 45.0 - - -
Prevalence of SGA 11.2 11.2 40.6 - - -
Data presented as percentage.
SGA, small for gestational age; SNO, severe neonatal outcomes; FMF, Fetal Medicine Foundation; PPROM, preterm prelabor rupture of mem- branes.
a)
Performance of the Hadlock chart to detect SGA based on the Alexander birthweight chart and to detect the composite of SNO;
b)Perfor-
mance of the FMF fetal chart to detect SGA based on the Alexander birthweight chart and to detect the composite of SNO;
c)Detection of SGA
by the FMF fetal and neonatal weight charts;
d)Detection of SNO by the neonatal FMF weight chart.
AUC, 0.76, RR, 7.6, 95% CI, 2.5-23, P<0.001; FMF: AUC, 0.76 RR, 13.3 95% CI 1.8-99.3, P≤0.001). The diagnostic accuracy for SGA using the Hadlock fetal growth chart was similar to that of the FMF fetal growth chart (Fig. 2). The sen- sitivity, specificity, and positive and negative predictive values are presented in Table 2. Four SGA neonates were lost using the Hadlock fetal growth chart, and only one SGA with the FMF fetal growth chart.
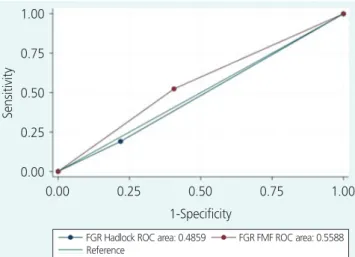
For our secondary outcomes, FGR by the Hadlock and FMF fetal growth charts had poor prediction abilities for the com- posite of SNO (Hadlock: AUC, 0.51, RR, 0.84, 95% CI, 0.5-1.6 vs. FMF: ROC, 0.56, RR, 1.6, 95% CI, 0.7-3.5, P=0.23) (Fig. 3).
SNO occurred in only 2 of the 12 SGA infants (17%) vs. 40 (42%) of the infants with appropriate weight for gestational age (RR, 0.4, 95% CI, 0.1-1.4, P=0.012). Both SGA infants with SNO had RDS, and one was diagnosed with NEC.
SGA would have been diagnosed in 40% of our partici- pants if both the fetal and neonatal FMF growth charts were utilized vs. 11% using the Alexander BW growth chart (RR, 3.3, 95% CI, 2.3-4, P≤0.001). The FMF fetal chart was a statistically significant predictor of SGA defined by the FMF neonatal standard (AUC, 0.74, RR, 3.5, 95% CI, 2.0-6.2, P≤0.001), but the FMF neonatal standard was not an ac- curate predictor for the composite of neonatal outcomes (AUC, 0.56, RR, 1.3, 95% CI, 0.8-2.1, P=0.23). The sensitiv- ity, specificity, and positive and negative predictive values for FMF standards are presented in Table 2.
Discussion
In this cohort study of pregnancies with PPROM, SGA was diagnosed in 11% of the infants, and we found that the Hadlock and FMF fetal growth charts have similar prediction accuracy for SGA (both with an AUC of 0.76). The FMF has a higher sensitivity (91.7% vs. 66.7%) and the Hadlock chart has a better specificity for the detection of SGA (85.1% vs.
60.6%). However, both growth charts had a low positive predictive value (21% for Hadlock and 45% for FMF). More- over, the rate of FGR with the FMF was 45% vs. 21% with the Hadlock chart. Both fetal growth standards were not statistically significant predictors of SNO, but only 2 of the 12 SGA neonates experienced SNO.
We had previously reported the rate of FGR (21%) in this cohort of pregnancies with PPROM [27]. The rate of FGR and SGA in PPROM depends on the definition, population, ges- tational age, and weight chart utilized. In a large multicenter randomized trial that included more than 1,800 pregnancies with PPROM from 34-36 weeks of gestation randomized to immediate delivery versus expectant management, an SGA rate of 3.6% was reported [28]. Another large multicenter observational study from France that included 702 gesta- tions, evaluating the effect of the duration of latency in pregnancies with PPROM from 24-32 weeks, only reported on those with BWs <3rd percentile (7.5% of their cohort) [29]. Neither of these studies described which weight charts were used. A small cohort of 69 pregnancies from Italy with PPROM between 24–31 weeks reported rates of FGR of 39%
and SGA rates of 26% [30]; they used an Italian neonatal BW chart [31].
However, the question of what chart to use to predict SGA still remains unclear. In theory, the optimal fetal growth chart will not only accurately detect SGA but will also identify those with adverse outcomes among those to screen posi- tive. A retrospective cohort from New Mexico that included over 1,500 women concluded that the Hadlock fetal growth chart was superior to the Eunice Kennedy Shriver National Institute of Child Health and Human Development (NICHD) race/ethnicity-specific standard in predicting both neonatal morbidity and SGA [15]. Another single-center retrospective study from Detroit, which included 3,437 African American mothers, reported that the NICHD race-specific weight stan- dard was superior to the Hadlock and other weight charts in predicting adverse outcomes in SGA infants [11]. Another
Sensitivity
1.00 0.75 0.50 0.25
0.00
0.00 0.25 0.50 0.75 1.00 1-Specificity
FGR Hadlock ROC area: 0.4859 FGR FMF ROC area: 0.5588 Reference