경락경혈학회지 Vol.28, No.3, pp.85 98, 2011∼ Korean Journal of Acupuncture
Ik-Han Yu, Sang-Lyoung Lee Dept. of Korean Medicine Woo-Suk University
Abstract
Objectives : The aim of this thesis is to examine the effect of acupuncture treatment at the GB37 on normal humans by using the power spectral analysis of the EEG.
Methods : EEG (Electroencephalogram) power spectrum exhibits site-specific and state-related differences in specific frequency bands. In this thesis, the power spectrum was measured by the complexity. the 32 channels EEG study was carried out in the 13 subjects (12 males ; age=22.58 years old, 1 females ; 22 years old).
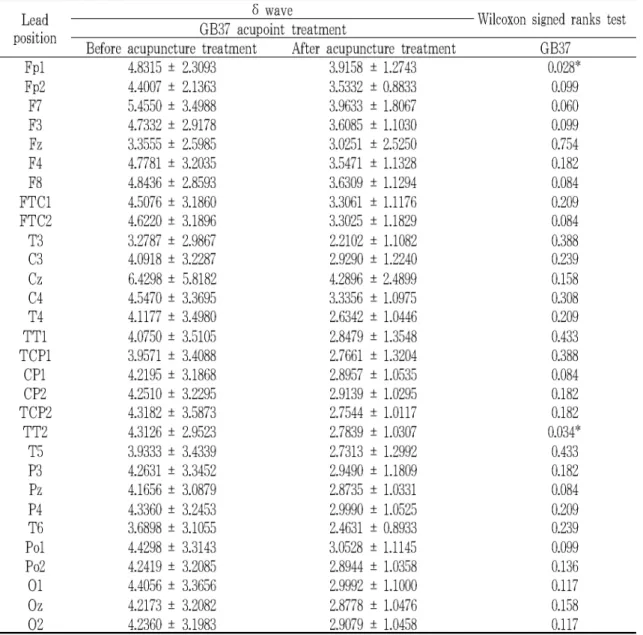
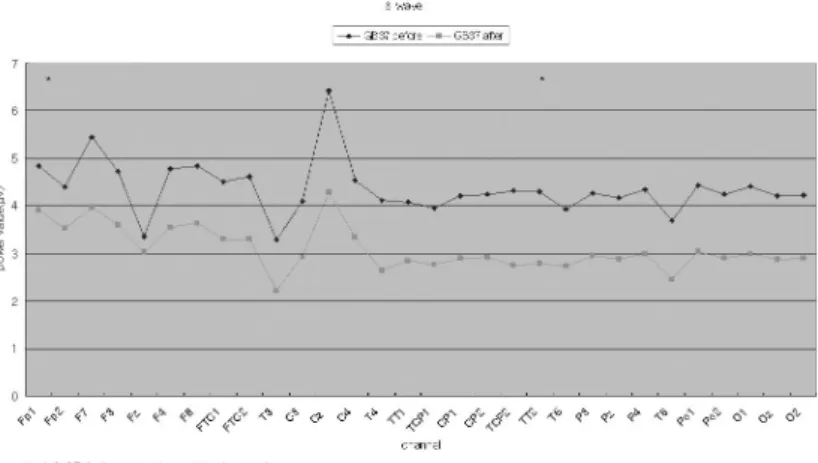
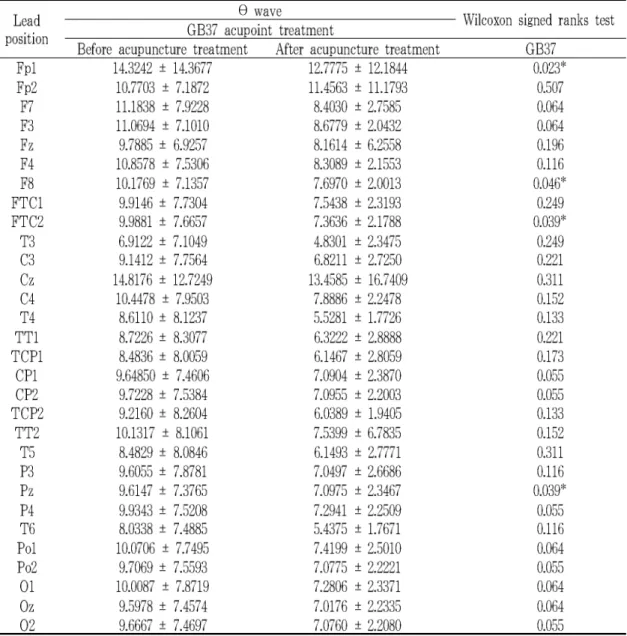
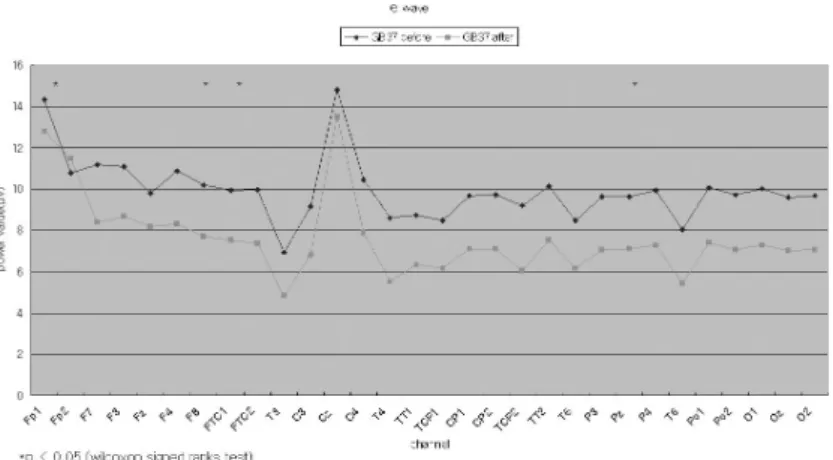
Results : In the α (alpha) band, the power values at F7, F3, F4, F8, FTC2, C4, T4, CP1, CP2, TCP2, TT2, Pz, P4, Po1, Po2, O1, Oz, O2 channels (p<0.05) during the GB37-acupoint treatment were significantly changed. And in many channels were decreased. In the β (beta) band, the power values at Cz, C4, T4, Tcp1, T6, Po1, O1, Oz, O2 channels (p<0.05) during the GB37-acupoint treatment were significantly changed. And in many channels were decreased. In the δ(delta) band, the power values at Fp1, TT2 channels (p<0.05) during the GB37-acupoint treatment were significantly changed. And in many channels were decreased. In the θ (theta) band, the power values at Fp1, F8, FTC2, Pz channels (p<0.05) during the GB37-acupoint treatment were significantly changed. And in many channels were decreased.
Conclusions : This results suggest that the acupuncture treatment at the GB37 significantly mostly change the power spectrum value on the alpha (18 channels), beta (9 channels) bands.
Key words : GB37, Acupuncture treatment, EEG, Complexity, power spectrum analysis
- 86 -
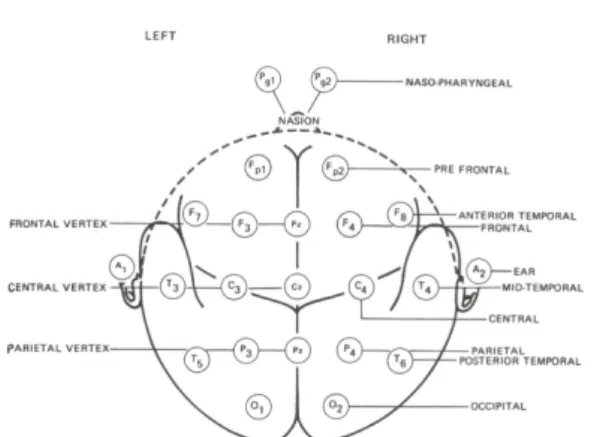
Fig. 1. Ten-twenty electrode system.
δ θ
α β
α
α
α
- 88 -
α
α
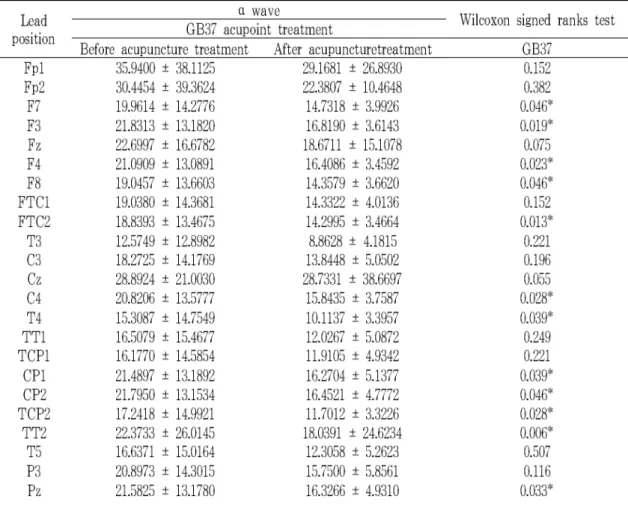
Table 1. The average and standard deviation values of α wave of the EEG from 30 channels before and after the GB37 acupuncture treatment
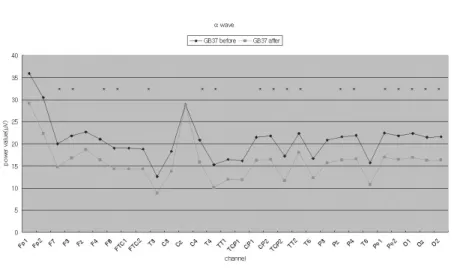
Graph 1. The changes of the average values in the α wave of the EEG between before and after GB37 acupuncture treatment.
α α
Fig. 2. Topographical display of EEG activity within the α range due to GB37 acupuncture treatment.
β
β
- 90 -
β α
β α
β
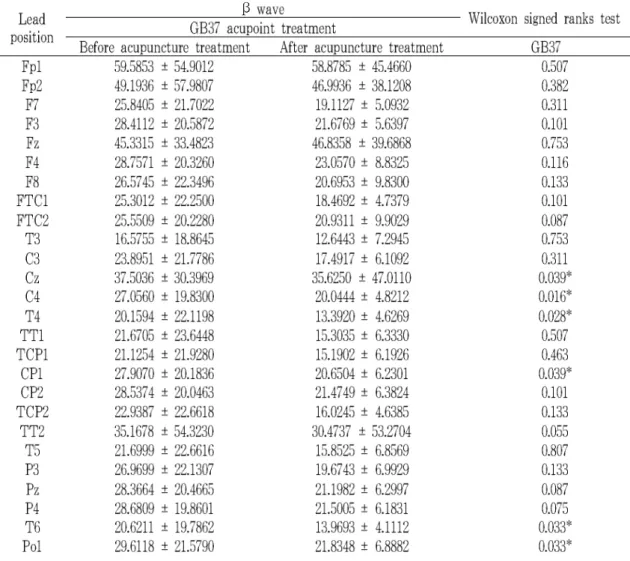
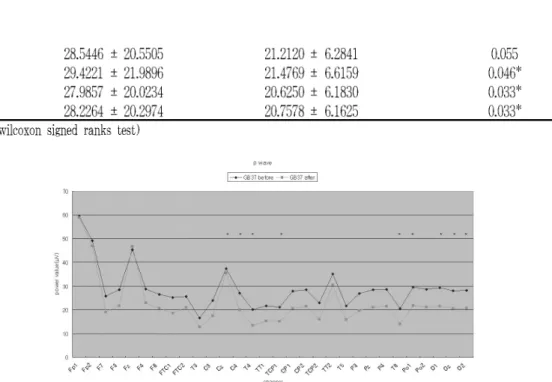
Table 2. The average and standard deviation values of β wave of the EEG from 30 channels before and after the GB37 acupuncture treatment
Graph 2. The changes of the average values in the β wave of the EEG between before and after GB37 acupuncture treatment.
β β
Fig. 3. Topographical display of EEG activity within the β range due to GB37 acupuncture treatment.
δ
δ
δ δ
- 92 - δ
Table 3. The average and standard deviation values of δ wave of the EEG from 30 channels before and after the GB37 acupuncture treatment
Graph 3. The changes of the average values in the δ wave of the EEG between before and after GB37 acupuncture treatment.
δ δ
Fig. 4. Topographical display of EEG activity within the δ range due to GB37 acupuncture treatment.
θ
θ
θ θ
- 94 - θ
Table 4. The average and standard deviation values of θ wave of the EEG from 30 channels before and after the GB37 acupuncture treatment
Graph 4. The changes of the average values in the θ wave of the EEG between before and after GB37 acupuncture treatment.
θ θ
Fig. 5. Topographical display of EEG activity within the θrange due to GB37 acupuncture treatment.
- 96 -
δ θ α
β
α β δ θ
α
β
δ
θ
α β
α
α
β
δ θ
α β
α
β
δ
θ
- 98 -