Characteristic of Fatigue Crack Behavior on the Mixed-Mode in Aluminum Alloy 5083-O
Gun-Ho Kim†․Kyu-Chun Cho1․Ho-Yeon Lee2․Young-Jun Won3 (Received February 22, 2011; Revised April 30, 2011; Accepted October 5, 2011)
Abstract:Generally, load conditions of machine or structure in fatigue destruction is occurred not under single load conditions but under mixed load conditions. However, the experiment under mixing mode is insufficient because of no having test standard to the behavior of crack under mixing mode and variety of test methods, and many tests are required. In this paper measured crack direction path by created figure capture system when a experiment. Also, we studied by comparison the behavior of crack giving the change of stress ratio and inserting beach mark. Through the test under mixing mode, advancing path of crack is indicated that advancing inclined angle θ (direction of specimen length) has increased depending on the increase of mixed mode impaction. It is indicated that according to the increase of mixed mode loading condition impaction under mixing mode, advancing speed of crack gets slow. Also, we found that inner crack(cross section of specimen) is progressed more rapidly than outer crack based on data through beach mark.
Key words:Mixed Mode, Direction of Fatigue Crack Growth, Fatigue Crack Growth Rate, Beach Mark, Striation
†Corresponding Author(Kunsan national university, E-mail:[email protected], Tel: 063-469-1846) 1 Kobe university graduate school of maritime science
2 Kobe university graduate school of maritime science 3 Kubota corporation
1. Introduction
Most machines and structures usually experience repeated load condition during use and it causes fatigue fracture[1-3]. Fatigue failure causes a crack in the condition that is lower than repeated yield stress and finally causes a breakdown[4]. Fatigue failure causes a lot of processing and material defect and it can be from the problems of the design; however, fatigue failure is mostly from the internal defects of materials such as inclusions or processing defects such as cracks[5]. The defects should be carefully monitored because they have growth behavior under various conditions by stress concentration. In general, the fatigue failure process
in machinery and structures is mainly caused by multi-axial stress state rather than uniaxial stress state. In application of actual machines and structures most crack problems are involved in mixed mode rather than single mode[1-3].
Thus, the need for research on mixed mode loading has been greatly recognized and many researchers are studying on cracks under mixed mode loading[5]. Mixed mode cracks are frequently occurred in machines or structures and the cracks are mixed type of both Mode I and Mode II[6-7].
From the reason, in this paper, the mixed mode of Mode Ⅰ and Mode Ⅱ which is most frequently observed among mixed loading conditions is
studied. According to recent trends in the shipbuilding industry, the demand for aluminum alloys vessels is increasing, and the characteristics of aluminum vessels such as fuel efficiency and using eco-friendly materials are high lighted. In addition, the amount of construction of aluminum vessels will be increased, because the vessels are able to move in high speed thanks to their lightweight. Based on the shipbuilding industry trends, aluminum alloy 5083-O which is a main exterior material of aluminum alloy vessels was selected as a test material, and fatigue crack growth and aspect in mixed mode which are mainly observed state of stress in vessels will be studied.
In addition, most of the destruction is occurred in mixed mode but the studies about mixed mode are only a few even though the mode is important. The mixed mode in this study was composed of existing single axle load condition studies and loading position change of existing 3-point bending fatigue tests. And growth behavior, growth rate, and crack path based on the weight of mixed mode were studied. A direct measurement method, which directly inserts the beach mark with the change of stress ratio was used for comparison study on the growth rate of fatigue crack. Also, the striation is measured using the SEM type Hitachi's S-4800.
Using the tested result, we are evaluated fatigue fracture surface characteristic.
2. Experimental procedure
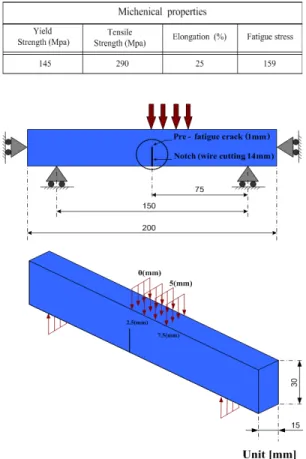
For this study, Al 5083-O was used as a material. This material has stronger resistance on corrosion and strength on the fatigue crack propagation[8]. For that reason, Al 5083-O is widely used for the marine structures, air structures, and pressure tanks. Table 1 and 2 is showed the chemical composition and mechanical properties of Al 5083-O. Figure 1 is showed the geometry and
Table 1: chemical composition of material
Table 2: Mechanical properties of material
Figure 1: Schematic diagram of test specimen and test condition
Figure 2: Detail of test load condition
were installed using a wire cutting, and in order to dimension of the specimen. 14mm initial crack preclude the influence on stress fields formed in the crack tips, 1mm pre-cracks were applied. Load structures were measured through three point bending test. In this test, the difference of load angles was measured to compare between single load and mixed load conditions like Figure 1. As shown in Figure 1, the loads were measured by moving from central notch to the outside with distance of 0mm, 2.5mm, 5mm, and 7mm. In terms of the angles from pre-crack to each loading point for the measurement in mixed condition from mode I to and II, if the point is 0mm, the angle between pre-crack and the point is 0° . If the points are 2.5mm, 5mm, and 7.5mm, the angles are 9.5°, 18.5°, and 26.5° respectively. In this test, as shown in Figure 2, a fatigue test machine was that hydraulic servopulser were used and test settings were 10Hz frequency, 6.540MPa σmax, and 0.654MPa σmin. For creation of beach mark, the σ
max and σmin were equal to 6.540MPa and 2.965MPa respectively.
3. Results and discussion
3.1 Fatigue crack growth direction
The fatigue cracks are not observed from the simple loading condition which is observed in complex loading condition of mixed mode condition on the machine and actual structures. Prediction of crack direction and path of crack is very difficult, because of a variety of forms of mixed mode fracture. This chapter is about the mixed mode fatigue cracks which are affected by both mode I and II. If the effect of mixed mode is increasing, the path of fatigue crack varies. This study compared between the path by mixed mode and the fatigue crack growth path by mode I condition.
Figure 5 shows the crack path from the increased
effect of mixed mode based on the test result of mode I. The fatigue crack direction is investigated using the X, Y coordinates as the tested specimen of picture which was taken by CCD camera in the test. X, Y coordinates values are showed the X, Y direction length value as figure 5. As shown in Figure 5, as the effects of mixed Mode increased, the tilt angle θ also decreased. In other words, the effects of mixed mode were reduced along with the point of action of load.
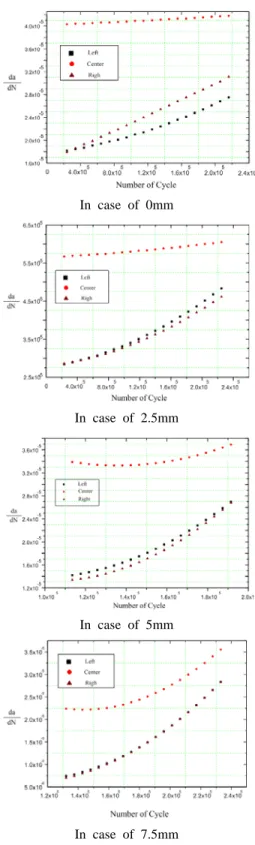
3.2 Fatigue crack growth rates
There are several ways to measure fatigue cracks and, in this study, the length of fatigue cracks per cycle was measured through a CCD camera and by a beach mark. Fatigue crack growth rates (da/dN), acquired from the measured beach mark data, by the impact of mixed mode were compared. In addition, the crack growth rates recorded by the CCD camera were compared with growth rates by mode II impact. Figure 3 is the graphs indicating the relationship between fatigue crack growth rates which are acquired from the beach mark and the cycle in center and edge area of fatigue fracture surface. The surface region crack growth velocity is not corrected in the figure 3 of 0mm case. we can be considered the various reason. The various reason is considered the thickness direction of not uniformity loading condition in the test. But, the crack growth velocity of different between interior region and surface region is clearly showed by the effect of plane stress and plane strain. Also, these figures indicated that fatigue crack growth rates of central area were definitely faster than that of both edge zone. The behavior of fatigue crack growth has been investigated using the thick specimen and plate specimen. from the investigation result is revealed that the different of
between surface region stress condition and interior stress condition. According the investigation, the different reasons of behavior of fatigue crack growth are revealed in order to various reason. In this test, the specimen stress conditions are conducted as specimen surface condition be placed on plane stress and interior of specimen condition be placed on the plane strain condition. In hence, the different of fatigue crack growth is investigated in this test. Also, this difference in retardation behavior between the surface and the interior was much large in the aluminum alloy than the steel[9-10]. From the experiment result Figure 3, 4 we can states the difference crack growth between the surface of specimen and interior of specimen.
Also, figure 6 shows a relationship of fatigue crack growth rate and the stress intensity factor range on the 0 mm and 7.5 mm as modeⅠ condition and mode Ⅰ+Ⅱ condition, respectively[11].
For the bending test specimen, the stress intensity factor range(ΔK) was obtained from
where ΔP is the load amplitude, α=a/W, a the distance between the crack tip and loading line, W the specimen width and B the specimen thickness[12]. the stress intensity factor values are evaluated on the mode Ⅰcondition. Because, θ value is small, it can decided that it is meaningless.
In the incipient stage 1, on the mixed - mode of potential fatigue crack rather then the modeⅠ loading condition show high potential fatigue crack.
Also, inclination value m is evaluated that the 7.5 mm inclination value m rather then 0 mm inclination m value show a small value on the crack propagation second stage, where m is a Paris'
law of m value. In hence, on the basis of this result, we can insist that the experiment result is pertinent.
3.3 Fatigue life
Figure 4 is clarify the fatigue crack growth lives. The fatigue crack growth lives were measured by the CCD camera. When the fatigue crack measurement, the fatigue crack length is measured from the fatigue crack starting point to fatigue crack tip inclusive. The fatigue crack length is measured the vertical length using the taken a picture. According to the measurement, if the measurement point gradually moved from 0mm to 7.5mm the fatigue crack growth rates became slow. In other words, increasing impact of mixed mode led to a longer fatigue crack growth life.
3.4 Fatigue fracture surface
Figure 7 is showed the beach mark of fatigue fractured surface using a metallurgical microscope. Figure 8 are photographs of striation of fatigue fractured surface by SEM type Hitachi's S-4800. According to the observation of beach mark in fatigue fractured surface through the metallurgical microscope. The beach mark shape is propagated to maintaining the shell shape as a pre crack shape. The shell shape of beach mark agreed with the direction of striation and different of between interior crack growth rate and surface crack growth rate. In terms of the gap of fatigue crack growth rates of striation per cycle, the central zone of fractured surface had a wide-gap but both edge zone had narrow-gaps. From the reasons, there was a difference of fatigue crack growth rate between them. In contrast, as the impact of mixed mode increased, the gaps were narrower.
In case of 0mm
In case of 2.5mm
In case of 5mm
In case of 7.5mm
Figure 3: Fatigue crack growth rate of center and edge
Figure 4: Fatigue crack life
Figure 5: Fatigue crack growth direction
Figure 6: Relationship of crack growth rate and stress intensity factor range
In case of 0mm
In case of 2.5mm
In case of 5mm
In case of 7.5mm
Figure 7: Beach mark of fatigue fracture surface
In case of 0mm
In case of 7.5mm
Figure 8: striation of fatigue fracture surface
4. Conclusions
In this study, we tested using a hydraulic fatigue test machine with AL 5083-O material under the mixed mode condition. Also, the beach mark is
inserted for to evaluated fatigue crack growth rate and the crack direction which is compared with each loading point location using the test specimen.
The characteristic of the fatigue crack growth direction and fatigue fractured surface were evaluated draw conclusions as follows.
1. The change of loading point location is led to the fatigue crack direction under mixed mode condition.
2. The fatigue life was increased when to moving loading point 0mm to 7.5mm.
3. The striation gaps were showed denseness conditions which to increasing a mixed mode effects.
4. The different of crack growth rate between the surface of crack and interior of crack is investigated in this study.
Acknowledgements
I thank all laboratory members who have helped me both physically and spiritually. Especially, I appreciated academic advisor Gun-ho Kim.
References
[1] Seong-Dae Choi, “Study on the materialzation of mixed mode (Mode Ⅰ + Ⅱ) by 2 axles fatigue test”, Journal of the Korean Society of Manufacturing Process Engineers, pp. 503-510, 2008.
[2] Seong-Dae Choi, “Design of 2 axles fatigue test JIG for the materialization of mixed mode (ModeⅠ+Ⅱ)”, Journal of the Korean Society of Industrials Application References vol. 11 no. 2, pp. 59-64, 2008.
[3] Seong-Dae Choi, “Behavior of fatigue crack growth with the variation of stress ratio under mixed mode”, Proceeding Journal of the Korean Society of Manufacturing Process Engineers, pp. 139-142, 2009.
[4] Gun-Ho Kim, “Relationship between pattern of
fatigue crack surface and fatigue crack growth behavior under K<SUB>Ⅲ</SUB> Mode-Four Point Shear in Al 5083-O”, Journal of the Korean Society of Marine Engineering, pp.
43-44, 2006.
[5] Gun-Ho Kim, “The Influence of the small circular hole defect on the fatigue crack propagation behavior in aluminum alloys”, Journal of the Korean Society of Marine Engineering, vol.32, no.6, pp. 834-840, 2008 [6] Kyoung-Ju Sohn, “Fatigue crack growth
behavior for rail steel under mixed mode variable amplitude loading”, Proceedings of the Korean Society of Mechanical Engineers, pp.
261-266, 2003.
[7] Sam-Hong Song, “Fatigue crack propagation behavior under mixed mode loading”, Proceedings of Korean Society for Precision Engineers, pp. 481-484, 2000.
[8] Costa, J. D and Branco, C. M., “Fatigue behaviour of medium strength AL-Mg 5083-O”, Advences in Fracture Research (ICF7), pp. 2467-2475, 1990.
[9] Matsuoka, T., and Tanaka, K,. “The influence of sheet thickness on delayed retardation phenomena in fatigue crack growth in HT80 steel and A5083O aluminum alloy”, Engineering Fracture Mechanics, vol. 13, pp.
293-306, 1980.
[10] Richards, C. E and Lindley T. C., “The influence of stress intensity and microstructure on fatigue crack propagation in ferritic materials”, Engineering Fracture Mechanics, vol. 4, pp. 951-978, 1972.
[11] Masanori, K. Maigefeiret,i M, and Hirotaka, S
“Study on fatigue crack growth criterion(1st report, paris' law of a surface crack under pure modeⅠ loading)”, The Japan Society of Mechanical Engineers, vol. 76, pp. 154-160, 2010.
[12] Y. Murakuni, “Stress Intensity Factors Handbook”, vol. 1, pp.13, 1986.
Author Profile
Gun-Ho Kim
1976, chonbuk national University mechanical engineering graduated (bachelor degree). 1989, Chosun national university mechanical engineering graduated (master degree). 1996, Chosun national university mechanical engineering graduated(doctor degree). (Current) Kunsan national university power system engineering professor.
Kyu-Chun Cho
2007, Kunsan national university power system engineering(bachelor degree).
2009, Kunsan national university power system engineering(master degree).
(Current) Kobe university Graduate school of maritime science.
Ho-Yeon Lee
2005, Kunsan national university power system engineering(bachelor degree).
2007, Kunsan national university power system engineering (master degree).
(Current) Kobe university Graduate school of maritime science.
Young-Jun Won
2003, Kunsan national university power system engineering(bachelor degree).
2005, Kunsan national university power system engineering(master degree).
2008, Kobe university graduate school ogf maritime science (doctor degree) (Current) Kubota corporation