https://doi.org/10.9721/KJFST.2021.53.1.63
63
©The Korean Society of Food Science and Technology
Physicochemical quality, antioxidant compounds, and activity of
‘Beta Tiny’ and ‘TY Nonari’ cherry tomatoes during storage
Minji Joung1 and Youngjae Shin1,* 1Department of Food Engineering, Dankook University
Abstract In this study, a comparative analysis was carried out between the ‘Beta Tiny’ and ‘TY Nonari’ cherry tomato
cultivars harvested at the pink and red stages. Samples of the red stage were stored at room temperature for 9 days, during which physicochemical qualities, antioxidant compounds, and activities were measured. As cherry tomato ripening and storage progressed, firmness was reduced, whereas the lycopene content increased. Total phenolic content and antioxidant activity showed no significant changes as ripening and storage progressed; however, total flavonoid content of ‘Beta Tiny’ showed a significant increase (p<0.05). The main polyphenols in the two cultivars were identified as chlorogenic acid, rutin, and (-)-epigallocatechin gallate, among which chlorogenic acid showed a significant decrease (p<0.05) as ripening and storage progressed. A strong correlation was found between total phenolic and flavonoid content (R=0.744), and ABTS radical scavenging activity (R=0.975). Additionally, a negative correlation was shown by lycopene and chlorogenic acid (R= −0.934).
Keywords: cherry tomato, ripening stage, lycopene, polyphenols, antioxidant
Introduction
Tomatoes are a fruit widely consumed worldwide, and as they are enriched with functional compounds, including vitamins, amino acids, flavonoids, polyphenols and carotenoids, tomatoes are regarded as a functional food (Kamiloglu et al., 2013; Zanfini et al., 2010). The most well-known phytochemical compound in tomatoes is lycopene, which accounts for approximately 80% of the total carotenoids (Rosales et al., 2011). According to Dumas et al. (2003), lycopene is responsible for the red color of tomatoes, defining the commercial value of tomatoes as well as reducing the risk of chronic diseases, including cardiovascular diseases and cancer (García-Valverde et al., 2013). Lycopene also exhibits a higher level of antioxidant activity than luteolin or β-carotene as it contains long-chain conjugated double bonds (Gómez-Romero et al., 2007). Rosales et al. (2011) reported that β-carotene, a type of carotenoid found in tomatoes, is not as nutritionally valuable as lycopene as it accounts for only 7% of total carotenoids. Johnson et al. (1997), on the contrary, reported that β-carotene is another important carotenoid compound as the bioavailability of lycopene increases upon consumption with β-carotene.
Cherry tomatoes (Solanum lycopersicum var. cerasiforme) are tomatoes of 2-3 cm size with high contents of sugar (fructose and glucose) organic acids (citric acid and malic acid), vitamins and minerals, which are higher than tomatoes in general (Kim et al.,
2012). Cherry tomatoes are climacteric fruits whose respiratory rate and ethylene production dramatically increase during the ripening stage to reduce the shelf life, making it difficult to maintain the freshness after harvest (Park et al., 2016). The transportation and storage conditions for quality control have become increasingly important, with increased consumption of fresh fruits and vegetables (Fagundes et al., 2015). Notably, the ripening of tomatoes could affect the color, firmness, taste, and antioxidant compounds, and many studies have attempted to find ways to delay the ripening of tomatoes and increase the storage period (Ilahy et al., 2011; Lee et al., 2013; Park et al., 2019). Cherry tomatoes are harvested in various ripening stages from the breaker stage to the red ripe stage, depending on the consumer and market preferences (Ilahy et al., 2011). During the ripening process of tomato, changes occur to the physicochemical quality, such as a color of the fruit surface and firmness, which are critical indicator of the shelf life and consumer sensory satisfaction (Bhandari and Lee, 2016; Fagundes et al., 2015). The color change in fruits and vegetables is a particularly important indicators of the shelf life and ripening stage (Fagundes et al., 2015). Tomatoes exhibit a multitude of colors throughout ripening as chlorophyll is gradually degraded and carotenoids produce lycopene, carotene, β-carotene, xanthophylls, and hydroxylated carotenoids (Giuliano et al., 1993). The antioxidant compounds in tomatoes are influenced by genetic and environmental factors as well as the ripening stage, with the contents of lycopene and β-carotene, in particular, being more influenced by ripening stage than cultivar (Leonardi et al., 2000). Thus, for nutritional or commercial purposes, it is highly significant to investigate the changes in the physicochemical quality and antioxidant composition of cherry tomatoes based on the ripening stage.
Numerous studies have been conducted to investigate the physicochemical quality and antioxidant composition of cherry *Corresponding author: Youngjae Shin, Department of Food
Engi-neering, Dankook University, Cheonan, Chungnam, 31116, Korea Tel: +82-41-550-3562
Fax: +82-41-559-7868 E-mail: [email protected]
Received December 23, 2020; revised January 6, 2021; accepted January 7, 2021
tomatoes in relation to the cultivar and the ripening stage (Kavitha et al., 2014; Opara et al., 2012). However, few studies have analyzed the changes in physicochemical quality and antioxidant composition of tomatoes during storage at room temperature after purchase. This study has thus compared the physicochemical quality, antioxidant compounds and activities of two cherry tomato cultivars of Chungcheong province, based on the ripening stage upon harvest and storage days.
Materials and Methods
Materials for experiment
‘Beta Tiny’ cultivar was harvested in April 2020 on a farm located in Buyeo-gun of Chungcheongnam-do, with the ‘TY Nonari’ cultivar harvested in June 2020 on a farm located in Yesan-gun of Chungcheongnam-do. The ripening stage of cherry tomatoes was categorized into the pink stage (50% of fruit surface turns into red color) and the red stage (100% of fruit surface turns into red color) based on the color of fruits. Cherry tomatoes in the stage were stored at room temperature for 9 days for subsequent analyses. Harvested cherry tomatoes were analyzed with respect to physicochemical quality, including the color on the day of harvest, soluble solid content (SSC), pH, titratable acidity (TA), firmness, and the lycopene content. Cherry tomatoes were snap-frozen using liquid nitrogen at −196oC, then stored in a −20oC freezer for subsequent analyses of antioxidant compounds and activities. Color
The color of cherry tomato, according to the ripening stage and storage day, was measured using a colorimeter (Chroma meter CR-400, Minolta, Tokyo, Japan). The color was expressed in lightness (L*, dark to light, on a scale of 0-100), redness (a*), and yellowness (b*) as the mean of triplicate measurements. The Chroma meter was calibrated regularly using the white calibration plate (Y=87.8, x=0.3156, y=0.3229)
SSC, pH, TA, firmness
To measure SSC, pH, and TA, 30 cherry tomato samples were homogenized using a blender (JB 3060, Braun Co., Kronberg, Germany). SSC was measured using a digital refractometer (PAL-1, Atago Co., Ltd., Tokyo, Japan) and expressed in the unit of oBrix, and pH was measured using a pH meter (Starter300, Ohaus Co., Ltd., Parsippany, NJ, USA). For TA, a method of neutralization titration was used, whereby 1 g of the blended solution was mixed with 100 mL distilled water, to which 3-4 drops of 1% phenolphthalein indicator was added for the reaction with 0.1 N NaOH. The measured TA was expressed as the content of citric acid, a key organic acid in tomatoes. The firmness of cherry tomatoes was measured using a fruit penetrometer (FHM-1, Dementra Co., Ltd., Tokyo, Japan) with 12Φ×10 mm cone-shaped probe, and the resistance upon the entry of the probe was measured and expressed in Newton (N).
Sample extraction
Aqueous methanol (80%) was used for the extraction of cherry
tomatoes. A 300 mL volume of 80% methanol was added to 30 g of the frozen sample, followed by homogenization using a blender; twice for 3 min blending and once for 2 min blending. The homogenized solution was filtered using a vacuum filtration apparatus and Whatman #2 filter paper (Whatman International Ltd., Kent, England), followed by concentration using a rotary vacuum concentrator (N-1000, Eyela, Tokyo, Japan). The concentrated solution was stored at −20oC for subsequent analysis of antioxidant compounds and activities (Yang et al., 2019).
Total flavonoid content
Total flavonoid content of the cherry tomato extract was measured using the colorimetric assay method (Shin, 2012). Briefly, 1 mL of the extract, 4 mL of deionized water, and 0.3 mL of 5% NaNO2 were mixed, vortexed, and incubated for 5 min at room temperature for the reaction to take place. Then, 0.3 mL of 10% AlCl3 was then added, and the mixture was vortexed and left for 6 min reaction at room temperature, after which the total volume was adjusted to 10 mL by adding 2 mL of 1 N NaOH and 2.4 mL of deionized water. The absorbance of the test solution was measured at 510 nm using a spectrophotometer (Optizen POP, Mecasys, Daejeon, Korea). The standard calibration curve was drawn with rutin hydrate, and the total flavonoid content was expressed as mg rutin equivalents (RE)/100 g fresh weigh (FW). Total phenolic content
Total phenolic content of the cherry tomato extract was measured using the Folin-Ciocalteu colorimetric assay method (Aryal et al., 2019; Yang et al., 2019). A total of 0.2 mL of the diluted extract was mixed with 2.6 mL of deionized water and 0.2 mL of Folin-Ciocalteu’s phenol reagent. The mixture was vortexed and left for 6 min at room temperature and 2 mL of 7% NaCO3 was then added. The mixture was vortexed and left for 90 min reaction at room temperature in a dark room. The absorbance of the test solution was measured at 750 nm using a spectrophotometer (Optizen POP). The standard calibration curve was drawn with gallic acid, and the total phenolic content was expressed as mg gallic acid equivalents (GAE)/100 g FW.
Lycopene content
Lycopene content of the samples was measured according to Bicanic’s method with some modifications (Bicanic et al., 2005). A total of 1 g of sample was mixed with deionized water, methanol, and diatomite (No. 545), and then vortexed. A glass filter (3G4) was set up with a 100 mL volumetric flask, and pressure was applied using an aspirator (AAA71015, Jeio Tech Co. Ltd., Daejeon, Korea), then the mixture containing cherry tomatoes was poured in. Methanol was then added for the suction filtration until the yellow color of the residual extract turned transparent. The glass filter was connected to a fresh 100 mL volumetric flask, and benzene was added until the red color of the residual extract turned transparent. The solution was massed up to the total volume of 100 mL using benzene, to be used as the test solution. The absorbance of the test solution was measured at 487 nm using a spectrophotometer (Optizen POP), and the lycopene
content was expressed as mg/100 g FW. Lycopene (mg/100 g)=
C: Concentration of lycopene (µg/mL), estimated from the calibration curve D: Dilution ratio of the test solution S: Amount of collected samples (g) Polyphenol content
Individual polyphenols in cherry tomato extract were analyzed using high-performance liquid chromatography (HPLC) according to the method described in Chen et al. (2001). The cherry tomato extract was diluted 5-fold (KH2PO4:MeOH:water=2:3:15) and filtered using a 0.45 mm syringe filter. Ten mL of the filtrate was injected to the Eclipse XDBC-18 column (150×4.6 mm, 5 μm, 40oC), and separation was carried out using HPLC (Agilent, Santa Clara, CA, USA). As the mobile phase, acetic acid (3%) and methanol were used in a gradient condition. The detector was set to 280 nm wavelength and 1.0 mL/min flow rate, and 10 μL of sample was injected for the analysis. The standard calibration curve was drawn with gallic acid, protocatechuic acid, catechol, catechin, chlorogenic acid, (-)-epigallocatechin gallate, caffeic acid, epicatechin, syringic acid, 4-methycatechol, epicatechin gallate, p-coumaric acid, ferulic acid, and rutin. The polyphenol content was expressed as mg/100 g FW.
DPPH radical scavenging activity
To test the antioxidant activity of the cherry tomato extract based on DPPH radical scavenging activity, the method described in Brand-Williams et al. (1995) was modified and used in this study. A 50 μL of the diluted sample solution and 2,950 μL of 0.2 mM DPPH solution were mixed and left to react for 30 min at room temperature in a dark room. Absorbance was then measured at 517 nm using a spectrophotometer (Optizen POP). The standard calibration curve was drawn with vitamin C, and the DPPH radical scavenging activity was expressed as mg vitamin C equivalents (VCE)/100 g FW.
ABTS radical scavenging activity
To test the antioxidant activity of the cherry tomato extract based on ABTS radical scavenging activity, the methods described in Sridhar and Charles (2019) and Yang et al. (2019) were modified and used in this study. A total of 20 μL of the diluted sample solution and 980 μL of ABTS solution were mixed and left to react for 10 min at 37oC. Absorbance was then measured using a spectrophotometer (Optizen POP) at 734 nm. The standard calibration curve was drawn with vitamin C, and the ABTS radical scavenging activity was expressed as mg VCE/100 g FW. Statistical analysis
For the statistical analysis of each experimental result, the SPSS 20 program (SPSS Inc. Chicago, IL, USA) was used to perform the analysis of variance (ANOVA). Duncan’s multiple range test was used to test the significance of differences among the samples (p<0.05). To analyze the correlations among the mean values of each variable, Pearson’s correlation coefficient was used. The data were expressed as the mean±standard deviation from triplicate determination.
Results and Discussion
Color
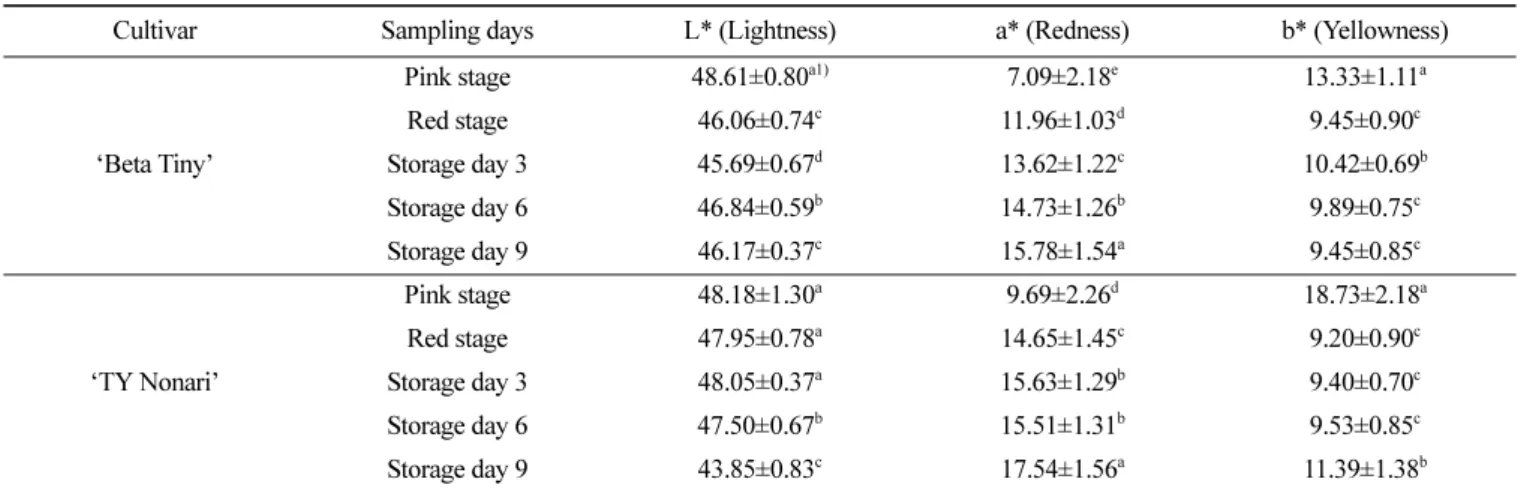
Changes in the cherry tomatoes color, according to the ripening stage and the storage day are shown in Table 1. The sample on the storage day of 9 showed the highest a* value for ‘Beta Tiny’ (15.78±1.54) and ‘TY Nonari’ (17.54±1.56), while ‘Beta Tiny’ showed a significant increase (p<0.05) in a* value as the ripening and storage progressed. In addition, both cultivars showed a significant increase in a* value as the ripening progressed from the pink stage to the red stage, while a significant decrease was found for L* and b* values of ‘Beta Tiny’ and b* value of ‘TY Nonari’. Bhandari and Lee (2016) measured the color of various cherry tomato cultivars in relation to ripening stage, and reported that a* value was significantly higher but L* and b* values were significantly lower in the red stage than the pink one. In general, b* value increases from the breaker stage to the pink stage but C×D×1000
S×1000
---Table 1. Hunter L*, a*, b* color of ‘Beta Tiny’ and ‘TY Nonari’ cherry tomatoes
Cultivar Sampling days L* (Lightness) a* (Redness) b* (Yellowness)
‘Beta Tiny’
Pink stage 48.61±0.80a1) 7.09±2.18e 13.33±1.11a
Red stage 46.06±0.74c 11.96±1.03d 9.45±0.90c Storage day 3 45.69±0.67d 13.62±1.22c 10.42±0.69b Storage day 6 46.84±0.59b 14.73±1.26b 9.89±0.75c Storage day 9 46.17±0.37c 15.78±1.54a 9.45±0.85c ‘TY Nonari’ Pink stage 48.18±1.30a 9.69±2.26d 18.73±2.18a Red stage 47.95±0.78a 14.65±1.45c 9.20±0.90c Storage day 3 48.05±0.37a 15.63±1.29b 9.40±0.70c Storage day 6 47.50±0.67b 15.51±1.31b 9.53±0.85c Storage day 9 43.85±0.83c 17.54±1.56a 11.39±1.38b
decreases from the pink stage to the red stage. This is due to the yellow-colored β-carotene being most abundant in the pink stage for tomatoes (Fraser and Bramley, 2004).
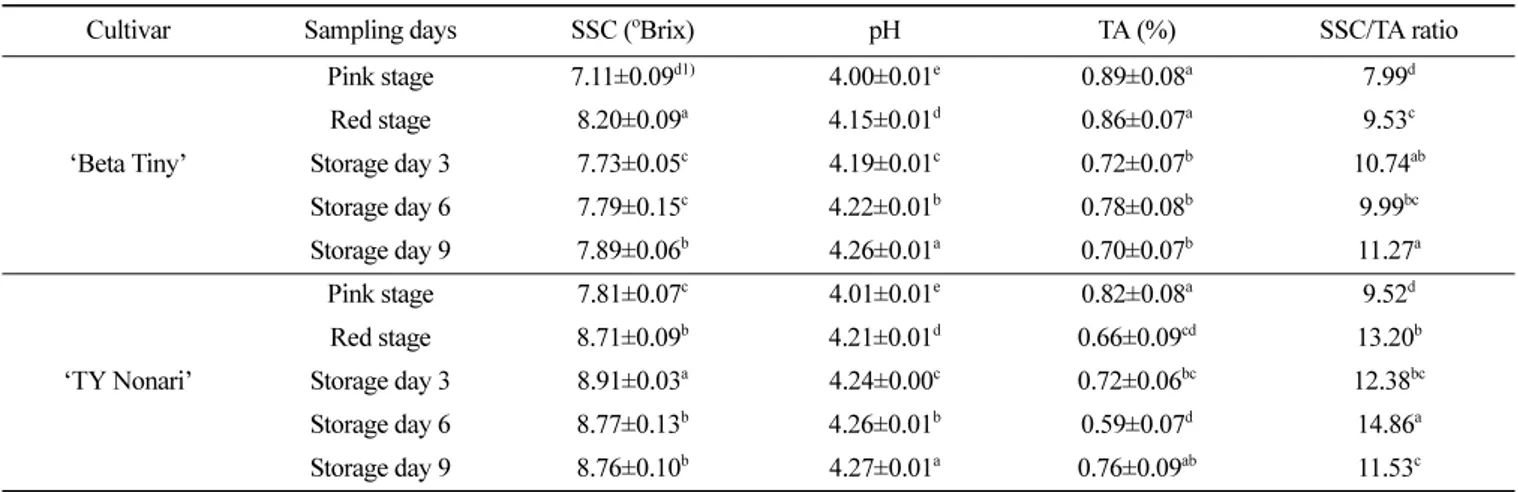
SSC, pH, TA, and SSC/TA ratio
The SSC, pH, TA, and SSC/TA ratio of cherry tomatoes according to the ripening stage and storage day are shown in Table 2. For both cultivars, SSC was the lowest with significance in the pink stage, and the highest SSC was found for ‘Beta Tiny’ in the red stage (8.20±0.09oBrix) and for ‘TY Nonari’ on storage day 3 (8.91±0.03oBrix). The pH of cherry tomatoes is influenced by the key organic acids, citric acid and malic acid (Adedeji et al., 2006). For both cultivars, the lowest pH was observed in the pink stage, whereas the pH showed a trend of significant increase in line with the increase in ripening stage and storage day. According to Lee et al. (2004), the pH of tomatoes increased with an increase in storage day at 25oC. Regarding TA, ‘Beta Tiny’ showed no significant difference between the pink stage and the red stage, while ‘TY Nonari’ showed a significantly higher level in the pink stage than in the red stage. According to Verheul et al. (2015), the level of TA decreased as the ripening of cherry tomatoes progressed. The taste of fruit is generally more outstanding when the SSC/TA ratio is high; i.e. with a certain level of high sugar content and adequate acidity. The SSC/TA ratio was the highest on storage day 9 for ‘Beta Tiny’ and on storage day 6 for ‘TY Nonari’.
Firmness
The firmness of cherry tomatoes according to the ripening stage and storage day is shown in Fig. 1. For cherry tomatoes in general, softening occurs due to a metabolic change induced by respiration and the action of pectinase, so that the firmness decreases during the storage (Park et al., 2019). The firmness of ‘Beta Tiny’ was 1.93±0.23 N in the pink stage, 1.38±0.20 N in the red stage, and 1.30±0.18 N on storage day 3, whereas the lowest firmness (1.14±0.16 N) was observed on storage day 9. The firmness of ‘TY Nonari’ was the highest in the pink stage (1.90±0.17 N) and the lowest with significant values on storage
day 9 (0.97±0.21 N). The firmness of ‘Beta Tiny’ and ‘TY Nonari’ decreased by 28.50 and 36.84%, respectively, as they matured from the pink stage to the red stage, and declined by 17.39 and 19.17%, respectively, as they were stored on the red stage to storage day 9.
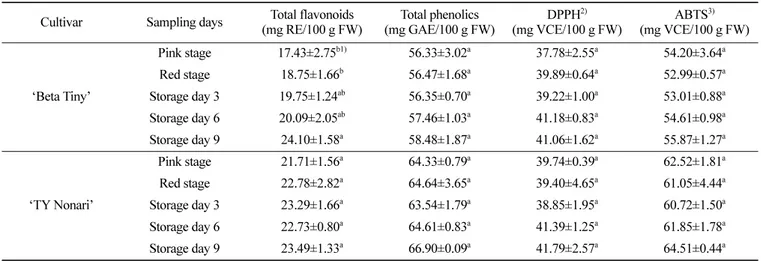
Total flavonoid content
The total flavonoid content of cherry tomatoes according to the ripening stage and storage day is shown in Table 3. The total flavonoids of ‘Beta Tiny’ and ‘TY Nonari’ in the pink stage were 17.43±2.75 and 21.71±1.56 mg RE/100 g FW, respectively. Flavonoids in tomatoes are synthesized more abundantly in the fruit surface than in the pulp, with the most well-known flavonoids being naringenin, chalcone, and rutin (Bovy et al., 2007). Among them, rutin (quercetin-3-O-rutinoside) is the most valued flavonoid compound based on antioxidant properties and bioavailability to humans (Slimestad and Verheul, 2005). ‘TY Nonari’ showed no significant difference in total flavonoid content in relation to ripening and storage. ‘Beta Tiny’, on the other hand, showed the highest total flavonoid content (24.10±1.58 mg RE/100 g FW) on Table 2. Soluble solid content (SSC), pH, titratable acidity (TA), and SSC/TA ratio of ‘Beta Tiny’ and ‘TY Nonari’ cherry tomatoes
Cultivar Sampling days SSC (oBrix) pH TA (%) SSC/TA ratio
‘Beta Tiny’ Pink stage 7.11±0.09d1) 4.00±0.01e 0.89±0.08a 7.99d Red stage 8.20±0.09a 4.15±0.01d 0.86±0.07a 9.53c Storage day 3 7.73±0.05c 4.19±0.01c 0.72±0.07b 10.74ab Storage day 6 7.79±0.15c 4.22±0.01b 0.78±0.08b 9.99bc Storage day 9 7.89±0.06b 4.26±0.01a 0.70±0.07b 11.27a ‘TY Nonari’ Pink stage 7.81±0.07c 4.01±0.01e 0.82±0.08a 9.52d Red stage 8.71±0.09b 4.21±0.01d 0.66±0.09cd 13.20b Storage day 3 8.91±0.03a 4.24±0.00c 0.72±0.06bc 12.38bc Storage day 6 8.77±0.13b 4.26±0.01b 0.59±0.07d 14.86a Storage day 9 8.76±0.10b 4.27±0.01a 0.76±0.09ab 11.53c
1)Mean separation within columns by Duncan's multiple range test (p<0.05) (n=3)
Fig. 1. Changes in firmness of ‘Beta Tiny’ and ‘TY Nonari’ cherry tomatoes during the storage. Different letters indicate significant differences by Duncan’s multiple range test (p<0.05).
storage day 9. Results indicated that the genotype of cherry tomatoes as well as ripening stage and storage day had a crucial impact on the antioxidant composition. According to Bovy et al. (2002), the compound rutin in tomatoes is rarely detected when the fruit color is green; however, its content rapidly increases as ripening progresses. In this study, the total flavonoid content of ‘Beta Tiny’ was the highest with significance (p<0.05) on storage day 9, which is presumed to be due to the synthesis of rutin in the fruit peel during the storage.
Total phenolic content
Total phenolic content of cherry tomatoes according to the ripening stage and storage day is shown in Table 3. Compared to tomatoes in general, cherry tomatoes have approximately 3-4 times higher total phenolic content. This is attributed to cherry tomatoes having a greater surface area to volume ratio, while the phenol compounds in tomatoes are more abundantly found in the fruit surface than in the pulp (Choi et al., 2014). The total phenolic content of ‘Beta Tiny’ and ‘TY Nonari’ showed no significant difference in relation to ripening and storage. However, the total phenolics of ‘Beta Tiny’ and ‘TY Nonari’ in the pink stage were 56.33±3.02and 64.33±0.79mg GAE/100 g FW, respectively. The total phenolic content of cherry tomatoes has been reported to either remain constant or show no significant change in the study by Cano et al. (2003) where the total phenolics of tomatoes were analyzed in relation to the ripening stage, and in the study by Slimestad and verheul (2005) where the total phenolics of orange-yellow cherry tomatoes were analyzed during storage for three weeks.
Lycopene content
Lycopene content in cherry tomatoes according to the ripening stage and storage day is shown in Fig. 2. With the increase in the ripening stage and storage day, lycopene content in the ‘Beta Tiny’ cultivar significantly increased (p<0.05). In the ripening process of tomatoes, chlorophyll is degraded and the synthesis of lycopene
among the carotenoids is promoted (Slimestad and Verheul, 2005; Pék et al., 2010). The lycopene content in cherry tomatoes was reported to increase as the ripening progressed in the study by Opara et al. (2012). In this study, as the ripening progressed from the pink to the red stage, the lycopene content showed an approximately 3-fold (‘Beta Tiny’) or 7-fold (‘TY Nonari’) increase, and from the red stage to storage day 9, the lycopene content increased to 67.28% in ‘Beta Tiny’ and 32.83% in ‘TY Nonari’. The lycopene contents of ‘Beta Tiny’ and ‘TY Nonari’ on storage day 9 were 9.15±0.06 and 12.34±0.41 mg/100 g FW, respectively.
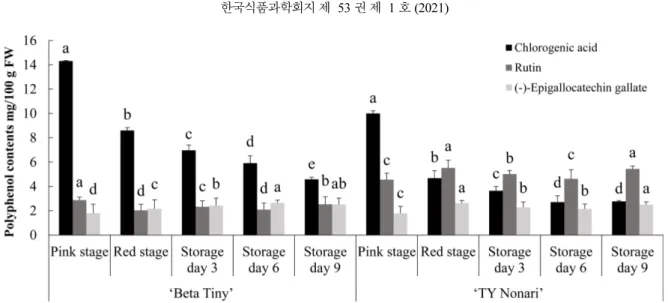
Polyphenol content
The polyphenol content in cherry tomatoes according to the ripening stage and storage day is shown in Fig. 3. The main polyphenols in the two cultivars were identified as chlorogenic acid, rutin, and (-)-epigallocatechin gallate. Chlorogenic acid Table 3. Total flavonoids, total phenolics, and total antioxidant activity of ‘Beta Tiny’ and ‘TY Nonari’ cherry tomatoes
Cultivar Sampling days Total flavonoids (mg RE/100 g FW) Total phenolics (mg GAE/100 g FW) DPPH2) (mg VCE/100 g FW) ABTS3) (mg VCE/100 g FW) ‘Beta Tiny’ Pink stage 17.43±2.75b1) 56.33±3.02a 37.78±2.55a 54.20±3.64a Red stage 18.75±1.66b 56.47±1.68a 39.89±0.64a 52.99±0.57a Storage day 3 19.75±1.24ab 56.35±0.70a 39.22±1.00a 53.01±0.88a Storage day 6 20.09±2.05ab 57.46±1.03a 41.18±0.83a 54.61±0.98a Storage day 9 24.10±1.58a 58.48±1.87a 41.06±1.62a 55.87±1.27a ‘TY Nonari’ Pink stage 21.71±1.56a 64.33±0.79a 39.74±0.39a 62.52±1.81a Red stage 22.78±2.82a 64.64±3.65a 39.40±4.65a 61.05±4.44a Storage day 3 23.29±1.66a 63.54±1.79a 38.85±1.95a 60.72±1.50a Storage day 6 22.73±0.80a 64.61±0.83a 41.39±1.25a 61.85±1.78a Storage day 9 23.49±1.33a 66.90±0.09a 41.79±2.57a 64.51±0.44a 1)Mean separation within columns by Duncan's multiple range test (p<0.05) (n=3)
2)DPPH: DPPH radical scavenging activity 3)ABTS: ABTS radical scavenging activity
Fig. 2. Changes in lycopene contents of ‘Beta Tiny’ and ‘TY Nonari’ cherry tomatoes during maturity and storage. Different letters indicate significant differences by Duncan’s multiple range test (p<0.05).
content in both cultivars showed a significant decrease (p<0.05) as ripening and storage progressed. Chlorogenic acid is a key phenol compound in tomatoes that accounts for 75% of the total phenolic content in green cherry tomatoes and 35% in red cherry tomatoes (Slimestad and Verheul, 2009). When orange-yellow cherry tomatoes were stored at 20oC for three weeks and the content of chlorogenic acid was measured, the content was found to decrease as the storage day increased (Slimestad and Verheul, 2005). The rutin content in ‘Beta Tiny’ and ‘TY Nonari’ in relation to the ripening stage and storage day fell in the range of 2.03-2.87 mg/ 100 g and 4.56-5.52 mg/100 g, respectively, while the content of (-)-epigallocatechin gallate fell in the range of 1.80-2.65 mg/100 g and 1.78-2.63 mg/100 g, respectively.
Antioxidant activity
Antioxidant activity in cherry tomatoes according to the ripening stage and storage day is shown in Table 3. The DPPH and ABTS radical scavenging activities in ‘Beta Tiny’ were 37.78-41.18 and 52.99-55.87 mg VCE/100 g FW, respectively, while those in ‘TY Nonari’ were 38.85-41.79 and 60.72-64.51 mg VCE/100 g FW, respectively. Both cultivars showed no significant difference in antioxidant activity in relation to ripening stage and storage day. ABTS radical scavenging activity in tomatoes in general has been reported by previous studies as 29.44±1.60 mg VCE/100 g FW (Chun et al., 2005) and 39.1±3.1 mg VCE/100 g FW (Floegel et al., 2011), indicating that the ABTS radical scavenging activity found in this study for cherry tomatoes was higher.
Correlation analysis
Correlations among the physicochemical quality, antioxidant compounds, and activities of cherry tomatoes are presented in Table 4. A strong correlation was found between a* value indicating redness and the contents of lycopene (R=0.930) and (-)-epigallocatechin gallate (R=0.755). Total flavonoid content in cherry tomatoes showed a strong correlation with the total phenolic
content (R=0.744) and the contents of lycopene (R=0.585) and rutin (R=0.495), as well as DPPH and ABTS radical scavenging activities (R=0.699 and R=0.710, respectively). Total phenolic content also showed a markedly high correlation with the content of rutin (R=0.867) and ABTS radical scavenging activity (R=0.975). On the contrary, a strong negative correlation was found between the key phenol compounds in cherry tomatoes; lycopene and chlorogenic acid (R=−0.934). Antioxidant activity and all antioxidant compounds showed a significant correlation, and a particularly strong correlation was found between the total phenolic content and the antioxidant activity. Tomatoes exhibit a relatively high content of total phenolics in comparison to other antioxidant compounds, which led to the high correlation between the total phenolic content and the antioxidant activity (Bhandari and Lee, 2016).
Conclusion
In this study, the physicochemical quality, antioxidant compounds and activities of cherry tomatoes were comparatively analyzed according to the cultivar, the ripening stage, and the storage day. The two examined cultivars both showed an increase in a* value and lycopene content with the increase in ripening stage and storage day, while the firmness was reduced. The total flavonoid content of the ‘Beta Tiny’ cultivar showed a significant increase as ripening and storage progressed, and the highest content with significance was found in cherry tomatoes on storage day 9. The total phenolic content, on the other hand, showed no significant difference between the two cultivars, and among polyphenol compounds, chlorogenic acid content was reduced in line with the increase in ripening the stage and the storage day. A strong correlation was found among the total phenolic, flavonoid content and ABTS radical scavenging activity, while a markedly high negative correlation was found between the contents of lycopene and chlorogenic acid.
Fig. 3. Polyphenol contents of ‘Beta Tiny’ and ‘TY Nonari’ cherry tomatoes. Vertical bars represent standard deviation and the different letters above the bar indicate significant differences based on Duncan’s multiple range test (p<0.05).
Cherry tom ato qual ity 69 a* b* Firmness SCC pH TA Total flavonoids Total phenolics Lycopene Chlorogenic acid Rutin (-)-Epigallo -catechin gallate DPPH ABTS L* -0.546**1) 0.252** 0.511** -0.191** -0.513** 0.039** -0.110** -0.007** -0.423** 0.417** 0.124** -0.448** -0.317** -0.017** a* -0.612** -0.933** 0.738** 0.965** -0.661** 0.551** 0.410** 0.930** -0.967** 0.325** 0.755** 0.348** 0.368** b* 0.747** -0.425** -0.762** 0.451** -0.185** 0.121** -0.696** 0.572** 0.139** -0.689** -0.162** 0.205** Firmness -0.764** -0.971** 0.688** -0.517** -0.339** -0.949** 0.935** -0.281** -0.695** -0.334** -0.281** SCC 0.694** -0.595** 0.537** 0.687** 0.798** -0.830** 0.714** 0.367** 0.196** 0.627** pH -0.682** 0.506** 0.279** 0.946** -0.945** 0.203** 0.774** 0.330** 0.225** TA -0.430** -0.363** -0.699** 0.754** -0.404** -0.414** -0.152** -0.320** Total flavonoids 0.744** 0.585** -0.622** 0.495** 0.331** 0.699** 0.710** Total phenolics 0.480** -0.514** 0.867** 0.046** 0.462** 0.975** Lycopene -0.934** 0.426** 0.666** 0.366** 0.432** Chlorogenic acid -0.447** -0.668** -0.339** -0.464** Rutin -0.002** 0.048** 0.842** (-)-Epigallo-catechin gallate 0.256** -0.008** DPPH 0.478**
Acknowledgments
This work was carried out with the support of “Cooperative Research Program for Agriculture Science & Technology Development (Project No. PJ01528102)” Rural Development Administration, Korea. We would like to thank Yena Kim and Seolji Baek for performing physical quality analyses.
References
Adedeji O, Taiwo KA, Akanbi CT, Ajani R. Physicochemical proper-ties of four tomato cultivars grown in Nigeria. J. Food Process. Preserv. 30: 79-86 (2006)
Aryal S, Baniya MK, Danekhu K, Kunwar P, Gurung R, Koirala N. Total phenolic content, flavonoid content and antioxidant potential of wild vegetables from Western Nepal. Plants 8: 96 (2019) Bhandari SR, Lee JG. Ripening-dependent changes in antioxidants,
color attributes, and antioxidant activity of seven tomato ( Sola-num lycopersicum L.) cultivars. J. Anal. Methods Chem. 2016: 1-13 (2016)
Bicanic D, Fogliano V, Luterotti S, Swarts J, Piani G, Graziani G. Quantification of lycopene in tomato products: comparing the performances of a newly proposed direct photothermal method and high-performance liquid chromatography. J. Sci. Food Agric. 85: 1149-1153 (2005)
Bovy A, de Vos R, Kemper M, Schijlen E, Almenar Pertejo M, Muir S, Collins G, Robinson S, Verhoeyen M, Hughes S, Santos-Buelga C, van Tunen A. High-flavonol tomatoes resulting from heterologous expression of the maize transcription factor gene LC and C1. Plant Cell 14: 2509-2526 (2002)
Bovy A, Schijlen E, Hall RD. Metabolic engineering of flavonoids in tomato (Solanum lycopersicum): the potential for metabolomics. Metabolomics 3: 399 (2007)
Brand-Williams W, Cuvelier ME, Berset CLWT. Use of a free radical method to evaluate antioxidant activity. Lebensm. Wiss. Technol. 28: 25-30 (1995)
Cano A, Acosta M, Arnao MB. Hydrophilic and lipophilic antioxi-dant activity changes during on-vine ripening of tomatoes ( Lycop-ersicon esculentum Mill.). Postharvest Biol. Technol. 28: 59-65 (2003)
Chen H, Zuo Y, Deng Y. Separation and determination of flavonoids and other phenolic compounds in cranberry juice by high-perfor-mance liquid chromatography. J. Chromatogr. A. 913: 387-395 (2001)
Choi SH, Kim DS, Kozukue N, Kim HJ, Nishitani Y, Mizuno M, Levin CE, Friedman M. Protein, free amino acid, phenolic, β-car-otene, and lycopene content, and antioxidative and cancer cell inhibitory effects of 12 greenhouse-grown commercial cherry tomato varieties. J. Food Compos. Anal. 34: 115-127 (2014) Chun OK, Kim DO, Smith N, Schroeder D, Han JT, Lee CY. Daily
consumption of phenolics and total antioxidant capacity from fruit and vegetables in the American diet. J. Sci. Food Agric. 85: 1715-1724 (2005)
Dumas Y, Dadomo M, Di Lucca G, Grolier P. Effects of environmen-tal factors and agricultural techniques on antioxidant content of tomatoes. J. Sci. Food Agric. 83: 369-382 (2003)
Fagundes C, Moraes K, Pérez-Gago MB, Palou L, Maraschin M, Monteiro AR. Effect of active modified atmosphere and cold storage on the postharvest quality of cherry tomatoes. Postharvest Biol. Technol. 109: 73-81 (2015)
Floegel A, Kim DO, Chung SJ, Koo SI, Chun OK. Comparison of ABTS/DPPH assays to measure antioxidant capacity in popular antioxidant-rich US foods. J. Food Compos. Anal. 24: 1043-1048 (2011)
Fraser PD, Bramley PM. The biosynthesis and nutritional uses of carotenoids. Prog. Lipid Res. 43: 228-265 (2004)
García-Valverde V, Navarro-González I, García-Alonso J, Periago MJ. Antioxidant bioactive compounds in selected industrial pro-cessing and fresh consumption tomato cultivars. Food Bioprocess
Technol. 6: 391-402 (2013)
Giuliano G, Bartley GE, Scolnik PA. Regulation of carotenoid bio-synthesis during tomato development. Plant Cell 5: 379-387 (1993)
Gómez-Romero M, Arráez-Román D, Segura-Carretero A, Fernán-dez-Gutiérrez A. Analytical determination of antioxidants in tomato: typical components of the Mediterranean diet. J. Sep. Sci. 30: 452-461 (2007)
Ilahy R, Hdider C, Lenucci MS, Tlili I, Dalessandro G. Antioxidant activity and bioactive compound changes during fruit ripening of high-lycopene tomato cultivars. J. Food Compos. Anal. 24: 588-595 (2011)
Johnson EJ, Qin J, Krinsky NI, Russell RM. Ingestion by men of a combined dose of β-carotene and lycopene does not affect the absorption of β-carotene but improves that of lycopene. J. Nutr. 127: 1833-1837 (1997)
Kamiloglu S, Boyacioglu D, Capanoglu E. The effect of food pro-cessing on bioavailability of tomato antioxidants. J. Berry Res. 3: 65-77 (2013)
Kavitha P, Shivashankara KS, Rao VK, Sadashiva AT, Ravishankar KV, Sathish GJ. Genotypic variability for antioxidant and quality parameters among tomato cultivars, hybrids, cherry tomatoes and wild species. J. Sci. Food Agric. 94: 993-999 (2014)
Kim JS, Kim JY, Chang YE. Physiological activities of saccharified cherry tomato gruel containing different levels of cherry tomato puree. Korean J. Food Cookery Sci. 28: 773-779 (2012)
Lee SH, Lee MS, Lee YW, Yeom HJ, Sun NK, Song KB. Effect of packaging material and storage temperature on the quality of tomato and plum fruits. Korean J. Food Preserv. 11: 135-141 (2004)
Lee SY, Yu HY, Choi DS, Hur SJ. A study on the types and growth patterns of microorganisms and quality characteristics in cherry tomatoes and head lettuces according to storage period and tem-perature. J. Korean Soc. Food Sci. Nutr. 26: 700-705 (2013) Leonardi C, Ambrosino P, Esposito F, Fogliano V. Antioxidative
activity and carotenoid and tomatine contents in different typolo-gies of fresh consumption tomatoes. J. Agric. Food Chem. 48: 4723-4727 (2000)
Opara UL, Al-Ani MR, Al-Rahbi NM. Effect of fruit ripening stage on physico-chemical properties, nutritional composition and anti-oxidant components of tomato (Lycopersicum esculentum) culti-vars. Food Bioprocess Technol. 5: 3236-3243 (2012)
Park CY, Kim YJ, Shin Y. Effects of an ethylene absorbent and 1-methylcyclopropene on tomato quality and antioxidant contents during storage. Hortic. Environ. Biotechnol. 57: 38-45 (2016) Park KM, Kim HJ, Kim SS, Lee SB, Jeong M, Park KJ, Koo M.
Effect of temperature treatment on postharvest quality of the cherry tomato (Lycopersicon esculentum var. cerasiforme). Korean J. Food Preserv. 26: 595-605 (2019)
Pék Z, Helyes L, Lugasi A. Color changes and antioxidant content of vine and post-harvest ripened tomato fruits. Hort. Sci. 45: 466-468 (2010)
Rosales MA, Cervilla LM, Sánchez-Rodríguez E, Rubio-Wilhelmi MDM, Blasco B, Ríos JJ, Soriano T, Catilla N, Romero L, Ruiz JM. The effect of environmental conditions on nutritional quality of cherry tomato fruits: evaluation of two experimental Mediter-ranean greenhouses. J. Sci. Food Agric. 91: 152-162 (2011) Shin Y. Correlation between antioxidant concentrations and activities
of Yuja (Citrus junos Sieb ex Tanaka) and other citrus fruits. Food Sci. Biotechnol. 21: 1477-1482 (2012)
Slimestad R, Verheul MJ. Content of chalconaringenin and chloro-genic acid in cherry tomatoes is strongly reduced during posthar-vest ripening. J. Agric. Food Chem. 53: 7251-7256 (2005)
Slimestad R, Verheul M. Review of flavonoids and other phenolics from fruits of different tomato (Lycopersicon esculentum Mill.) cultivars. J. Sci. Food Agric. 89: 1255-1270 (2009)
Sridhar K, Charles AL. In vitro antioxidant activity of Kyoho grape extracts in DPPH and ABTS assays: Estimation methods for EC50 using advanced statistical programs. Food Chem. 275: 41-49 (2019)
Verheul MJ, Slimestad R, Tjøstheim IH. From producer to consumer: greenhouse tomato quality as affected by variety, maturity stage
at harvest, transport conditions, and supermarket storage. J. Agric. Food Chem. 63: 5026-5034 (2015)
Yang H, Kim YJ, Shin Y. Influence of ripening stage and cultivar on physicochemical properties and antioxidant compositions of
aro-nia grown in South Korea. Foods 8: 598 (2019)
Zanfini A, Corbini G, La Rosa C, Dreassi E. Antioxidant activity of tomato lipophilic extracts and interactions between carotenoids and α-tocopherol in synthetic mixtures. LWT. 43: 67-72 (2010)