ORIGINAL ARTICLE Print ISSN 1738-6586 / On-line ISSN 2005-5013 10.3988/jcn.2009.5.4.167 J Clin Neurol 2009;5:167-172
Aggressive Glucose Control for Acute Ischemic Stroke Patients by Insulin Infusion
Nayoung Kim, MDa; Yunsook Jhang, MDb; Jong-Moo Park, MD, PhDa; Byung-Kun Kim, MD, PhDa; Ohyun Kwon, MD, PhDa; JungJu Lee, MDa; Ji-Sung Lee, MSc; Ja-Seong Koo, MD, PhDa
Department of aNeurology, Eulji General Hospital, Eulji University College of Medicine, Seoul, Korea Department of bNeurology, Dong-Eui Medical Center, Busan, Korea
Department of cBiostatistics, Korea University College of Medicine, Seoul, Korea
Received August 12, 2009 Revised September 28, 2009 Accepted September 28, 2009 Correspondence
Ja-Seong Koo, MD, PhD Department of Neurology, Eulji General Hospital, Eulji University College of Medicine, 280-1 Hagye-dong,
Nowon-gu, Seoul 139-711, Korea Tel +82-2-970-8609 Fax +82-2-974-7785 E-mail nrkoomh@chol.com
Background and PurposeaaHyperglycemia after acute ischemic stroke (AIS) is associated with poor outcomes. However, there is no consensus as to the optimal method for glycemic con- trol. We designed an insulin infusion protocol for aggressive glucose control and investigated its efficacy and safety.
MethodsaaWe applied our protocol to patients within 48 hours after AIS or transient ischemic attack (TIA) with an initial capillary glucose level of between 100 and 399 mg/dL (5.6-22.2 mmol/L). An insulin solution comprising 40 or 50 U of human regular insulin in 500 mL of 5%
dextrose was administered for 24 hours. Capillary glucose was measured every 2 hours and the infusion rate was adjusted according to a nomogram with a target range of 80-129 mg/dL (4.4- 7.2 mmol/L). Changes in glucose and overall glucose levels during insulin infusion were analy- zed according to the presence of diabetes or admission hyperglycemia (admission glucose
>139 mg/dL or 7.7 mmol/L) by the generalized estimating equation method.
ResultsaaThe study cohort comprised 115 consecutive patients. Glucose was significantly low- ered from 160±57 mg/dL (8.9±3.2 mmol/L) at admission to 93±28 mg/dL (5.2±1.6 mmol/L) during insulin infusion (p<0.05). Laboratory hypoglycemia (capillary glucose <80 mg/dL or 4.4 mmol/L) occurred in 91 (71%) patients, 11 (10%) of whom had symptomatic hypoglycemia.
Although glucose levels were significantly lowered and maintained within the target range in all patients, overall glucose levels were significantly higher in patients with diabetes or hypergly- cemia (p<0.05).
ConclusionsaaOur insulin-infusion protocol was effective in glycemic control for patients with AIS or TIA. Further modification is needed to improve the efficacy and safety of this pro- cedure, and tailored intervention should be considered according to glycemic status.
J Clin Neurol 2009;5:167-172 Key Wordsaaischemic stroke, hyperglycemia, insulin.
Introduction
Poststroke hyperglycemia (PSH) refers to elevation of blood glucose during the acute period of stroke and can occur in patients either with or without diabetes.1 Depending on de- finitions and study methodologies, between 20% and 50% of acute stroke patients have been shown to have hyperglyce- mia at presentation.2,3 Although the importance of PSH is not well established and the role of glycemic intervention in PSH remains unclear, many studies have suggested an association
between PSH and poor clinical outcomes.1,4-10 Intensive mo- nitoring and control of physiologic parameters such as blood pressure and glucose is also cited as one of the benefits of acute stroke unit care.11 Various methods of acute glycemic intervention for PSH have been reported and there is pre- sently no consensus as to the optimal method. In some stu- dies, the impact of PSH on clinical outcomes was apparent in nondiabetic hyperglycemia,1,12 and one study found dif- ferent therapeutic targets for diabetic and nondiabetic hyper- glycemia.13 The method or intensity of glycemic control may
also differ in patients with severe PSH. However, no study on acute glycemic intervention has addressed these issues.
As a part of critical pathway development for the manage- ment of patients with acute ischemic stroke (AIS) or transi- ent ischemic attack (TIA), we developed a protocol for ag- gressive glucose control in AIS patients by insulin infusion (AGAIN). We examined the efficacy and safety of our proto- col according to the presence of diabetes and the severity of admission hyperglycemia.
Methods
From January 2007, we developed a protocol using conti- nuous insulin infusion for acute glycemic control in patients with AIS or TIA. For protocol development, we hypothe- sized that the glycemic response to insulin infusion would differ according to the presence of diabetes or the severity of hyperglycemia on admission. We therefore initially develop- ed a single protocol for all patients, with the intention of am- ending it according to the results of a pilot study. We pro- spectively applied the single protocol to patients (aged 35-90 years) with AIS or TIA within 48 hours of symptom onset who had an admission capillary glucose level of 100-399 mg/dL (5.6-22.2 mmol/L). Patients with type 1 diabetes, dia- betic ketoacidosis or nonketotic hyperosmolar state, heart failure, acute myocardial infarction, infection or high fever, severe anemia, renal failure, or other conditions that the duty neurologist judged inappropriate for the protocol were ex- cluded. Patients with dementia, decreased consciousness, aph- asia, severe dysarthria, and those who could not be admitted to the intensive care unit were also excluded.
All enrolled patients fasted and were treated with our in- sulin-infusion protocol for 24 hours in the intensive care unit.
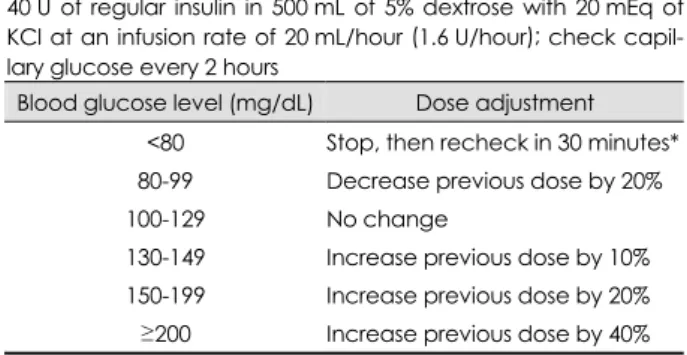
Insulin infusion after 24 hours was at the duty doctor’s dis- cretion and data obtained after 24 hours were not included in this analysis. During insulin infusion, all premorbid antidia- betic medications were temporarily discontinued. The initial protocol utilized an infusion of 500 mL of 5% dextrose with 50 U of human regular insulin (Humulin R, Lilly Korea, Se- oul, Korea) and 20 mmol of potassium chloride (KCl) start- ing at the rate of 20 mL/hour (2.0 U/hour human regular in- sulin). We subsequently modified our protocol to reduce the amount of insulin from 50 to 40 U (Table 1) due to concerns about hypoglycemia. Although the decision to apply the pro- tocol was based on glucose levels on admission, baseline ca- pillary glucose was also measured just before the start of in- sulin infusion.
Capillary glucose was measured during insulin infusion every 2 hours. The infusion rate was changed according to the dose adjustment nomogram of the protocol so as to maintain
the capillary glucose at 80-129 mg/dL (4.4-7.2 mmol/L). We defined laboratory hypoglycemia as a capillary glucose level of less than 80 mg/dL (4.4 mmol/L), and defined symptoma- tic hypoglycemia as the appearance of any of the symptoms of hypoglycemia (decreased consciousness, generalized weak- ness, dizziness, and sweating). Vital signs and clinical status were monitored every hour and serum electrolytes including sodium and potassium were checked every 12 hours.
All clinical data including National Institutes of Health Stroke Scale (NIHSS) score during admission and modified Rankin Scale (mRS) score at 3 months were prospectively registered on the Eulji Stroke Registry, which is incorporated with a Web-based stroke registry of Clinical Research Center for Stroke.14 Data on glucose measurements and hypoglyce- mia during insulin infusion were recorded prospectively in a separate AGAIN database using Microsoft Office Access 2003 software.
Based on the initial hypothesis, all patients were assigned to either the diabetic or nondiabetic group, and the hyper- glycemic (admission capillary glucose >139 mg/dL or 7.7 mmol/L) or normoglycemic (admission capillary glucose from 100-139 mg/dL or 5.6-7.7 mmol/L) group. Efficacy was ev- aluated for initial glycemic response at 2 hours after infusion, and the changes in glucose and overall glucose levels during insulin infusion. Safety was evaluated for the incidence of laboratory and symptomatic hypoglycemia.
Student’s t-test for continuous variables and χ2 test for categorical variables were used for statistical analysis. Ch- anges in glucose and overall glucose levels during insulin infusion was compared for capillary glucose measured every 2 hours using the generalized estimating equation method with baseline capillary glucose as a covariate. SAS version 9.1 was used for statistical analysis. Except where stated other- wise, the data are presented as mean±SD values.
Our protocol was developed to improve clinical practice rather than for academic purposes, and so we neither applied for the approval of the institutional review board of our hos-
Table 1. Intravenous insulin-infusion protocol Start dose
40 U of regular insulin in 500 mL of 5% dextrose with 20 mEq of KCl at an infusion rate of 20 mL/hour (1.6 U/hour); check capil- lary glucose every 2 hours
Blood glucose level (mg/dL) Dose adjustment
<80 Stop, then recheck in 30 minutes*
80-99 Decrease previous dose by 20%
100-129 No change
130-149 Increase previous dose by 10%
150-199 Increase previous dose by 20%
≥200 Increase previous dose by 40%
*If symptomatic, give 30 mL of 50% dextrose.
pital nor obtained written informed consent to participate from the patients.
Results
From July 2007 to February 2009, 115 consecutive patients were treated with our insulin-infusion protocol. Baseline ch- aracteristics are listed in Table 2. The mean age of the study cohort was 67 years, and 70 of them (60.9%) were male. One hundred (87%) patients had stroke, 47 (41%) had diabetes, and 57 (50%) had hyperglycemia on admission. Compared to admission glucose, baseline glucose increased by 15±12 mg/dL (8.3±0.7 mmol/L) in 17 (15%) patients, decreased by 41±42 mg/dL (2.3±2.3 mmol/L) in 87 (76%) patients, and remained the same in 11 (6%) patients. Baseline glucose was below 100 mg/dL (5.6 mmol/L) in 20 (17%) patients, of whom 5 had diabetes and 7 had hyperglycemia on admission.
Thirty-eight and 77 patients were treated with infusates in- cluding 50 and 40 U of insulin, respectively. The glucose level during the 24 hours of insulin infusion was 93±28
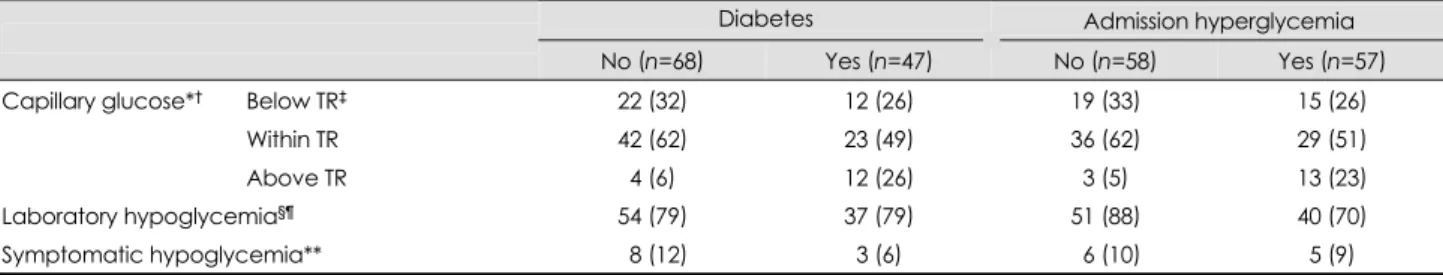
mg/dL (5.2±1.6 mmol/L), which was significantly lower than that measured on admission (p<0.05). Hypoglycemia occurr- ed in 91 (79.1%) patients and symptomatic hypoglycemia oc- curred in 11 (9.6%) patients, 6 (5.2%) of whom experienced recurrent symptomatic hypoglycemia. Insulin infusion was discontinued in four (3.5%) patients due to recurrent symp- tomatic hypoglycemia in three and decreased consciousness by stroke progression with persistent hyperglycemia in one patient. Thirty (79%) of 38 patients treated with 50 U of in- sulin and 61 (79%) of 77 patients treated with 40 U of insu- lin suffered laboratory hypoglycemia. The initial glycemic response at 2 hours after insulin infusion was differed signi- ficantly depending upon the presence of diabetes or hyper- glycemia on admission (Table 3, Fig. 1). More patients with diabetes or hyperglycemia had capillary glucose levels above the target range, while more patients without diabetes or hy- perglycemia had capillary glucose levels within or below the target range (p<0.05). The overall incidence of laboratory hypoglycemia was significantly higher in patients without hy- perglycemia on admission (Table 3).
One hundred and eleven patients completed the protocol and were analyzed for changes in glucose and overall glu- cose levels during the 24 hours of insulin infusion, according to the presence of diabetes and hyperglycemia on admission
Table 2. Baseline characteristics of the patients
Characteristics Values
Number of patients 115
Mean age, years (SD) 66.6 (12.8)
Male, n (%) 70 (60.9)
Diabetes, n (%) 47 (40.9)
Hypertension, n (%) 75 (65.2)
Mean HbA1c, % (SD) 6.5 (1.6)
Admission NIHSS score, median (IQR) 4 (3-7)
Transient ischemic attack, n (%) 15 (13.0)
Treated with intravenous rt-PA, n (%) 15 (13.0)
Admission hyperglycemia,* n (%) 57 (49.6)
Mean admission capillary glucose, mg/dL (SD) 160.0 (56.9) Mean baseline capillary glucose, mg/dL (SD) 131.6 (43.0)
*Admission capillary glucose >139 mg/dL (7.7 mmol/L).
NIHSS: National Institutes of Health Stroke Scale, IQR: interqu- artile range.
Table 3. Capillary glucose at 2 hours after insulin infusion, and incidence of hyperglycemia
Diabetes Admission hyperglycemia
No (n=68) Yes (n=47) No (n=58) Yes (n=57)
Capillary glucose*† Below TR‡ 22 (32) 12 (26) 19 (33) 15 (26)
Within TR 42 (62) 23 (49) 36 (62) 29 (51)
Above TR 04 (6)0 12 (26) 3 (5) 13 (23)
Laboratory hypoglycemia§¶ 54 (79) 37 (79) 51 (88) 40 (70)
Symptomatic hypoglycemia** 08 (12) 3 (6) 06 (10) 5 (9)
Data are number of patients (% of patients in each column).
*Results of capillary glucose measured at 2 hours after insulin infusion, †p<0.05 for comparisons between patients with and without dia- betes or with and without hyperglycemia on admission, ‡Target range, 80-129 mg/dL (4.4-7.2 mmol/L), §p>0.1 for comparison between patients with and without diabetes, ¶p<0.05 for comparison between patients with and without hyperglycemia on admission, **p>0.1 for comparisons between patients with and without diabetes or with and without hyperglycemia on admission.
TR: target range.
Percent of patients
70 60 50 40 30 20 10
0 No Yes No Yes
Diabetes Admission hyperglycemia
Below TR Within TR Above TR
Fig. 1. The distribution of capillary glucose at 2 hours after insulin infusion with regard to target range (TR).
(Table 4 and 5, Figs. 2 and 3). Glucose levels during insulin infusion changed significantly all groups (p<0.05 for a time effect). The interaction between change over time and groups was not significant (p>0.1 for an interaction effect between time and group), which means that changes in glucose levels over time were similar between comparison groups. Although mean glucose levels during insulin infusion were within the target range in all groups, the levels were significantly higher in patients with diabetes or hyperglycemia on admission (p<
0.05 for a group effect).
On clinical assessment, early neurological deterioration-
defined as an increase in the NIHSS score of 2 or more at 72 hours after admission-occurred in 16 (13.9%) patients. The mRS score at 3 months was available in 97 (84%) patients, 68 (70.1%) of whom had a favorable outcome (mRS score
≥2). The occurrence of neurologic deterioration or favorable outcome at 3 months did not differ between patients with and without diabetes or with and without hyperglycemia on admission (p>0.1).
Discussion
Despite the high prevalence of PSH, evidence regarding the effects of glycemic control is still lacking. Although current guidelines agree that PSH is associated with poor outcomes, there is no consensus on the frequency of monitoring, thres- holds for intervention, or method of glycemic control.15,16 Several investigators have recently reported on the efficacy and safety of glycemic control in AIS patients using different methods.17-20 However, there is a wide variation in current clinical practice. We developed our own protocol and were able to achieve effective glycemic control in patients with AIS or TIA. Based on our initial hypothesis, we assessed the glycemic response to our protocol according to the presence
Table 4. Levels of capillary glucose [mg/dL, mean (SD)] measur- ed every 2 hours during insulin infusion with comparison accord- ing to the presence of diabetes (n=111)
Diabetes Hours after starting
insulin infusion No (n=65) Yes (n=46) p*
02 94.3 (25.4) 109.4 (46.2) 04 90.0 (22.6) 094.9 (34.2) 06 92.1 (22.3) 095.0 (23.1) 08 86.5 (14.7) 086.7 (17.8) 10 85.7 (15.7) 088.2 (16.1) 12 86.5 (15.0) 089.1 (18.3) 14 85.0 (13.4) 091.4 (16.7) 16 84.0 (13.9) 089.5 (15.7) 18 85.2 (15.3) 090.3 (20.3) 20 83.5 (16.3) 091.2 (25.0) 22 84.6 (15.5) 093.0 (21.4) 24 85.4 (17.7) 092.0 (26.5)
†p<0.05
‡p<0.05
§p>0.1
*p values are for a group effect (†), time effect (‡), and interac- tion effect between time and group (§) by analysis using the ge- neralized estimating equation adjusted for baseline glucose.
Table 5. Levels of capillary glucose [mg/dL, mean (SD)] measur- ed every 2 hours during insulin infusion with comparison accord- ing to the presence of hyperglycemia on admission (n=111)
Admission hyperglycemia Hours after starting
insulin infusion No (n=55) Yes (n=56) p*
02 91.6 (25.4) 109.2 (42.5) 04 87.2 (28.7) 096.8 (26.6) 06 90.5 (21.5) 096.0 (23.4) 08 84.3 (14.9) 088.8 (16.8) 10 84.4 (14.6) 089.1 (16.8) 12 84.6 (15.5) 090.6 (17.0) 14 85.6 (14.0) 089.6 (16.1) 16 82.7 (12.6) 089.8 (16.1) 18 82.3 (14.6) 092.2 (19.1) 20 83.8 (18.4) 089.4 (22.3) 22 84.0 (15.3) 092.2 (20.7) 24 83.7 (19.4) 092.7(23.6)
†p<0.05
‡p<0.05
§p>0.1
*p values are for a group effect (†), time effect (‡), and interac- tion effect between time and group (§) by analysis using the ge- neralized estimating equation adjusted for baseline glucose.
Mean capillary glucose
(mg
/dL
) 120
110 100 90 80 70 60
Diabetes: no Diabetes: yes
Fig. 2. Change of mean capillary glucose during insulin infusion ac- cording to the presence of diabetes.
2 4 6 8 10 12 14 16 18 20 22 24 Hours during insulin infusion (hours)
Mean capillary glucose
(mg
/dL
) 120
110 100 90 80 70 60
Hyperglycemia: no Hyperglycemia: yes
Fig. 3. Change of mean capillary glucose during insulin infusion according to the presence of admission hyperglycemia.
2 4 6 8 10 12 14 16 18 20 22 24 Hours during insulin infusion (hours)
of diabetes or the severity of hyperglycemia measured on ad- mission.
There are several differences between our protocol and those described previously. For more stable glycemic control, all of our patients were ordered to fast during insulin infu- sion and we used 5% dextrose solution instead of normal sa- line. Unlike the method used in the United Kingdom Glu- cose Insulin in Stroke Trial,19 which was quite labor-inten- sive, insulin dose adjustment was achieved by simply chang- ing the infusion rate according to the nomogram. As a result, overall glucose levels were well maintained within the target range in all patients. Although laboratory hypoglycemia was quite common, symptomatic hypoglycemia occurred in less than 10% of our patients. The high prevalence of laboratory hypoglycemia can be attributed to several features of our study.
The definition of laboratory hypoglycemia (<80 mg/dL or 4.4 mmol/L) was more rigorous than that of other studies, in which it was defined as less than 54-72 mg/dL (3-4 mmol/L).17-19 In fact, despite the high incidence of laboratory hypoglycemia, the rate of symptomatic hypoglycemia in our study was com- parable to those reported in other studies.17-19
The severity of hyperglycemia in our study patients is ano- ther consideration. We did not apply our protocol to patients who could not communicate properly due to altered con- sciousness, aphasia, or severe dysarthria, thus excluding pa- tients with moderate-to-severe stroke. As a result, most pa- tients had only mild-to-moderate hyperglycemia on admis- sion. We also included TIA patients in whom glucose might decrease rapidly and significantly without insulin infusion as symptoms were resolving. A spontaneous decrease in glucose levels between admission and baseline measurements was also common, being observed in 76% of patients. Because the decision to apply the insulin-infusion protocol was based on the level of blood glucose at admission, insulin infusion was carried out even though the baseline glucose was less than 100 mg/dL (5.6 mmol/L), which occurred in 17% of study patients. Inclusion of patients who had admission glucose le- vels that were already within the target range (i.e., 100-130 mg/dL or 5.6-7.2 mmol/L) should also be considered. We included those patients because late hyperglycemia can oc- cur more than 48 hours after stroke.5
Fasting during insulin infusion is another important factor.
As mentioned above, all patients in our study fasted during insulin infusion because we thought that fasting for a short period after acute stroke is tolerable and can offer more st- able glycemic control. Fasting is not mandatory in the gene- ral management of acute stroke if the patient does not suffer dysphagia. However, neurological deficit is unstable in the acute period and oral intake should be cautiously monitored because of the risk of aspiration. Although oral intake might
have reduced the occurrence of hypoglycemia, it could also have caused fluctuations in blood glucose, thus rendering glycemic control more difficult and complicated.
In general, selecting the appropriate target range is impor- tant for optimizing the efficacy and safety of treatment. There is currently no consensus on these issues for glycemic con- trol in acute stroke patients.4 In an animal experiment, glu- cose levels exhibited a U-shaped association with cortical necrosis and total infarction, with a nadir for cerebral necro- sis in the 108-126 mg/dL (6-7 mmol/L) range.21 In humans, most studies addressing the association between glucose levels and poor outcome used predefined and arbitrary th- resholds of 108-150 mg/dL (6-8.3 mmol/L).5-10 A meta-an- alysis revealed an association between admission glucose levels higher than 110-126 mg/dL (6.1-7.0 mmol/L) and in- creased risk of mortality in nondiabetic ischemic stroke pa- tients. A recent study found that the optimal cutoff level for poor outcome at 3 months was 155 mg/dL (8.5 mmol/L).22 In glycemic intervention studies after AIS, the lower th- resholds for inclusion ranged from 108 to 170 mg/dL (6.0- 9.4 mmol/L) and target ranges were usually between 70 and 130 mg/dL (3.9 and 7.2 mmol/L).17-19 This variability was attributable to differences in patient populations (differences in stroke subtypes, diabetic population, and time window af- ter stroke). In a large study involving 1,259 patients with AIS, hyperglycemia was associated with worse clinical out- comes only in nonlacunar stroke.23 Because hyperglycemia decreases over time after stroke,24 including patients visiting during the late time window may influence the threshold level for poor outcomes.
There is evidence that the benefit of glycemic control or the optimal range of glucose concentration differs between diabetic and nondiabetic hyperglycemia.1,13 To address this issue, different approaches using different regimens and com- parative analysis according to the patient characteristics are needed. In our analyses we found that the treatment effect of our protocol did not differ with the presence of diabetes and hyperglycemia on admission. Capillary glucose levels during insulin infusion decreased significantly and were maintained within the target range. However, although the difference was small, overall glucose levels during insulin infusion were persistently higher in patients with diabetes or hyperglyce- mia on admission. Considering that most patients had mild- to-moderate hyperglycemia, this finding suggests that pa- tients with severe diabetic hyperglycemia exhibit a different glycemic response.
More intensive control may be needed for patients treated with thrombolysis. Several studies involving patients treated with thrombolytic therapy have demonstrated a profound ef- fect of hyperglycemia on outcomes.25-27 As mentioned above,
the time window after stroke should also be considered. Un- like other studies,17-20 we extended the treatment time win- dow to 48 hours after symptom onset. It has been shown that PSH is prolonged despite current guidelines-based treatment, and two hyperglycemic phases were identified: an early hy- perglycemia phase within the first 8 hours and a later phase 48-88 hours poststroke.5 The timing of glycemic control after stroke may not necessarily follow conventional windows for other acute therapies, and patients may be potential candi- dates for benefit at 12-24 hours after acute stroke.
In conclusion, our insulin-infusion protocol was feasible and could achieve successful glycemic control in AIS or TIA patients with mild-to-moderate hyperglycemia. However, la- boratory hypoglycemia was common, and differed signifi- cantly between patients with and without diabetes or admis- sion hyperglycemia during treatment. To improve the effi- cacy and safety of this protocol, further modification is need- ed and tailored intervention should be considered, especially for patients with severe diabetic hyperglycemia.
Acknowledgements
This study was supported by 2004 Eulji Research Grant (EIRG-05-020- 11E30).
This study was sponsored by Sanofi-Aventis Korea and Boryung Co., Ltd
REFERENCES
1. Capes SE, Hunt D, Malmberg K, Pathak P, Gerstein HC. Stress hy- perglycemia and prognosis of stroke in nondiabetic and diabetic pa- tients: a systematic overview. Stroke 2001;32:2426-2432.
2. Scott JF, Robinson GM, French JM, O’Connell JE, Alberti KG, Gray CS. Prevalence of admission hyperglycaemia across clinical subtypes of acute stroke. Lancet 1999;353:376-377.
3. Toni D, Sacchetti ML, Argentino C, Gentile M, Cavalletti C, Frontoni M, et al. Does hyperglycaemia play a role on the outcome of acute isc- haemic stroke patients? J Neurol 1992;239:382-386.
4. Quinn TJ, Lees KR. Hyperglycaemia in acute stroke--to treat or not to treat. Cerebrovasc Dis 2009;27 Suppl 1:148-155.
5. Allport L, Baird T, Butcher K, Macgregor L, Prosser J, Colman P, et al. Frequency and temporal profile of poststroke hyperglycemia using continuous glucose monitoring. Diabetes Care 2006;29:1839-1844.
6. Baird TA, Parsons MW, Phanh T, Butcher KS, Desmond PM, Tress BM, et al. Persistent poststroke hyperglycemia is independently asso- ciated with infarct expansion and worse clinical outcome. Stroke 2003;
34:2208-2214.
7. Kiers L, Davis SM, Larkins R, Hopper J, Tress B, Rossiter SC, et al.
Stroke topography and outcome in relation to hyperglycaemia and dia- betes. J Neurol Neurosurg Psychiatry 1992;55:263-270.
8. Weir CJ, Murray GD, Dyker AG, Lees KR. Is hyperglycaemia an in- dependent predictor of poor outcome after acute stroke? Results of a long-term follow up study. BMJ 1997;314:1303-1306.
9. Williams LS, Rotich J, Qi R, Fineberg N, Espay A, Bruno A, et al.
Effects of admission hyperglycemia on mortality and costs in acute ischemic stroke. Neurology 2002;59:67-71.
10. Gentile NT, Seftchick MW, Huynh T, Kruus LK, Gaughan J. Decre- ased mortality by normalizing blood glucose after acute ischemic st-
roke. Acad Emerg Med 2006;13:174-180.
11. Bhalla A, Wolfe CD, Rudd AG. Management of acute physiological parameters after stroke. QJM 2001;94:167-172.
12. Stead LG, Gilmore RM, Bellolio MF, Mishra S, Bhagra A, Vaidy- anathan L, et al. Hyperglycemia as an independent predictor of worse outcome in non-diabetic patients presenting with acute ischemic stroke.
Neurocrit Care 2009;10:181-186.
13. Farrokhnia N, Björk E, Lindbäck J, Terent A. Blood glucose in acute stroke, different therapeutic targets for diabetic and non-diabetic pa- tients? Acta Neurol Scand 2005;112:81-87.
14. Clinical Research Center for Stroke. Available at: http://www.stroke- crc.or.kr/.
15. European Stroke Organisation (ESO) Executive Committee; ESO Writing Committee. Guidelines for management of ischaemic stroke and transient ischaemic attack 2008. Cerebrovasc Dis 2008;25:457- 507.
16. Adams HP Jr, del Zoppo G, Alberts MJ, Bhatt DL, Brass L, Furlan A, et al. Guidelines for the early management of adults with ischemic stroke: a guideline from the American Heart Association/American Stroke Association Stroke Council, Clinical Cardiology Council, Car- diovascular Radiology and Intervention Council, and the Atherosc- lerotic Peripheral Vascular Disease and Quality of Care Outcomes in Research Interdisciplinary Working Groups: the American Academy of Neurology affirms the value of this guideline as an educational tool for neurologists. Stroke 2007;38:1655-1711.
17. Bruno A, Kent TA, Coull BM, Shankar RR, Saha C, Becker KJ, et al.
Treatment of hyperglycemia in ischemic stroke (THIS): a randomized pilot trial. Stroke 2008;39:384-389.
18. Bruno A, Saha C, Williams LS, Shankar R. IV insulin during acute cerebral infarction in diabetic patients. Neurology 2004;62:1441-1442.
19. Gray CS, Hildreth AJ, Sandercock PA, O’Connell JE, Johnston DE, Cartlidge NE, et al. Glucose-potassium-insulin infusions in the ma- nagement of post-stroke hyperglycaemia: the UK Glucose Insulin in Stroke Trial (GIST-UK). Lancet Neurol 2007;6:397-406.
20. Walters MR, Weir CJ, Lees KR. A randomised, controlled pilot study to investigate the potential benefit of intervention with insulin in hy- perglycaemic acute ischaemic stroke patients. Cerebrovasc Dis 2006;
22:116-122.
21. Zhu CZ, Auer RN. Optimal blood glucose levels while using insulin to minimize the size of infarction in focal cerebral ischemia. J Neu- rosurg 2004;101:664-668.
22. Fuentes B, Castillo J, San José B, Leira R, Serena J, Vivancos J, et al.
The prognostic value of capillary glucose levels in acute stroke: the GLycemia in Acute Stroke (GLIAS) study. Stroke 2009;40:562-568.
23. Bruno A, Biller J, Adams HP Jr, Clarke WR, Woolson RF, Williams LS, et al. Acute blood glucose level and outcome from ischemic st- roke. Trial of ORG 10172 in Acute Stroke Treatment (TOAST) In- vestigators. Neurology 1999;52:280-284.
24. Gray CS, Hildreth AJ, Alberti GK, O’Connell JE; GIST Collabor- ation. Poststroke hyperglycemia: natural history and immediate mana- gement. Stroke 2004;35:122-126.
25. Alvarez-Sabin J, Molina CA, Montaner J, Arenillas JF, Huertas R, Ribo M, et al. Effects of admission hyperglycemia on stroke outcome in reperfused tissue plasminogen activator--treated patients. Stroke 2003;34:1235-1241.
26. Bruno A, Levine SR, Frankel MR, Brott TG, Lin Y, Tilley BC, et al.
Admission glucose level and clinical outcomes in the NINDS rt-PA Stroke Trial. Neurology 2002;59:669-674.
27. Els T, Klisch J, Orszagh M, Hetzel A, Schulte-Mönting J, Schu- macher M, et al. Hyperglycemia in patients with focal cerebral ische- mia after intravenous thrombolysis: influence on clinical outcome and infarct size. Cerebrovasc Dis 2002;13:89-94.